. 2025 Jan 2;19(1):wraf108.
doi: 10.1093/ismejo/wraf108.

Polyphenol rewiring of the microbiome reduces methane emissions

Affiliations

Polyphenol rewiring of the microbiome reduces methane emissions

Bridget B McGivern et al. ISME J. .

Abstract

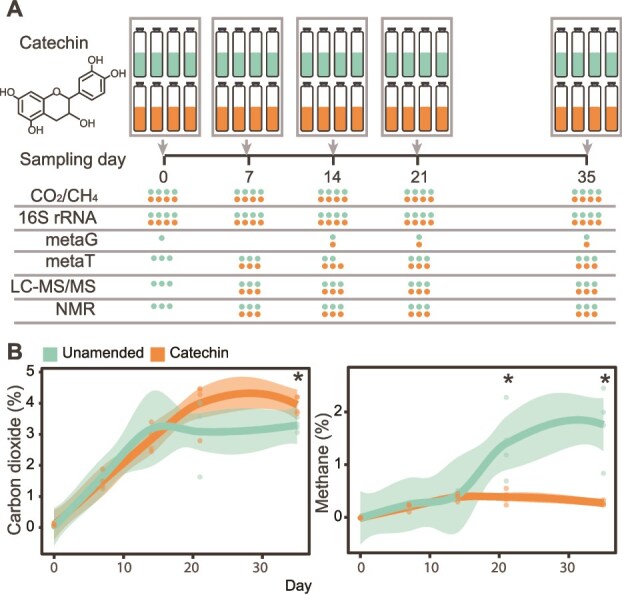
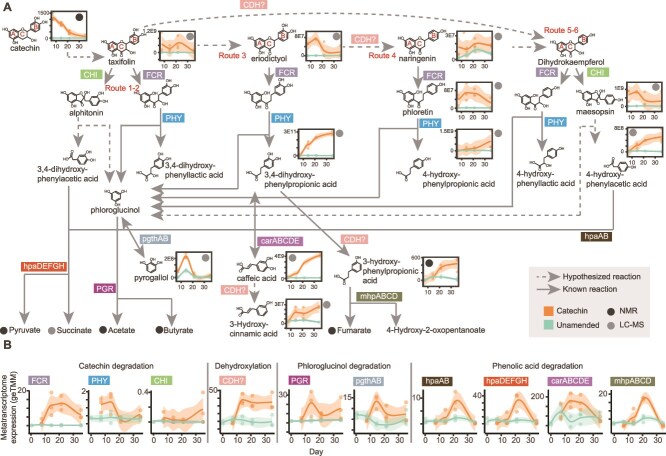
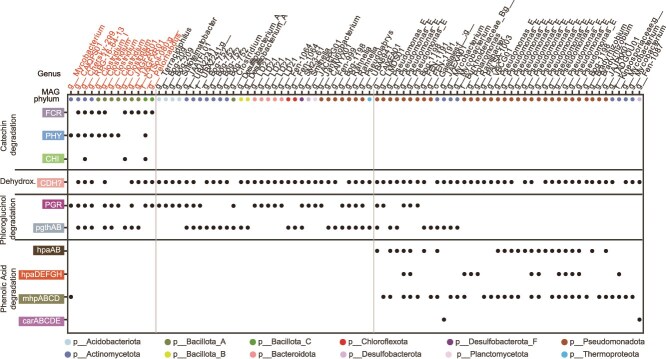
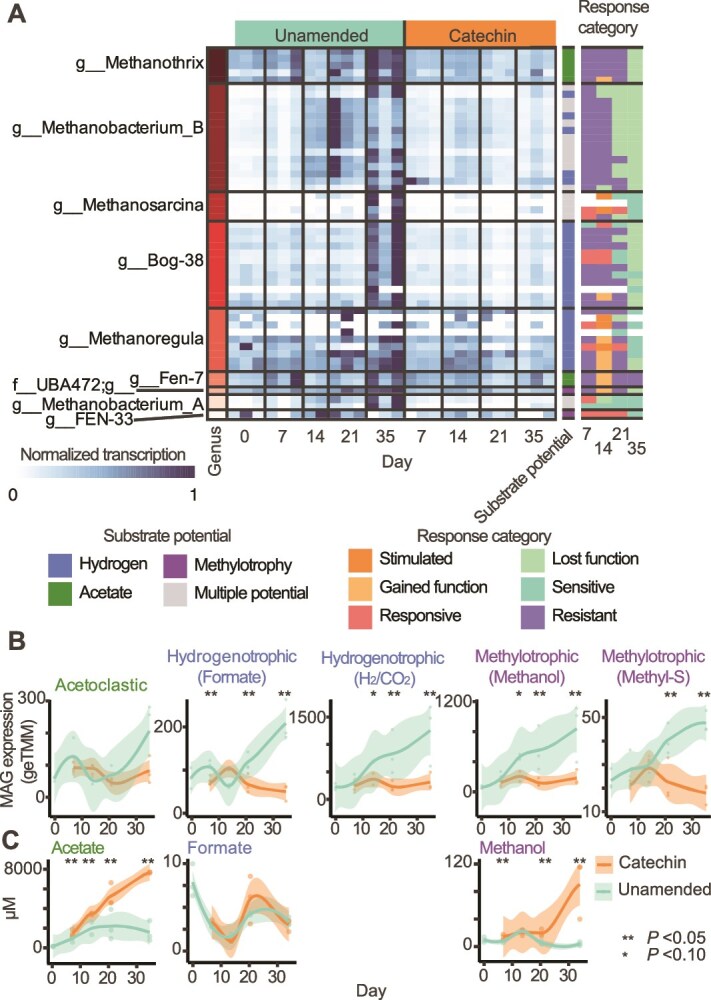
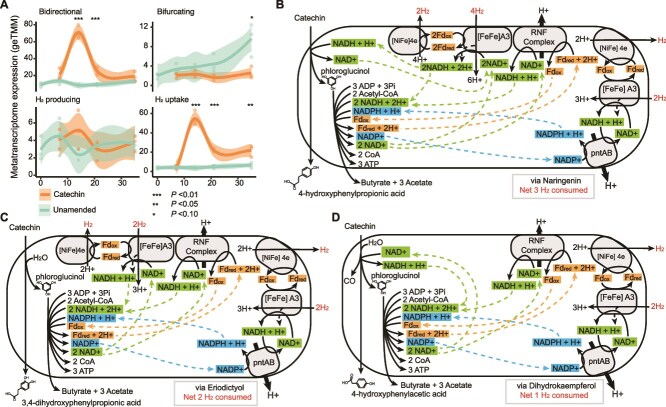
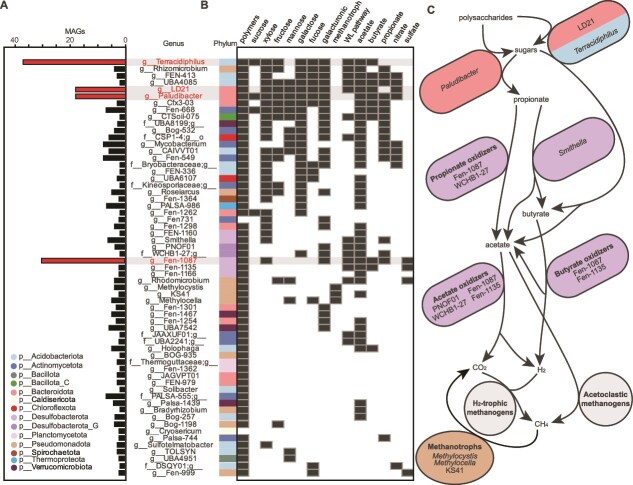
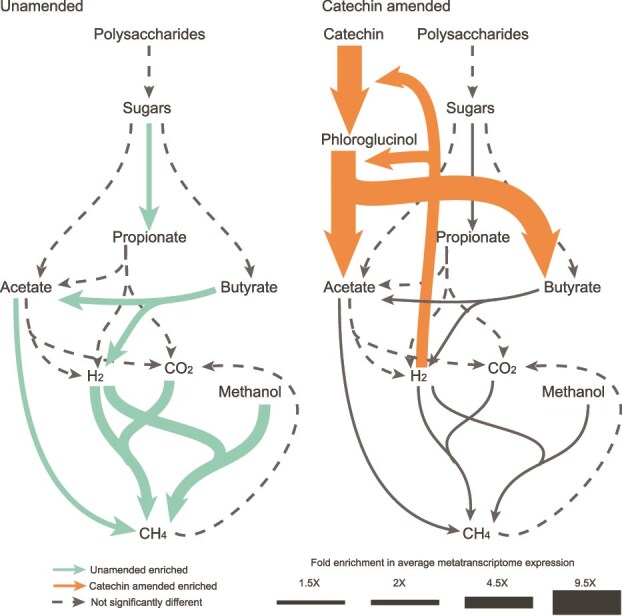
Methane mitigation is regarded as a critical strategy to combat the scale of global warming. Currently, ~40% of methane emissions originate from microbial sources, which is causing strategies to suppress methanogens-either through direct toxic effects or by diverting their substrates and energy-to gain traction. Problematically, current microbial methane mitigation knowledge lacks detailed microbiome-centered insights, limiting translation across conditions and ecosystems. Here we utilize genome-resolved metatranscriptomes and metabolomes to assess the impact of a proposed methane inhibitor, catechin, on greenhouse gas emissions for high-methane-emitting peatlands. In microcosms, catechin drastically reduced methane emissions by 72%-84% compared to controls. Longitudinal sampling allowed for reconstruction of a catechin degradation pathway involving Actinomycetota and Clostridium, which break down catechin into smaller phenolic compounds within the first 21 days, followed by degradation of phenolic compounds by Pseudomonas_E from Days 21 to 35. These genomes co-expressed hydrogen-uptake genes, suggesting hydrogenases may act as a hydrogen sink during catechin degradation and consequently reduce hydrogen availability to methanogens. In support of this idea, there was decreased gene expression by hydrogenotrophic and hydrogen-dependent methylotrophic methanogens under catechin treatment. There was also reduced gene expression from genomes inferred to be functioning syntrophically with hydrogen-utilizing methanogens. We propose that catechin metabolic redirection effectively starves hydrogen-utilizing methanogens, offering a potent avenue for curbing methane emissions across diverse environments including ruminants, landfills, and constructed or managed wetlands.

Keywords: ecology; metabolism; metagenome; metatranscriptome; methane; methanogens; microbiomes; polyphenols; rumen; wetlands.


Conflict of interest statement

The authors declare no competing financial interests.

Figures

Figure 1
Figure 1
Peat microcosm experiment designed to investigate the impact of catechin amendment on microbial carbon cycling. (A) Unamended and catechin-amended peat microcosms were constructed and destructively sampled over 35 days at the indicated time points. Headspace carbon dioxide (CO2) and methane (CH4) were sampled, DNA was extracted for 16S rRNA gene amplicon sequencing and metagenomes (metaG), RNA was extracted for metatranscriptomes (metaT), and metabolites were extracted and analyzed for metabolomes (LC–MS/MS, NMR). Circles correspond to the number of replicates for each data type in the final dataset, colored by treatment. (B) Headspace carbon dioxide (left) and methane (right) concentrations over time in the microcosms. Concentrations are given as percent (%) volume. Timepoints with significant differences by treatment are noted with an asterisk (*, Kruskal-Wallis test, P <0.05). Smoothed curves were fit using a LOESS model, representing the local average gas concentration (n = 4). Individual replicates are plotted as points and the shaded area represents the 95% confidence interval.
Figure 2
Figure 2
Dynamics of microbiome datasets. (A) Bray-Curtis distances were calculated at each timepoint between catechin-amended and unamended replicates for 16S rRNA amplicon (16S rRNA) samples, metatranscriptome (metaT), and metabolite (LC-MS) samples. MetaT samples were analyzed at three levels: metaT abundance of individual genes (gene), metaT abundance of genes summed at the MAG level (MAG), and metaT abundance of gene functions, summing genes at the annotation level (annotation). Significant differences are noted at the top with brackets (Kruskal-Wallis with post-hoc Dunn’s, Benjamini-Hochberg adjusted P <0.05). The lower and upper boxplot edges represent the 25th and 75th percentiles, respectively, and the middle line is the median. The whiskers extend from the median by 1.5X the interquartile range. (B) The proportion of MAGs transcriptionally expressing genes in the six response categories at each timepoint. See Supplementary Fig. 2 for the data at each time point, and methods for classification methods.
Figure 3
Figure 3
Catechin degradation pathway reconstructed from metabolite and metatranscriptome data. (A) Reconstruction of catechin and phenolic acid degradation pathways using metatranscriptome and metabolite data. Flavonoid rings are labelled A, B, and C to correspond to the text. Hypothesized reactions are noted with dotted arrows, and known reactions are shown with solid arrows. Metatranscriptome-detected genes encoding enzymes for the reactions are noted on the arrows. Metabolite dynamics of LC–MS or NMR detected metabolites are shown adjacent to compound name, from Days 7–35, with detection method noted with a grey and black dot, respectively. Concentrations of NMR metabolites are given in μM and normalized peak area is given for LC–MS metabolites. Dynamics of the short chain acids are shown in Supplementary Fig. 11. (B) Gene expression profiles of catechin and phenolic acid degrading genes across metatranscriptomes. Enzymes are organized by the part of catechin degradation with which they are involved. Timepoints (Days 0–35) are given on the x-axis, and the normalized summed gene expression (geTMM) is given on the y-axis. In A and B, smoothed curves were fit using a LOESS model, representing the local average metabolite abundance and metatranscriptome expression, respectively (n = 3), with individual replicates plotted as points, and the shaded area represents the 95% confidence interval.
Figure 4
Figure 4
Diverse microbial lineages involved in catechin and phenolic acid degradation. The microbial MAGs expressing genes encoding enzymes for catechin and phenolic acid degradation in the catechin-amended reactors. MAG genus is listed at top, and colored dots correspond to MAG phylum. Vertical lines delineate MAGs broadly involved in catechin degradation, dehydroxylation (dehydrox.), phloroglucinol degradation, and phenolic acid degradation. A dot denotes a MAG expressed the given gene. Only MAGs expressing genes for at least two enzymes are shown; for full data, see Supplementary Data 6. For pathways with multiple genes, at least 50% of genes needed to be expressed to be considered positive.
Figure 5
Figure 5
Methanogen metatranscriptome activity decreased in catechin-amended microcosms. (A) Normalized metatranscriptome expression of methanogen MAGs (rows) in each metatranscriptome sample (column). Dark squares correspond to the highest expression (normalized transcription =1) detected in a sample for each MAG, with subsequent samples colored accordingly. Methanogenic substrate potential is colored at right (Supplementary Data 7), and methanogen MAG response classification is given across the time series at far right for MAGs with detectable metatranscriptome expression. (B) Total methanogen MAG expression grouped by methanogenic pathway (Supplementary Data 7). (C) Concentrations of methanogenic substrates detected by NMR in μM. In BC, smoothed curves were fit using a LOESS model, representing the local average metatranscriptome expression and concentration, respectively (n = 3). Individual replicates are plotted as points and the shaded area represents the 95% confidence interval. Timepoints with significant differences between unamended and catechin-amended are marked with asterisks (Kruskal-Wallis test, *P value <0.10, **P value <0.05).
Figure 6
Figure 6
Increased hydrogen metabolism in catechin amended microcosms. (A) Gene expression of hydrogenases from non-methanogen MAGs grouped by their hydrogen use. Smoothed curves were fit using a LOESS model, representing the local average metatranscriptome expression (n = 3). Individual replicates are plotted as points and the shaded area represents the 95% confidence interval. Timepoints with significant differences between unamended and catechin-amended are marked with asterisks (ANOVA of log-adjusted geTMM values with Benjamini-Hochberg adjusted P values, *P value <0.10, **P value <0.05). (BD) Reconstruction of the hydrogen economy supporting catechin and phloroglucinol degradation in JAGFXR01. Catechin degradation via naringenin (B), eriodictyol (C), and dihydrokaempferol (D) is shown. Dashed arrows link reducing equivalents to recycling enzyme systems. Gene expression of these enzymes is shown in Supplementary Fig. 9.
Figure 7
Figure 7
Non-methanogen lineages across the carbon cycle were impacted by catechin amendment. (A) The number of MAGs classified as lost function or sensitive at days 21 and 35. Only genera with at least two MAG representatives, and greater than 50% active MAGs, were selected for display. (B) Metabolic roles curated from impacted genera gene expression. Phylum is denoted by colored boxes at left. (C) Schematic of carbon cycle in unamended peat microcosms. Cartoon microorganisms are labelled with functional group (bold names) and genus, where able, and colored by phylum.
Figure 8
Figure 8
Conceptual model of how catechin could rewire the microbial carbon cycle. Carbon cycle in unamended (left) and catechin-amended (right) peat microcosms. Pathway metatranscriptome expression was assessed with MaAsLin2 (q < 0.25), and pathways that were significantly associated with unamended or catechin metatranscriptomes are shown with solid arrows (Supplementary Data 3). Arrow thickness corresponds to the average fold enrichment of a pathway. A similar rewiring may also occur in the rumen, likely by different taxa, where hydrogen availability modulates methanogenesis.

Update of

Similar articles

Cited by

References

    1. Myhre G, Shindell D, Bréon F et al. Anthropogenic and natural radiative forcing. In: Stocker TF, Qin D, Plattner GK et al (eds.), Climate change 2013: The Physical Science Basis. Contribution of Working Group I to the Fifth Assessment Report of the Intergovernmental Panel on Climate Change. Cambridge: Cambridge University Press, 2013, 659–740.
    1. Nzotungicimpaye C-M, MacIsaac AJ, Zickfeld K. Delaying methane mitigation increases the risk of breaching the 2°C warming limit. Commun Earth Environ 2023;4:250. 10.1038/s43247-023-00898-z - DOI
    1. European Commission. Launch by United States, the European Union, and Partners of the Global Methane Pledge to Keep 1.5C Within Reach. https://ec.europa.eu/commission/presscorner/detail/en/STATEMENT_21_5766 (22 October 2024, date last accessed).
    1. Saunois M, Stavert AR, Poulter B et al. The global methane budget 2000–2017. Earth Syst Sci Data 2020;12:1561–623. 10.5194/essd-12-1561-2020 - DOI
    1. Tian H, Lu C, Ciais P et al. The terrestrial biosphere as a net source of greenhouse gases to the atmosphere. Nature 2016;531:225–8. 10.1038/nature16946 - DOI - PubMed

LinkOut - more resources