

Prediction Model and Nomogram for Amyloid Positivity Using Clinical and MRI Features in Individuals With Subjective Cognitive Decline
- PMID: 40439500
- PMCID: PMC12121204
- DOI: 10.1002/hbm.70238
Prediction Model and Nomogram for Amyloid Positivity Using Clinical and MRI Features in Individuals With Subjective Cognitive Decline
Abstract
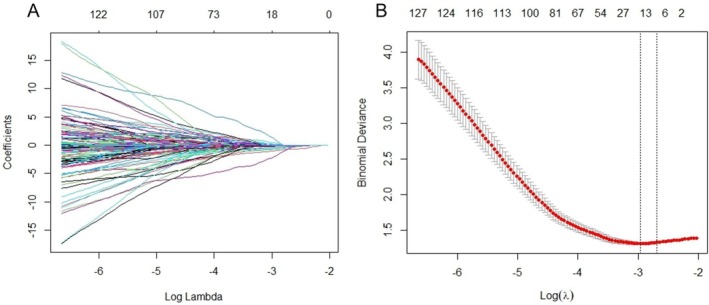
There is an urgent need for the precise prediction of cerebral amyloidosis using noninvasive and accessible indicators to facilitate the early diagnosis of individuals with the preclinical stage of Alzheimer's disease (AD). Two hundred and four individuals with subjective cognitive decline (SCD) were enrolled in this study. All subjects completed neuropsychological assessments and underwent 18F-florbetapir PET, structural MRI, and functional MRI. A total of 315 features were extracted from the MRI, demographics, and neuropsychological scales and selected using the least absolute shrinkage and selection operator (LASSO). The logistic regression (LR) model, based on machine learning, was trained to classify SCD as either β-amyloid (Aβ) positive or negative. A nomogram was established using a multivariate LR model to predict the risk of Aβ+. The performance of the prediction model and nomogram was assessed with area under the curve (AUC) and calibration. The final model was based on the right rostral anterior cingulate thickness, the grey matter volume of the right inferior temporal, the ReHo of the left posterior cingulate gyrus and right superior temporal gyrus, as well as MoCA-B and AVLT-R. In the training set, the model achieved a good AUC of 0.78 for predicting Aβ+, with an accuracy of 0.72. The validation of the model also yielded a favorable discriminatory ability with an AUC of 0.88 and an accuracy of 0.83. We have established and validated a model based on cognitive, sMRI, and fMRI data that exhibits adequate discrimination. This model has the potential to predict amyloid status in the SCD group and provide a noninvasive, cost-effective way that might facilitate early screening, clinical diagnosis, and drug clinical trials.
Keywords: Alzheimer's disease; logistic regression; machine learning; nomogram; subjective cognitive decline.
© 2025 The Author(s). Human Brain Mapping published by Wiley Periodicals LLC.
Conflict of interest statement
The authors declare no conflicts of interest.
Figures


Similar articles
-
Comparison of imaging biomarkers for Alzheimer's disease: amyloid imaging with [18F]florbetapir positron emission tomography and magnetic resonance imaging voxel-based analysis for entorhinal cortex atrophy.Int J Geriatr Psychiatry. 2015 May;30(5):505-13. doi: 10.1002/gps.4173. Epub 2014 Jul 7. Int J Geriatr Psychiatry. 2015. PMID: 25043833
-
Correlations between plasma and PET beta-amyloid levels in individuals with subjective cognitive decline: the Fundació ACE Healthy Brain Initiative (FACEHBI).Alzheimers Res Ther. 2018 Nov 29;10(1):119. doi: 10.1186/s13195-018-0444-1. Alzheimers Res Ther. 2018. PMID: 30497535 Free PMC article.
-
Association of short-term cognitive decline and MCI-to-AD dementia conversion with CSF, MRI, amyloid- and 18F-FDG-PET imaging.Neuroimage Clin. 2019;22:101771. doi: 10.1016/j.nicl.2019.101771. Epub 2019 Mar 13. Neuroimage Clin. 2019. PMID: 30927601 Free PMC article.
-
Predicting progression from subjective cognitive decline to mild cognitive impairment or dementia based on brain atrophy patterns.Alzheimers Res Ther. 2024 Jul 5;16(1):153. doi: 10.1186/s13195-024-01517-5. Alzheimers Res Ther. 2024. PMID: 38970077 Free PMC article.
-
Relationships between flortaucipir PET tau binding and amyloid burden, clinical diagnosis, age and cognition.Brain. 2017 Mar 1;140(3):748-763. doi: 10.1093/brain/aww334. Brain. 2017. PMID: 28077397 Free PMC article.
References
-
- Andersson, J. L. R. , Skare S., and Ashburner J.. 2003. “How to Correct Susceptibility Distortions in Spin‐Echo Echo‐Planar Images: Application to Diffusion Tensor Imaging.” NeuroImage 20, no. 2: 870–888. - PubMed
-
- Chen, K. , Xu Y., Chu A., et al. 2016. “Validation of the Chinese Version of Montreal Cognitive Assessment Basic for Screening Mild Cognitive Impairment.” Journal of the American Geriatrics Society 64, no. 12: 14530. - PubMed
-
- Cheng, G. , Liu D., Huang L., et al. 2023. “Prevalence and Risk Factors for Subjective Cognitive Decline and the Correlation With Objective Cognition Among Community‐Dwelling Older Adults in China: Results From the Hubei Memory and Aging Cohort Study.” Alzheimer's & Dementia 19, no. 11: 5074–5085. - PubMed
-
- Clark, C. M. , Pontecorvo M. J., Beach T. G., et al. 2012. “Cerebral PET With Florbetapir Compared With Neuropathology at Autopsy for Detection of Neuritic Amyloid‐β Plaques: A Prospective Cohort Study.” Lancet Neurology 11, no. 8: 669–678. - PubMed
MeSH terms
Substances
LinkOut - more resources
Full Text Sources
Medical
