. 2025 May 28;45(5):343-360.
doi: 10.1042/BSR20241235.

Single-cell RNAseq of Angiotensin II-induced abdominal aortic tissue identifies aneurysm-associated cell clusters in C57BL/6J mice

Affiliations

Single-cell RNAseq of Angiotensin II-induced abdominal aortic tissue identifies aneurysm-associated cell clusters in C57BL/6J mice

Huimin Li et al. Biosci Rep. .

Abstract

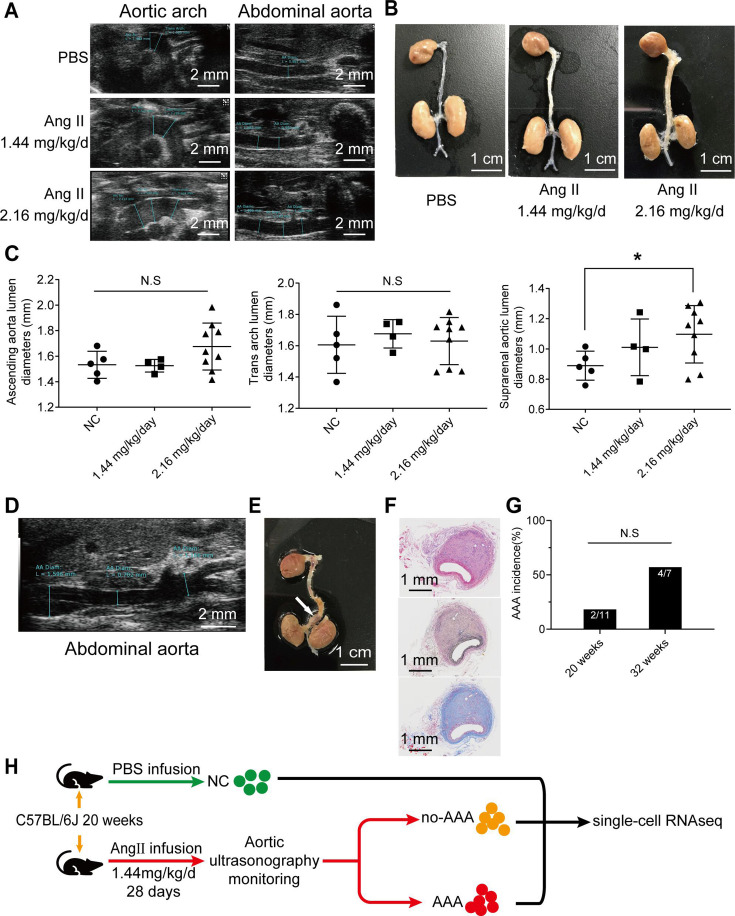
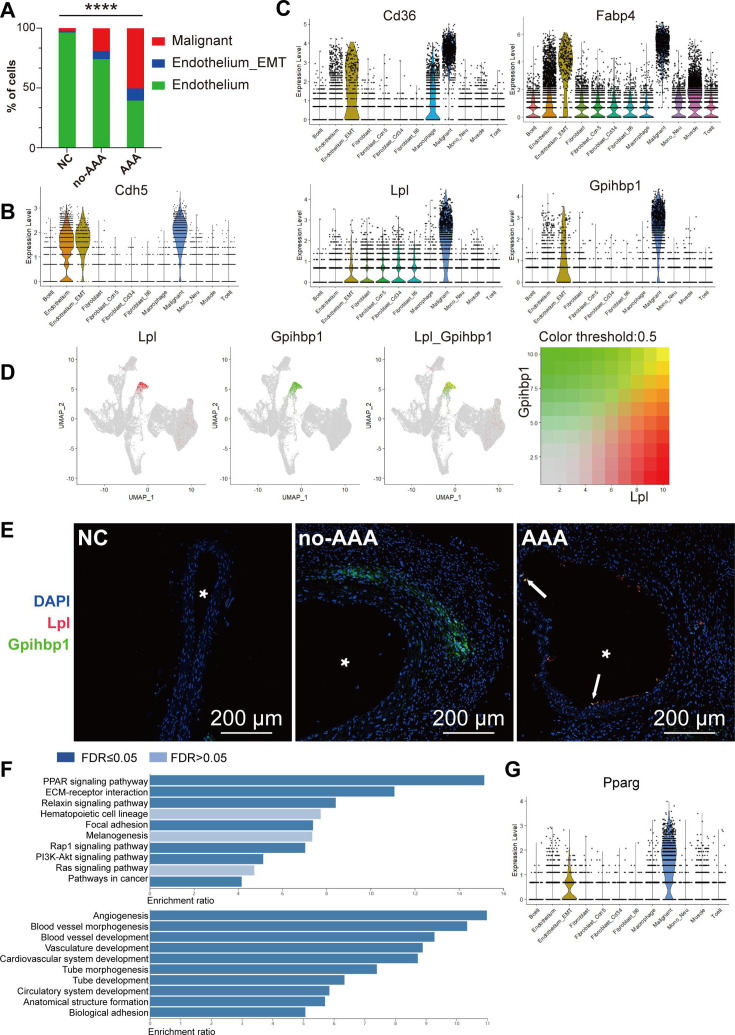
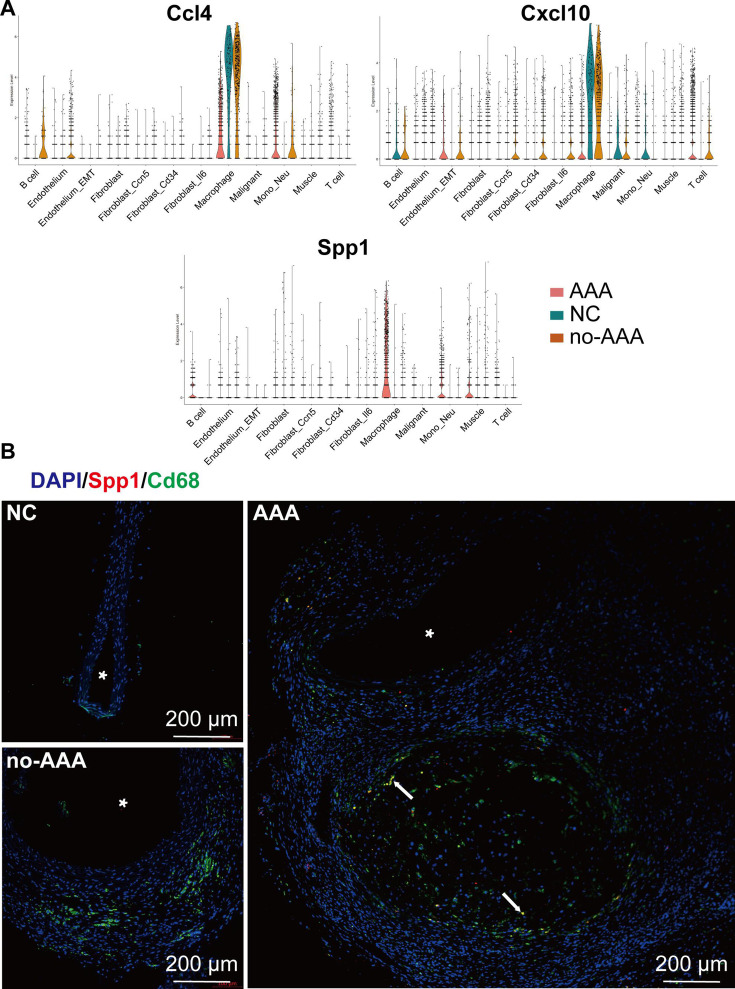
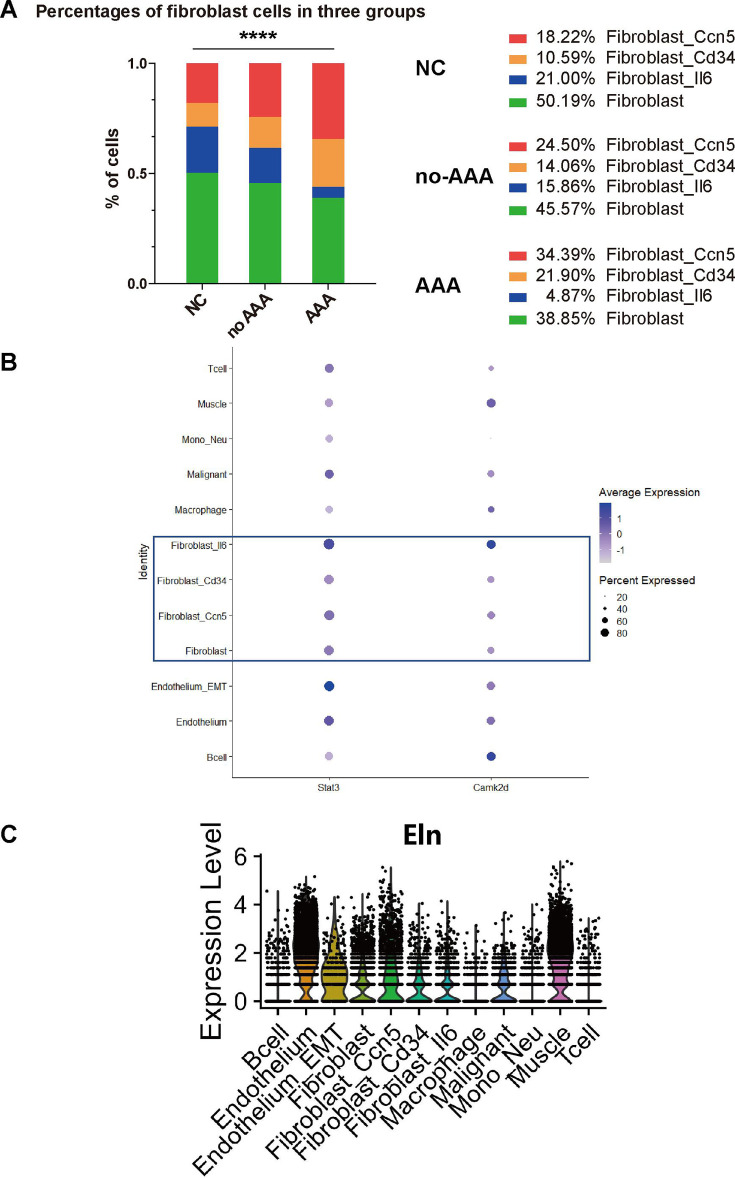
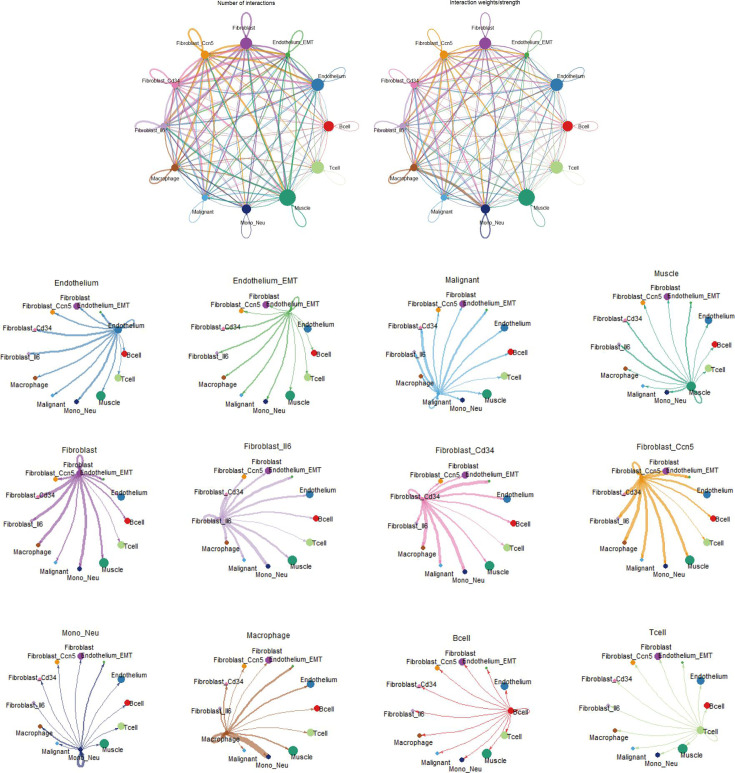
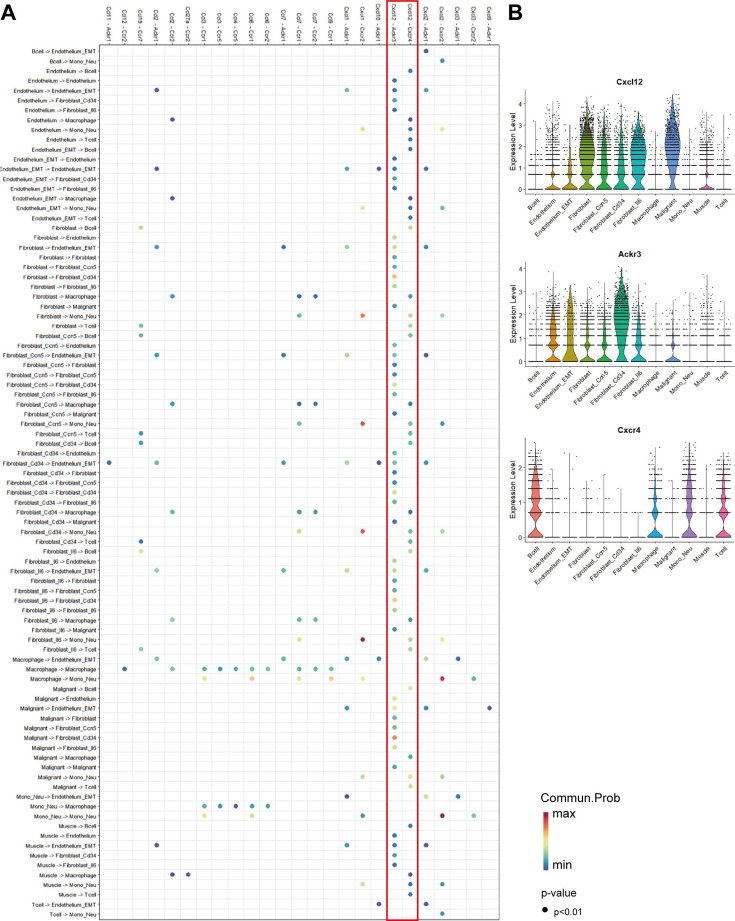
Abdominal aortic aneurysms (AAAs) are life-threatening due to the rupture of aorta. Different vascular cell types are known to be involved in AAA development. However, whether any specific cell cluster plays a critical role during AAA formation is unknown. Angiotensin II (Ang II) infused mouse AAA models are commonly used to study the development and progression of AAA. We here investigate the incidence of AAA at different ages or different doses of Ang II in C57BL/6J mice. There was no AAA formation at a concentration of 1.44 mg/kg/day or 2.16 mg/kg/day at the age of 14 weeks. At the age of 20 weeks and 32 weeks, the incidence of AAA was 18.2% (6/21) and 57.1% (4/7), respectively, with a concentration of 1.44 mg/kg/day. Using single-cell RNA sequencing, we found that increased clusters of monocytes and neutrophils, macrophages, T cells, and B cells were the typical changes in AAA. A special cluster transformed from endothelial cells (malignant ECs) was identified, in which genesinvolved in lipid metabolism, including Cd36, Lpl, Gpihbp1, Fabp4, and Pparg, were highly expressed. Mice receiving Ang II treatment without AAA development showed increased fibroblasts, which may prevent the occurrence of AAA. Through cell-cell interaction analysis, we found that the Cxcl12-Cxcr4/Ackr3 axis, which functions in inflammatory ligand- receptor binding, may play a role in AAA formation. Our results reveal that specific cell clusters may contribute to the progression or prevention of AAA formation. These findings provide new clues for the pathogenesis and intervention of AAA.

Keywords: Angiotensin II; abdominal aortic aneurysm; cell type; disease mechanism; single-cell RNA sequencing.


Conflict of interest statement

The authors declare that there are no competing interests associated with the manuscript.

Figures

Figure 1
Figure 1. Age and dose effects in Ang II-induced AAA in mice.
(A) Representative ultrasound images from C57BL/6 J mice treated with either PBS or Ang II (1.44 mg/kg/day or 2.16 mg/kg/day) at the age of 14 weeks. Scale bars: 2 mm. (B) Representative images of the mouse aorta at 14 weeks of age. C57BL/6 J mice were infused with Ang II (1.44 mg/kg/day or 2.16 mg/kg/day for 28 days). Negative control (NC) mice were C57BL/6 J mice of the same age and gender as the experimental group, infused with PBS for the same duration. Scale bars: 1 cm. (C) There were no significant differences in the lumen diameter of the ascending aorta, aortic arch, and abdominal aorta when comparing Ang II-treated mice (1.44 mg/kg/day, n = 4; 2.16 mg/kg/day, n = 9) with the PBS- treated mice (NC, n = 5) at the age of 14 weeks (ANOVA, i>P = 0.1427, 0.7838, and 0.1222). However, the diameters of the suprarenal abdominal aorta were slightly increased in Ang II (2.16 mg/kg/day) infused mice compared with the NC group. *P = 0.0429. The means ± SEM of the lumen diameter can be found in Table 1. N.S. not significant. (D) A representative ultrasound image of AAA from Ang II-treated mice (1.44 mg/kg/day) for 28 days at the age of 20 weeks. Scale bar: 2 mm. The diameter of the dilated suprarenal aorta was 1.596 mm, while the non-dilated adjacent measured 0.70 mm. The ratio of dilated to non-dilated aorta was 2.27, which exceeds the diagnostic criteria of 1.5 for AAA. (E) A representative image of AAA from mice treated with Ang II (1.44 mg/kg/day) for 28 days at the age of 20 weeks, as indicated by white arrow. Scale bar: 1 cm. (F) Representative images of AAA sections stained with hematoxylin and eosin (H&E, top), elastic staining (middle), and Masson’s trichrome (bottom). Scale bars: 1 mm. (G) AAA was detected in 2 out of 11 mice at the age of 20 weeks and in 4 out of 7 mice at the age of 32 weeks. N.S. not significant. (H) A schematic diagram of the experimental design for single-cell RNAseq. AAA, abdominal aortic aneurysm; Ang II, angiotensin II.
Figure 2
Figure 2. Cell types classified through single-cell RNA sequencing (scRNAseq) of mouse aortas.
(A) After quality control, 8,716, 8,443, and 12,276 cells from the normal control (NC), without AAA formation (no-AAA), and with AAA formation (AAA) groups were selected for clustering analysis, respectively. Uniform manifold approximation and projection (UMAP) plot of aggregating cells from the NC, no-AAA, and AAA groups. (B) UMAP plot of cell clusters, illustrating the partition of 26 distinct clusters (upper panel) and cell identities (lower panel). The clusters listed in brackets are assigned to different cell types: endothelium (2, 9, 19, 24), endothelium_EMT (23), malignant (16), muscle (5, 10, 13, 18, 20), fibroblast (0, 7), fibroblast_Ccn5 (1), fibroblast_Cd34 (12), fibroblast_Il6 (11), monocyte_neutrophil (mono_neu; 3, 22), macrophage (6), B cell (8, 17, 21), T cell (4, 14, 15, 25). (C) Heat map displaying the top five genes with specific expression for each cell cluster, illustrating the relative expression levels in each cluster. The top five cluster-specific markers for each cluster were selected from all markers of each cluster based on the average log-fold change. Rows represent genes, and columns represent clusters. The width of each cluster represents its proportion in all cells of the three groups. A complete list of marker genes for each cluster can be found in Table 2. (D) The expression of marker genes for cell identification is displayed on the UMAP plot (gene expression log-normalized by Seurat). Cdh5 is the marker of endothelium cells, Tagln is the marker of smooth muscle cells, Dcn is the marker of fibroblasts, Ptprc is the marker of immune cells. (E) The proportions of each identified cell type in the NC, no-AAA, and AAA groups are shown in the stacked column chart. The differences of each cell type among the three groups are statistically significant, ****P<0.0001 by Chi-square test. In Figures 2–7, the cluster of muscle represents smooth muscle cells, mono_neu represents monocytes and neutrophils.
Figure 3
Figure 3. Comparison of endothelial cell subpopulations in the abdominal aorta among the NC, no-AAA, and AAA groups.
(A) Stacked column chart shows the proportion of endothelial cell subtypes in the NC, no-AAA, and AAA groups. The proportion of endothelial cell subtypes among the three groups was statistically significant, ****P<0.0001 by Chi-square test. In the NC group, the proportions of malignant, endothelium_EMT, and endothelium were 2.2%, 1.4%, and 96.4%, respectively. In the no-AAA group, the proportions of malignant, endothelium_EMT, and endothelium were 19.0%, 6.9%, and 74.1%, respectively. In the AAA group, the proportions of malignant, endothelium_EMT, and endothelium were 50.4%, 10.2%, and 39.4%, respectively. (B) The expression of Cdh5 in 12 clusters of cells from NC, no-AAA, and AAA groups is visualized by feature plots, where three subtypes of epithelial cells can be differentiated. (C) The expression of selected marker genes Cd36, Fabp4, Lpl, Gpihbp1 for the malignant cluster from the NC, no-AAA, and AAA groups is visualized through feature plots. (D) A dual-plot gene expression heatmap shows the highest co-expression of Lpl and Gpihbp1 in the malignant cluster. (E) Representative immunofluorescence images of aorta sections stained with anti-Lpl (red) and anti-Gpihbp1 (green). White arrows indicate the co-expression of Lpl and Gpihbp1. Scale bars, 200 μm. The asterisk symbols indicate the location within the lumen of the abdominal aorta. (F) Bar chart of enrichment ratios for Kyoto Encyclopedia of Genes and Genomes (KEGG, upper panel) and Gene Ontology (GO, lower panel) pathways in the malignant cluster of 1601 diferentially expressed genes (including 1168 up-regulated genes and 433 down-regulated genes). False discovery rate (FDR) ≤0.05 indicates significantly enriched pathways, as indicated by the dark blue color. Enrichment ratio = the number of observed genes/ the number of expected genes from each GO or KEGG category in the gene list. (G) The expression of Pparg in the 12 clusters from the NC, no-AAA and AAA groups is visualized by feature plots. Note that Pparg is highly expressed in malignant. AAA, abdominal aortic aneurysm; EMT, epithelial-mesenchymal transition; NC, negative control.
Figure 4
Figure 4. Comparison of macrophages in the abdominal aorta among the NC, no-AAA, and AAA group.
(A) The expression of selected marker genes Ccl4, Cxcl10, Spp1 for the macrophage cluster from NC, no-AAA, and AAA groups is visualized through feature plots. (B) Representative immunofluorescence images of aorta sections stained with anti-Spp1 (red) and anti-Cd68 (green). White arrows indicate the co-expression of Spp1 and Cd68. Scale bar, 200 μm. The asterisk symbols indicate the location within the lumen of the abdominal aorta. AAA, abdominal aortic aneurysm; NC, negative control.
Figure 5
Figure 5. Comparison of fibroblast subpopulations in the abdominal aorta among the NC, no-AAA, and AAA group.
(A) Stacked column chart depicting the proportion of fibroblast subtypes in NC, no-AAA, and AAA groups. The proportions of fibroblast subtypes in the three groups listed are statistically significant, ****P<0.0001 by Chi-square test. (B) The expression of Camk2d and Stat3 was up-regulated in the cluster of fibroblast_Il6. The color key from gray-violet to blue indicates low to high expression levels. The dot size indicates the percentage of cells expressing the two indicated genes. (C) The expression of elastin (Eln) in different cell clusters. AAA, abdominal aortic aneurysm; NC, negative control.
Figure 6
Figure 6. Visualization and analysis of cell–cell communication through circle plots.
The number and strength of interactions between pairs of 12 cell clusters are shown. The sizes of the circles are proportional to the number of cells in each cluster; the larger the circle, the greater the number of cells. The width of the edges represents the communication probability; the thicker the line, the more likelihood of communication.
Figure 7
Figure 7. Dot plot illustrating selected ligand–receptor interactions in various cell subsets.
(A) Ligand and receptor pairs are displayed on the x-axis, while the cell subsets are presented on the y-axis. The color of the dot indicates the signaling probability scores of the receptor–ligand pairs showing a significant interaction among these communicating cell subsets. The P values were generated by CellphoneDB, which utilizes a one-sided permutation test to calculate significant interactions. The dots displayed represent interactions with a P value <0.01. The communication probability (Commun.Prob) is displayed in the color key. (B) The expression distribution of signaling genes Cxcl12, Ackr3, and Cxcr4, which are involved in the inferred signaling network from the NC, no-AAA, and AAA groups, is visualized through feature plots.

Similar articles

References

    1. Umebayashi R., Uchida H.A., Wada J. Abdominal aortic aneurysm in aged population. Aging (Milano) 2018;10:3650–3651. doi: 10.18632/aging.101702. - DOI - PMC - PubMed
    1. Sakalihasan N., Michel J.-B., Katsargyris A., Kuivaniemi H., Defraigne J.-O., Nchimi A., et al. Abdominal aortic aneurysms. Nat. Rev. Dis. Primers. 2018;4:34. doi: 10.1038/s41572-018-0030-7. - DOI - PubMed
    1. Kochanek K.D., Murphy S.L., Xu J., Arias E. Deaths: final data for 2017. Natl. Vital Stat. Rep. 2019;68:1–77. - PubMed
    1. Ortega R., Collado A., Selles F., Gonzalez-Navarro H., Sanz M.J., Real J.T., et al. SGLT-2 (Sodium-glucose cotransporter 2) inhibition reduces Ang II (Angiotensin II)-induced dissecting abdominal aortic aneurysm in ApoE (Apolipoprotein E) knockout mice. Arterioscler. Thromb. Vasc. Biol. 2019;39:1614–1628. doi: 10.1161/ATVBAHA.119.312659. - DOI - PubMed
    1. Satoh K., Nigro P., Matoba T., O’Dell M.R., Cui Z., Shi X., et al. Cyclophilin a enhances vascular oxidative stress and the development of angiotensin II-induced aortic aneurysms. Nat. Med. 2009;15:649–656. doi: 10.1038/nm.1958. - DOI - PMC - PubMed

Publication types

MeSH terms