. 2025 Jul 9;5(7):100889.
doi: 10.1016/j.xgen.2025.100889. Epub 2025 May 28.

Unraveling an enhancer-silencer regulatory element showing epistatic interaction with a variant that escaped genome-wide association studies

Affiliations

Unraveling an enhancer-silencer regulatory element showing epistatic interaction with a variant that escaped genome-wide association studies

Mathieu Adjemout et al. Cell Genom. .

Abstract

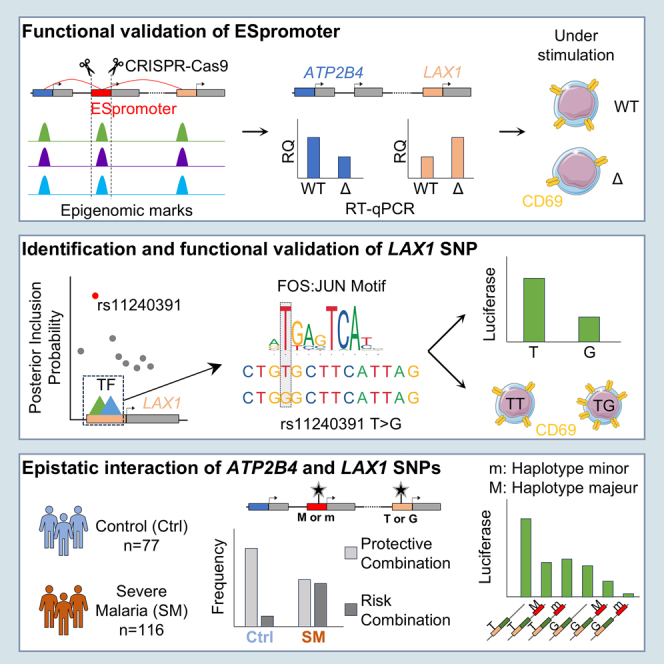
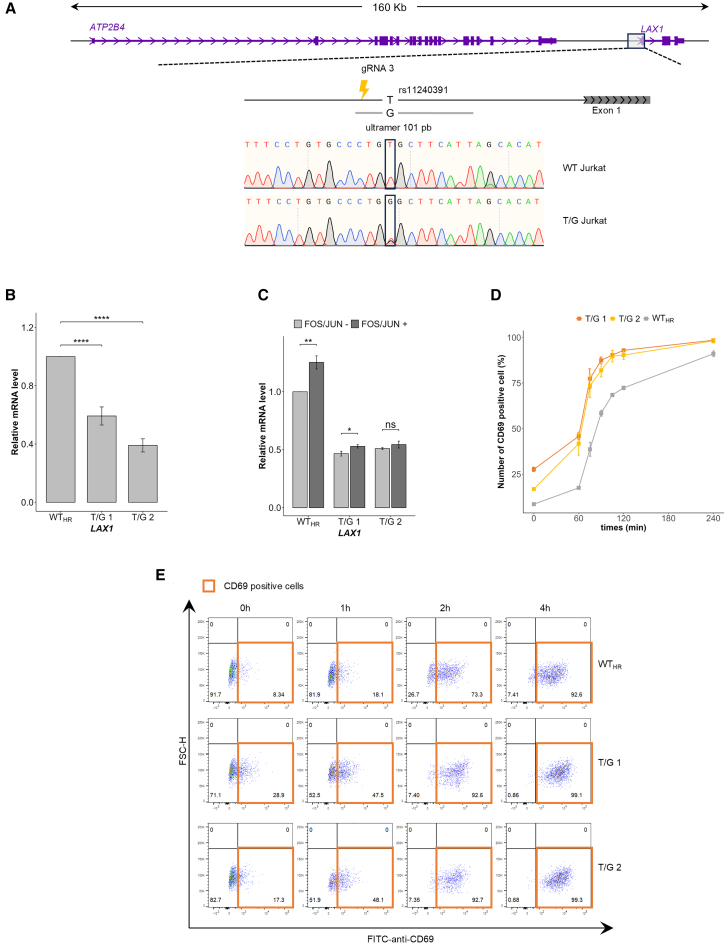
Regulation of gene expression has recently been complicated by identifying Epromoters, a subset of promoters with enhancer function. Here, we uncovered a dual cis-regulatory element, "ESpromoter," exhibiting both enhancer and silencer function as a regulator of the nearby genes ATP2B4 and LAX1 in single human T cells. Through an integrative approach, we pinpointed functional rs11240391, a severe malaria-risk variant that escapes detection in genome-wide association studies, challenging conventional strategies for identifying causal variants. CRISPR-modified cells demonstrated the regulatory effect of ESpromoter and rs11240391 on LAX1 expression and T cell activation. Furthermore, our findings revealed an epistatic interaction between ESpromoter SNPs and rs11240391, impacting severe malaria susceptibility by further reducing LAX1 expression. This groundbreaking discovery challenges the conventional enhancer-silencer dichotomy. It highlights the sophistication of transcriptional regulation and argues for an integrated approach combining genetics, epigenetics, and genomics to identify new therapeutic targets for complex diseases.

Keywords: T cell activation; cis-regulatory elements; dual function; enhancer-silencer; epistatic interaction; functional variants; severe malaria; transcriptional regulation.


Conflict of interest statement

Declaration of interests The authors declare no competing interests.

Figures

None
Graphical abstract
Figure 1
Figure 1
Epromoter in the ATP2B4 locus, a potential cis-regulatory element of LAX1 (A) Circos plots illustrating predictive chromatin interactions of GeneHancer regulatory elements with the ATP2B4 Epromoter (yellow line). Predictions indicate potential interactions with multiple target promoters, including ATP2B4, LAX1, ZC3H11A, PRELP, and OPTC. These interactions were computationally inferred based on regulatory-element annotations. (B) Circos plots displaying significant chromatin interactions with the ATP2B4 Epromoter (yellow line) in primary T CD4+ cells as measured by promoter capture Hi-C (PCHiC) data. Experimentally validated interactions confirm strong contacts with ATP2B4 and LAX1 promoters in this specific cell type. (C) Chromatin interaction maps reveal ATP2B4 Epromoter interactions across multiple cell types. Hi-C interaction matrices from HiChiP data are shown for different T cell subtypes (naive T primary, Th17, and Treg cells) as well as non-T cell lines (GM12878 and K562). Strong interactions, indicated by darker shades of red, highlight the ATP2B4 Epromoter’s contact with the ATP2B4 and LAX1 promoters across all tested CD4+ T cell lines. Black lines correspond to the five SNPs previously identified (rs11240734, rs1541252, rs1541253, rs1541254, and rs1541255). The interaction between the ATP2B4 Epromoter and the LAX1 promoter is consistently observed in all CD4+ T cell lines (naive T, Th17, and Treg), further confirming its presence in T cells. However, this interaction appears less prominent or absent in non-T cell lines. (D) WashU epigenome browser view of ATAC-seq for immune cells. The frame corresponds to the Epromoter. Black lines correspond to the five SNPs previously identified (rs11240734, rs1541252, rs1541253, rs1541254, and rs1541255). The regions corresponding to the Epromoter and the LAX1 promoter are particularly open in CD4+ T cells. (E) WashU epigenome browser view of epigenomic data in naive CD4+ primary cells. The frame corresponds to the Epromoter. Black lines correspond to the five SNPs previously identified (rs11240734, rs1541252, rs1541253, rs1541254, and rs1541255). The presence of prominent peaks for active histone marks suggests a regulatory role for the ATP2B4 Epromoter and LAX1 promoter in CD4+ T cells.
Figure 2
Figure 2
Identification of a cis-regulatory element with a dual enhancer-silencer function (ESpromoter) and its role in inhibiting Jurkat T cell activation (A) Generation of cell lines with a 506-bp deletion of the ESpromoter using two single guide RNAs (gRNA1 and gRNA2) flanking the regulatory region containing the five SNPs, through CRISPR-Cas9 technology. The position of the deletion is indicated relative to the long ATP2B4 (ENST00000367218 and ENST00000367218) and short (ENST00000341360) transcripts of ATP2B4 and the LAX1 gene. Sanger sequencing chromatograms show the genomic sequence of the wild-type (WT) Jurkat clone, and one representative edited clone (Δ Jurkat). (B) RT-qPCR analysis of ATP2B4 long transcript expression (ENST00000357681, ENST00000367218) on WT Jurkat cells and clones deleted for the ESpromoter (Δ1, Δ2, and Δ3) in culture without stimulation (NS, no stimulation [in gray]) or with PMA/ionomycin stimulation for 6 h (S, stimulated [in red]). Clones with a deletion had a decreased ATP2B4 expression under both conditions. Values were generated from three independent experiments performed in triplicate. WT Jurkat NS and S are used as references. All data represent mean values ±SEM. Two-sided Student’s t tests and asterisks indicate significance (∗∗p < 0.01, ∗∗∗p < 0.001, ∗∗∗∗p < 0.0001). (C) RT-qPCR analysis of LAX1 expression on WT Jurkat cells and on clones deleted for the ESpromoter (Δ1, Δ2, and Δ3) without stimulation (NS, no stimulation [in gray]) or with PMA/ionomycin stimulation for 6 h (S, stimulated [in red]). Clones with a deletion had increased LAX1 expression under both conditions. Values were generated from three independent experiments performed in triplicate. WT Jurkat NS and S are used as references. All data represent mean values ±SEM. Two-sided Student’s t tests and asterisks indicate significance (∗∗p < 0.01, ∗∗∗p < 0.001, ∗∗∗∗p < 0.0001). (D) Graphs showing the relative luciferase activity under the control of ATP2B4 promoter alone or in combination with the ESpromoter region containing either the major haplotype (maj: TCCGA) or minor haplotype (min: CTTGG) for the five SNPs (rs11240734, rs1541252, rs1541253, rs1541254, and rs1541255) without and with PMA/ionomycin stimulation. Luciferase assays confirmed the enhancer effect of the ESpromoter on the ATP2B4 promoter independently of the haplotype. Values were generated from three independent experiments performed in triplicate. All data represent normalized mean values ±SEM. Two-sided Student’s t tests and asterisks indicate significance (ns, not significant; ∗p < 0.05, ∗∗p < 0.01, ∗∗∗p < 0.001, ∗∗∗∗p < 0.0001). (E) Graphs showing the relative luciferase activity under the control of LAX1 promoter alone or in combination with the ESpromoter region containing either the major haplotype (maj) or minor haplotype (min) for the five SNPs (rs11240734, rs1541252, rs1541253, rs1541254, and rs1541255) under PMA/ionomycin stimulation (6 and 24 h). Luciferase assays confirmed the silencer effect of the ESpromoter on the LAX1 promoter independently of the haplotype. Values were generated from three independent experiments performed in triplicate. All data represent normalized mean values ±SEM. Two-sided Student’s t tests and asterisks indicate significance (ns, not significant; ∗∗∗∗p < 0.0001). (F) T cell activation was assessed based on CD69 staining and flow cytometric gating strategy. Plots showing the results at different time points after PMA/Ionomycin stimulation of WT Jurkat cells, WT clone after CRISPR-Cas9 editing (WTc), and deleted clone for the ESpromoter (Δ3). Representative experiments on 2,000 cells according to forward scatter-horizontal (FSC-H) and anti-CD69 staining with fluorescein isothiocyanate (FITC). The number represents the percentage of cells. The orange window corresponds to CD69-positive cells. The rate of CD69-positive cells increased with stimulation time. (G) Monitoring Jurkat cell activation by anti-CD69 staining through flow cytometry after PMA/ionomycin stimulation. Values represent the average ± SEM of two independent experiments performed in duplicate, indicating the percentage of cells positive for anti-CD69 staining (acquisition of 2,000 cells per clone) for WT Jurkat, and WT clone without genomic edition after CRISPR-Cas9 (WTc). A similar percentage of CD69-positive cells was observed between WT and WTc. (H) Monitoring Jurkat cell activation by anti-CD69 staining through flow cytometry after PMA/ionomycin stimulation. Values represent the average ±SEM of two independent experiments performed in duplicate, indicating the percentage of cells positive for anti-CD69 staining (acquisition of 2,000 cells per clone) for WT clone without genomic edition after CRISPR-Cas9 (WTc) and deleted clones for the ESpromoter (Δ3). A lower number of CD69-positive cells was observed in the Δ3 clone.
Figure 3
Figure 3
ESpromoter is essential for normal human primary T cell activation (A–C) Phenotypic analysis of naive CD4+ T cells, either deleted or not for ESpromoter, following 24 h activation with CD3/CD28/CD2 complexes, including a 4-h restimulation step with PMA/ionomycin/BFA; see also Figure S3. (A) Relative expression of LAX1 (left) and ATP2B4 (right) assessed by RT-qPCR in one donor. Deletion of the ESpromoter leads to an increase in LAX1 expression and a decrease in ATP2B4 expression. (B) Surface expression of CD25 and CD69 in primary control T cells and in cells deleted for the ESpromoter. Data are representative of two independent experiments. The number of CD25+CD69+ double-positive cells is shown as a percentage. (C) Quantification of CD25+CD69+ double-positive cells (left) and IL-2-producing cells (right). Data are from two independent experiments. A strong decrease in CD25+ CD69+ cells and a decrease in the percentage of IL-2-producing cells were observed after the deletion of the ESpromoter.
Figure 4
Figure 4
Identification of the functional variant rs11240391 corresponding to the FOS and JUN binding site (A) WashU epigenome browser view of LAX1 region with the position of all eQTLs for LAX1 in the ELIXIR database, those having a PIP score >0.7 are shown in red. Localization of ENCODE cCREs was shown with promoter-like elements in red and enhancer-like elements in orange. The density of ChIP-seq peaks available in ReMap2022 is also displayed. These results revealed a potentially functional SNP in the LAX1 promoter (rs11240391). (B) Luciferase assays to assess the impact of the rs11240391 variant on LAX1 promoter activity without stimulation (NS, no stimulation [in gray]) or with PMA/ionomycin stimulation for 6 h (S, stimulation [in black]). Values were generated from three independent experiments performed in triplicate. Relative luciferase activity was lower with the G allele than with the T allele. The graph shows the mean values ±SEM. p values were calculated using a two-sided Student’s t test, and asterisks indicate significance (∗∗p < 0.01, ∗∗∗p < 0.001, ∗∗∗∗p < 0.0001). (C) Prediction of transcription factor (TF) binding-site disruption at rs11240391 using RSAT. The genomic sequence containing the variant is displayed. The p-value ratio was calculated by dividing the best and worst probability of TF binding. All TFs exhibit a higher binding affinity to the T allele of SNP rs11240391. The FOS::JUN motif is the most affected by the allele change. (D) ChIP-seq peaks from ReMap2022 confirmed the binding of TFs, identified by RSAT, in the region containing rs11240391. (E) Luciferase assays to evaluate the impact of rs11240391 on the fixation of TFs by adding expression plasmid of JUN or FOS or both. The major allele T was represented in gray, and the minor allele G was represented in black. A higher relative luciferase activity was observed in the presence of the T allele, which only increased with the simultaneous addition of JUN and FOS. Values were generated in triplicate from three independent experiments. The plot shows the mean values ±SEM. p values were calculated using a two-sided Student’s t test, and asterisks indicate significance (∗∗∗∗p < 0.0001). (F) EMSA for SNP rs11240391. Nuclear extracts (NE:10 μg) from Jurkat cells stimulated for 2 h with PMA/ionomycin were incubated with biotinylated doubled-stranded oligonucleotides containing either the major T allele (rs11240391 - T) or the alternative G allele (rs11240391 - G). Two different competitions were performed either with an excess of non-biotinylated duplex identical to the biotinylated duplex or with an excess of the non-biotinylated duplex containing a specific AP-1 site. Complexes were separated on 6% nondenaturing polyacrylamide gels. Positions of specific (filled arrow) and non-specific (open arrow) AP-1 retardation are indicated. The intensity of the specific AP-1 complex band decreased in the presence of the biotinylated duplex containing the G allele.
Figure 5
Figure 5
Lower LAX1 expression in heterozygous T/G Jurkat clones is associated with higher T cell activation (A) Generation of cell lines with a modified rs11240391 variant allele by HR using a 101-bp ultramer, a single guide RNA (gRNA3), and CRISPR-Cas9 technology. Sanger sequencing chromatograms show the genomic sequence of the wild-type (WT) Jurkat clone and of the clone in which a T allele has been replaced by a G allele (T/G Jurkat). (B) RT-qPCR analysis of LAX1 gene expression on WT clone after HR experiment (WTHR) and two heterozygous clones (T/G 1 and T/G 2) for the rs11240391 SNP. Values were generated in triplicate from three independent experiments. The plot shows the mean values ±SEM. p values were calculated using a two-sided Student’s t test, and asterisks indicate significance (∗∗∗∗p < 0.0001). (C) RT-qPCR analysis of LAX1 gene expression in WT Jurkat cells (WTHR) and T/G clone heterozygotes (T/G 1 and T/G 2) for the SNPs rs11240391, untransfected (gray) or transfected (black) with both expression plasmids for FOS and JUN. Values were generated in triplicate from three independent experiments. The plot shows the mean values ±SEM. p values were calculated using a two-sided Student’s t test, and asterisks indicate significance (ns, not significant; ∗p < 0.05, ∗∗p < 0.01). (D) Monitoring of Jurkat cell activation by anti-CD69 staining through flow cytometry after PMA/ionomycin stimulation. The values represent the average ± SEM of two independent experiments performed in duplicate, indicating the percentage of cells positive for anti-CD69 staining (acquisition of 2,000 cells per clone). The comparison was carried out between a WT clone after an HR experiment (WTHR) and two heterozygous clones (T/G 1 and T/G 2) for the rs11240391 SNP. The percentage of CD69+ cells was higher in heterozygous clones than in WTHR. (E) T cell activation in Jurkat clones was assessed based on CD69 staining and flow cytometric gating strategy. Plots showing the results at different time points after PMA/Ionomycin stimulation of WT clone after CRISPR-Cas9 editing (WTHR) and heterozygous clones (T/G 1 and T/G 2) for the rs11240391 SNP. Representative experiments were conducted on 2,000 cells of each type based on forward scatter-horizontal (FSC-H) and anti-CD69 staining using fluorescein isothiocyanate (FITC). The number represents the percentage of cells. The orange window corresponds to CD69-positive cells. A higher percentage of CD69-positive cells was observed for T/G 1 and T/G 2 clones.
Figure 6
Figure 6
Epistatic interaction between ATP2B4 and LAX1 genetic variants associated with differential risk of SM through regulation of LAX1 expression (A) Design for Senegalese cohort recruitment, DNA amplification, and genotyping of rs11240391 using TaqMan assays; see also Table S1. (B) Association of rs11240391 with severe malaria (SM). The graph shows the percentage of the GG risk genotype (black) versus heterozygous TG and major homozygous TT (gray) in the control and SM groups. p values were calculated using logistic regression analyses and the graph displays the odds ratio (OR) with its 95% confidence interval. GG individuals have a 2.62 risk of developing SM. (C) Normalized LAX1 expression obtained by microarray in children with uncomplicated malaria (UM) and cerebral malaria (CM). Lower expression of LAX1 is observed in CM. (D) WashU epigenome browser view of recombination rate of Yoruba in Ibadan, Nigeria (YRI). Black lines correspond to the five SNPs previously identified (rs11240734, rs1541252, rs1541253, rs1541254, and rs1541255) and the SNP in the LAX1 promoter (rs11240391). The green line corresponds to the tagSNP (rs10900585) previously associated with SM in GWAS analyses. The ATP2B4 SNPs and the LAX1 SNP rs11240391 are in two different recombination blocks. (E) Linkage disequilibrium (LD) between different SNPs of the ATP2B4 and LAX1 genes in our Senegalese cohort. LD is expressed as r2 multiplied by 100. SNPs with an r2 > 0.6 are considered in LD and are colored in red. No LD was observed between the ATP2B4 SNPs and the SNP LAX1 rs11240391. (F) Epistatic interaction between the haplotype of five SNPs and rs11240391 computed by logistic regression. The plot shows the percentage of individuals carrying either both protective haplotype/genotype (mm + Mm/TT + TG) (m, minor haplotype; M, major haplotype) or both risk haplotype/genotype (MM/GG). Individuals carrying the GG genotype and the MM haplotype are at increased risk of SM. p values were calculated using logistic regression analyses and the graph displays the OR with a 95% confidence interval; see also Table S2. (G) SM risk associated with genotype-combination groups. The colored dots represent OR, and the bars represent 95% confidence intervals. Group I corresponded to the baseline SM risk (OR = 1). Group II had a moderate SM risk (OR = 2.99, 95% CI [1.54–5.78], p = 0.001); the risk was increased in group III (OR = 5.57, 95% CI [2.01–15.42], p = 0.0008). (H) Genotype combinations were identified by conditional logistic regression due to the interaction between ATP2B4 and LAX1 variants. Group I included individuals with at least one minor ATP2B4 haplotype copy and at least one major T allele copy for LAX1 (25% of SM and 53.4% of Ctrl). Group II included individuals homozygous for both major ATP2B4 haplotype and major T allele LAX1 as well as individuals homozygous either for major ATP2B4 haplotypes or minor G allele of LAX1 (53.6% of SM and 38.4% of Ctrl). Group III included individuals homozygous for both the major ATP2B4 haplotype and for the minor G allele of LAX1 (21.4% of SM and 8.2% of Ctrl). (I) Luciferase assays to functionally assess the epistatic effect between the haplotype, including the five SNPs in the ESpromoter, and the LAX1 promoter SNP rs11240391. Graphs showing the relative luciferase activity under the control of LAX1 promoter with T or G allele at rs11210391 alone or in combination with the ESpromoter containing either the major haplotype (maj: TCCGA) or minor haplotype (min: CTTGG) for the five SNPs (rs11240734, rs1541252, rs1541253, rs1541254, and rs1541255). Values were generated in triplicate from three independent experiments. The plot shows the mean values ±SEM. p values were calculated using a two-sided Student’s t test, and asterisks indicate significance (ns, not significant; ∗p < 0.05, ∗∗p < 0.01, ∗∗∗p < 0.001).
Figure 7
Figure 7
Model of the dual enhancer-silencer function of ESpromoter, epistatic interaction, and gene regulation (A) Chromatin interactions place promoters in close physical proximity, facilitating the recruitment of TFs needed to activate or repress transcription of their associated genes. The presence of an enhancer-silencer promoter (ESpromoter) within a regulated gene cluster could facilitate the assembly or maintenance of the TFs and cofactors by tightening the promoter-promoter interactions or by providing specific transcriptional regulators required for neighboring gene regulation. (B) Expression of the long transcripts ATP2B4 and LAX1 is regulated by a dual enhancer-silencer regulatory element (ESpromoter) in the same cell line through genetic variants associated with SM. ESpromoter functions as an enhancer for the long ATP2B4 transcripts independently of the haplotype of the five SNPs it contains (min, minor haplotype or Maj, major haplotype) while it functions as a silencer for LAX1 gene with an allele-specific intensity. The five SNPs within the ESpromoter act synergistically with rs11240391 to inhibit LAX1 gene expression. This epistatic interaction results in a stronger silencing effect in the presence of the G allele of rs11240391, for which no FOS::JUN binding is possible. Unidentified co-activators and co-repressors are also thought to modulate the activating or repressing effect on ATP2B4 and LAX1, respectively.

References

    1. Demircioğlu D., Cukuroglu E., Kindermans M., Nandi T., Calabrese C., Fonseca N.A., Kahles A., Lehmann K.-V., Stegle O., Brazma A., et al. A Pan-cancer Transcriptome Analysis Reveals Pervasive Regulation through Alternative Promoters. Cell. 2019;178:1465–1477.e17. doi: 10.1016/j.cell.2019.08.018. - DOI - PubMed
    1. Zhuang H.-H., Qu Q., Teng X.-Q., Dai Y.-H., Qu J. Superenhancers as master gene regulators and novel therapeutic targets in brain tumors. Exp. Mol. Med. 2023;55:290–303. doi: 10.1038/s12276-023-00934-0. - DOI - PMC - PubMed
    1. Sun N., Akay L.A., Murdock M.H., Park Y., Galiana-Melendez F., Bubnys A., Galani K., Mathys H., Jiang X., Ng A.P., et al. Single-nucleus multiregion transcriptomic analysis of brain vasculature in Alzheimer’s disease. Nat. Neurosci. 2023;26:970–982. doi: 10.1038/s41593-023-01334-3. - DOI - PMC - PubMed
    1. Riboldi G.M., Vialle R.A., Navarro E., Udine E., de Paiva Lopes K., Humphrey J., Allan A., Parks M., Henderson B., Astudillo K., et al. Transcriptome deregulation of peripheral monocytes and whole blood in GBA-related Parkinson’s disease. Mol. Neurodegener. 2022;17:52. doi: 10.1186/s13024-022-00554-8. - DOI - PMC - PubMed
    1. Wilk A.J., Lee M.J., Wei B., Parks B., Pi R., Martínez-Colón G.J., Ranganath T., Zhao N.Q., Taylor S., Becker W., et al. Multi-omic profiling reveals widespread dysregulation of innate immunity and hematopoiesis in COVID-19. J. Exp. Med. 2021;218 doi: 10.1084/jem.20210582. - DOI - PMC - PubMed

MeSH terms

LinkOut - more resources