. 2025 Aug;644(8076):473-482.
doi: 10.1038/s41586-025-09183-9. Epub 2025 May 29.

Mouse liver assembloids model periportal architecture and biliary fibrosis

Affiliations

Mouse liver assembloids model periportal architecture and biliary fibrosis

Anna M Dowbaj et al. Nature. 2025 Aug.

Abstract

Modelling liver disease in vitro requires systems that replicate disease progression1,2. Current tissue-derived organoids do not reproduce the complex cellular composition and tissue architecture observed in vivo3. Here, we describe a multicellular organoid system composed of adult hepatocytes, cholangiocytes and mesenchymal cells that recapitulates the architecture of the liver periportal region and, when manipulated, models aspects of cholestatic injury and biliary fibrosis. We first generate reproducible hepatocyte organoids with a functional bile canaliculi network that retain morphological features of in vivo tissue. By combining these with cholangiocytes and portal fibroblasts, we generate assembloids that mimic the cellular interactions of the periportal region. Assembloids are functional, consistently draining bile from bile canaliculi into the bile duct. Of note, manipulating the relative number of portal mesenchymal cells is sufficient to induce a fibrotic-like state, independently of an immune compartment. By generating chimeric assembloids of mutant and wild-type cells, or after gene knockdown, we show proof of concept that our system is amenable to investigating gene function and cell-autonomous mechanisms. Together, we demonstrate that liver assembloids represent a suitable in vitro system to study bile canaliculi formation, bile drainage and how different cell types contribute to cholestatic disease and biliary fibrosis in an all-in-one model.


Conflict of interest statement

Competing interests: M.H. is inventor in several patents on organoid technology. A.S., A.M.D. are inventors in a patent on organoids. The other authors declare no competing interests.

Figures

Fig. 1
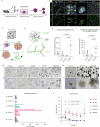
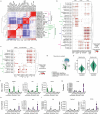
Fig. 1. HepOrgs retain marker expression and cell polarity of tissue.
a, Schematic (left) and representative immunofluorescence image (right; n = 5) of the liver periportal region. CD34 marks portal fibroblasts (PFs), osteopontin (OPN) marks ductal cells, phalloidin marks membranes and DAPI labels nuclei. Chol, cholangiocyte; Hep, hepatocyte; PV, portal vein. Scale bar, 10 µm. b, Representative bright-field images of HepOrgs at passage 1 (P1) cultured under the conditions described in Hu et al., Peng et al. or in HM-FBS, HM-Wnt or HM-WntS (n = 5 experiments). Scale bars: 500 µm (top row), 10 µm (bottom row). FBS, foetal bovine serum. c, Representative BF images of HepOrgs cultured in HM-Wnt at the indicated time points. Scale bars: 50 µm (day 9), 100 µm (day 49), 200 µm (day 203 and day 355). d, Immunofluorescence staining and 3D reconstruction of bile canaliculi (marked by CD13) in HepOrgs cultured in indicated conditions and mouse tissue. HepOrgs cultured in HM-Wnt have longer bile canaliculi compared with previous studies,. Cell borders are indicated by filamentous actin (F-actin) staining with phalloidin (Phall). Top, maximum-intensity projections of confocal images. HepOrgs are outlined with dashed lines. Bottom, bile canaliculi segmentation and 3D reconstruction. Scale bars, 50 µm. e, Number of triple junctions in the largest bile canaliculi network in tissue and organoids cultured in indicated conditions. Dots show the total number of triple junctions per structure and the line represents the mean. Kruskal–Wallis test with Dunn’s multiple comparisons post hoc test. NS, not significant. f, Organoid formation efficiency. Dots represent biologically independent samples (n = 5 biological replicates with at least 2 technical replicates) and the line represents the mean. Kruskal–Wallis test with Dunn’s multiple comparisons post hoc test. g, Immunofluorescence staining of tissue (left) and hepatocyte and cholangiocyte organoids (HepOrgs and CholOrg, respectively) grown in HM-Wnt (right), for the hepatocyte marker HNF4α and cholangiocyte markers KRT19 and OPN (n = 2 experiments). Scale bars: 50 µm (main images), 10 µm (smaller images). Phalloidin marks membranes and DAPI labels nuclei. h, Left, schematic showing hepatocyte polarity. CD13 (apical) and ECAD (basolateral) staining in tissue (middle) and organoids (right) shows similar distributions of markers. Yellow arrowheads indicate binucleated cells. Scale bars: 20 µm (left most images), 10 µm (expanded views). All data were obtained from n = 3–5 independent experiments. Source Data
Fig. 2
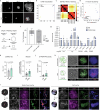
Fig. 2. HepOrgs exhibit physiological and functional bile canaliculi size and network resembling tissue.
a, Left, schematic of liver zonation. Right, maximum-intensity projections of staining from periportal (albumin (Alb)) and pericentral (glutamine synthetase (GS)) markers in tissue (top row) and HepOrgs cultured in MM (bottom row). Albumin and glutamine synthetase also shown as a Fire look-up table in the middle and right images (n = 3 independent experiments). Cells expressing glutamine synthetase are detected in the periphery of the organoids. Scale bars: 50 µm (top row), 20 µm (bottom row). CV, central vein. b, Histogram showing distribution of bile canaliculi diameters in tissue and HepOrgs. The curve represents the kernel density estimate, used here to estimate the probability density function of a continuous random variable, showing a smooth curve that represents the distribution of data points provided in Source Data. n = 3 independent experiments. c, Immunofluorescence staining (left), image reconstruction and analysis of bile canaliculi (BC) from HepOrgs cultured in HM-Wnt or MM, and tissue stained for CD13 (marking bile canaliculi), DAPI (nuclei) and phalloidin (F-actin). Individual interconnected networks are pseudo-coloured. The skeleton of the bile canaliculi network shows that the networks are longer and more interconnected in HepOrgs cultured in MM. Scale bar, 20 µm. n = 3 independent experiments. d, Left, length of the largest bile canaliculi network in HepOrgs cultured in HM-Wnt or MM, and tissue. Right, total number of junctions in the largest bile canaliculi network. Dots show the largest network in an individual organoid. Horizontal line indicates the median. HM-Wnt, n = 6; MM, n = 5; tissue, n = 6. Kruskal–Wallis test with Dunn’s multiple comparisons post hoc test. e, Transport of CLF and CMFDA in HepOrgs cultured in MM confirm the functionality of bile acid transporters. Compounds are shown in Royal look-up tables. Nuclei (SPY555-DNA (SPY-DNA)) and actin (SiR-actin (SiR-act)) are labelled (n = 3 independent experiments). Scale bars for each set of images are 50 µm and 10 µm (magnification). Images are stills from time-lapse imaging shown in Supplementary Videos 3 and 4. Source Data
Fig. 3
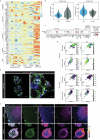
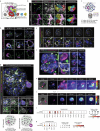
Fig. 3. Assembloids recapitulate mesoscale tissue architecture and gene expression.
a, Schematic of the experimental approach. Scale bars: 200 µm (top), 500 µm (bottom). Msc, mesenchyme. b, Representative images (n > 3 experiments) of assembloids cultured on a rocking platform (left) compared with tissue (right). PDGFRα–H2B–GFP marks mesenchyme, nuclear-tdTom and SOX9 mark cholangiocytes. Arrowheads indicate binucleated hepatocytes. Scale bars: 50 µm (main images), 20 µm (assembloids, zoom view), 10 µm (tissue, zoom view). c, Aggregation efficiency. Data are mean ± s.e.m. of n = 3 biological replicates from n = 3 independent experiments; Mann–Whitney test, two-tailed. d, Cellular composition of assembloids. Data are mean ± s.e.m. of assembloids from at least 3 independent experiments (n = 13 organoids total). Dots represent the percentage of hepatocyte, cholangiocyte or portal mesenchyme cells per structure. e, Representative confocal images of assembloids stained for the indicated markers. n > 3 experiments. Asterisks indicate bile duct lumen. Scale bars, 50 µm. f, Hepatocyte, cholangiocyte and mesenchyme marker expression in assembloids. Haemopoietic/endothelial markers (H/E) are not expressed. EGFP marks mesenchyme, tdTomato (tdTom) marks cholangiocytes. g, Uniform manifold approximation and projection (UMAP) from liver atlas datasets and assembloids (this study). h, Mesenchyme (green), hepatocytes (blue) and cholangiocytes (magenta) superimposed on UMAP data from g. i, Assembloid data superimposed on data from g. j, Immunofluorescence staining and image reconstruction of the connection between bile canaliculi from hepatocytes (ZO-1, CD13) and the lumen from bile duct (KRT19, PCK) in assembloids (top) and tissue (bottom). Right, 3D reconstruction visualizes hepatocytes (red, yellow) whose bile canaliculi (green) enter the bile duct lumen (magenta). n = 6 independent experiments, see Supplementary Videos 8 and 9. Scale bar, 10 µm. k,l, Schematic (k) and still images (l) of CLF transport (shown as Fire look-up table) from the live imaging shown in Supplementary Video 12 in assembloids indicates functional connection between bile canaliculi and bile duct lumen (mem-tdTomato). n = 3 independent experiments with n = 3 biological replicates. BA, bile acid analogue. Scale bar, 50 µm. Source Data
Fig. 4
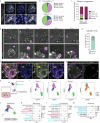
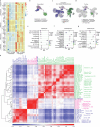
Fig. 4. Periportal assembloids mimic aspects of biliary fibrosis in vitro.
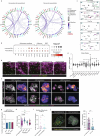
a, Schematic of the experimental design. b, Immunofluorescence images of assembloids with homeostatic (left) and 10× excess (right) of mesenchyme. n > 3 experiments. Scale bars: 50 µm (main images), 10 µm (zoom view). c, UMAP of fibrotic-like assembloid data (from this study) integrated with datasets from liver damage models. d, Circular plots represent the inferred cell–cell interactions from fibrotic-like assembloids, bile duct ligation (BDL) and CCl4 models from Yang et al.. Interactions reported in the literature and shared with BDL and CCl4 models are shown in red, interactions that are shared but not mentioned in the literature are in cyan and unique interactions are shown in black. Selected from the top 100 significant interactions for BDL. e, Gene set enrichment analysis (GSEA) of fibrosis-like versus homeostatic-like assembloids using MSigDB_Hallmark_2020 (black), KEGG_2019 (red) and Reactome_2022 (cyan) gene datasets. EMT, epithelial to mesenchymal transition; NES, normalized enrichment score. f, Cell composition of homeostatic-like and fibrotic-like assembloids. Dots show the percentage of cells per structure. Data are mean ± s.e.m. (3 independent experiments, n = 13 organoids); homeostatic-like data are reproduced from Fig. 3d. Mann–Whitney test, two-tailed. g, Left, immunofluorescence staining for cleaved caspase-3 (CASP3). Right, violin plot showing the median and quartiles of the percentage distribution of hepatocytes containing cleaved caspase-3 from three independent biological replicates. Each dot represents one organoid. Mann–Whitney test, two-tailed. Hom, homeostatic (n = 8); Fib, fibrotic-like (n = 7). Scale bars: 100 µm (left), 50 µm (middle), 25 µm (right). h, Left, SHG imaging reveals fibrous collagen deposition; cholangiocytes (nuc-tdTomato), mesenchyme (PDGFRα–H2B–GFP) and SiR-actin staining. Right, mean ± s.e.m. of the intensity of SHG signal from three biological replicates from n = 3 independent experiments. Mann–Whitney test, two-tailed. Homeostatic assembloids, n = 10; fibrotic-like assembloids, n = 4. Scale bars, 20 µm. i, Expression of selected genes in mesenchyme, presented as abundance, in homeostatic (Ctrl) and fibrosis-like (Damage) assembloids, or in damage or control tissue from BDL and CCl4 models from ref. . Source Data
Fig. 5
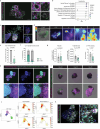
Fig. 5. Periportal assembloids as tools to investigate disease mechanisms.
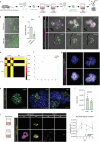
ad, Short interfering RNA (siRNA)-mediated knockdown experiments in assembloids. Mesenchyme cells (green nuclei and magenta membrane) were transfected with targeting or non-targeting siRNAs before assembly. a, Experimental design, including schematic of the DETECT distance ratio metric (d1/d0). b, Live imaging analysis of assembloids formed with mesenchyme cells transfected with non-targeting (left) or Cdh11 (right) siRNA. Cell boundaries are indicated by SiR-actin. The white dotted line indicates segmentation of the organoid border. Scale bars, 50 µm. c, Segmented assembloids from b were used as input for the DETECT algorithm and to calculate the DETECT distance metric. Violin plots show median and quartiles of the DETECT distance ratio for the non-targeting and Cdh11-knockdown (KD) group. Mann–Whitney test, two-tailed. Dots represent individual assembloids (n = 16 from 2 independent experiments). d, SHG images of assembloids showing fibrillar collagen deposition in non-targeting control and Cdh11-knockdown groups. PDGFRα–H2B–GFP marks portal fibroblasts. n = 2 independent experiments. Scale bars, 25 µm. e, Left, schematic of Mdr2+/+ and Mdr2−/− HepOrgs. Right, immunofluorescence images of HepOrgs derived from wild-type (top) or Mdr2−/− (bottom) livers show dilated bile canaliculi on Mdr2−/− organoids. CD13 (green) marks bile canaliculi. Phalloidin marks cell borders. n = 3 independent experiments with n = 3 biological replicates. Scale bars: 20 µm (main images), 10 µm (zoom views). fh, Chimeric assembloids were formed by Mdr2−/− HepOrgs (bright field, grey), wild-type cholangiocytes (nTom-Chol) and wild-type portal mesenchyme (PDGFRa–H2B–GFP). f, Schematic of experimental design. g, Still images from live imaging experiments (n = 2 independent experiments) of assembloids formed with Mdr2+/+ or Mdr2−/− HepOrgs. Scale bars, 50 µm. h, Change in cholangiocyte numbers between day 0 and day 5 in assembloids formed with Mdr2+/+ or Mdr2−/− HepOrgs. Data are mean ± s.e.m. of 2 biological replicates from n = 2 independent experiments with n = 23 (Mdr2+/+) and n = 22 (Mdr2−/−) assembloids. Dots represent individual assembloids. Mann–Whitney test, two-tailed. Source Data
Extended Data Fig. 1
Extended Data Fig. 1. HepOrg grown in optimized medium expand long-term.
a. Experimental design. b. Immunofluorescence staining for bile canaliculi (CD13, green) and F-actin (Phall, grey) in 2D-hepatocytes cultured as sandwich culture, HepOrg cultures grown in Hu et al. media, Peng et al. media, and in liver tissue sections. Note the difference in organoid size and length of the bile canaliculi when compared to the optimized medium in Fig. 1d. DAPI stained nuclei (blue). Representative images from n = 3 independent experiments. Scale bar, 50 µm. c. Schematic illustration of the 3-dimensional (3D) nature of bile canaliculi network within HepOrg. d. Schematic representation of the different measurements used to describe the bile canaliculi network. e. Graph represents the length of the largest network in HepOrg cultured as indicated. Dot, measure per organoid. Line, mean. Kruskal-Wallis-test followed by Dunn’s multiple comparison post-hoc test. f. Graph represents the number of quadruple junctions for the largest network in tissue and HepOrg cultured as indicated. Line, mean. Dot, measure per organoid. Kruskal-Wallis-test followed by Dunn’s multiple comparison post-hoc test. g-h. Bright-field pictures of HepOrg at passage 0 (P0, 9 days after seeding) (g), or at passage 2 (P2, 29 days after seeding) (h), seeded as sparse culture (1000 cells/well) and cultured under the indicated media conditions. Representative images from n = 3 independent experiments. Scale bar, 500 µm; zoom-in 100 µm. i. Graph shows HepOrg expansion over time. Each line represents an independent biological replicate. Cultures were split at a 1:2 split ratio. Dot, time of passage. j. Growth curves of HepOrg grown in the indicated media. Values represent total number of cells at the indicated passage expressed as mean ± SEM from n = 4 independent biological replicates with n = 2 technical replicates. Statistics are provided between HM-Wnt and the other conditions and presented colour-coded for the condition they compare to; multiple unpaired t-tests, two-sided. Source Data
Extended Data Fig. 2
Extended Data Fig. 2. The starting number of initiating cells dictates HepOrg morphology.
a. Maximum intensity projection of images from live imaging of membrane-tdTomato HepOrg seeded as >2 hepatocyte cell clusters (top) or as single cells (bottom). Seeding density, 200 cells/μl from n = 2 independent experiments. Scale bar, 50 µm. b-d. DETECT calculations on HepOrg morphological variation integrating all time points (d0-d13). (b) t-SNE plot visualizes the DETECT results. Dot, individual organoid coloured according to shape type. (c) Heatmap of the DETECT metric distance for the DETECT results of each HepOrg pair integrating all time points (d0-d13). (d) K-means clustering applied to DETECT calculations following PCA reduction to two principal components. Dot, individual organoid; crosses, centroid of the respective clusters; colour, cluster assignment for the organoid. e-f. Analysis of the HepOrg shape according to the number of cells originating the structure. e, Schematic illustration. f, Bar graph shows the shape-type according to the initial number of cells in the structure. Results are presented as percentage from a total of n = 30 structures per experiment and expressed as mean ± SEM from n = 2 independent experiments. g. qRT-PCR expression analysis of the indicated markers in HepOrg (passage 2) hand-picked according to their ball-shape or bubbly/grape-shape morphology. Graph represents the mean ± SEM from n = 5 independent experiments for most genes, aside from Cyp2e1, tested n = 1 for ball-shape and n = 2 for bubbly-shape. Each dot is a biological replicate. The differences between ball-shape and bubbly-shape are not significant (Mann-Whitney test). Chol, cholangiocyte; Hep, hepatocyte; BAtrans, bile canaliculi transport. h. Viability assay (CellTiter-Glo) performed on ball-shape and bubbly/grape-shape HepOrg. Graph represents mean ± SEM of n = 3 biological replicates from 3 independent experiments, with dot colour denoting each independent experiment; Mann-Whitney test, two-tailed. i-j. Albumin (i) and Cytochrome activity (j) measurements of ball-shape versus grape-like/bubbly-shape HepOrg show non-significant but marked reduction in functionality of ball-HepOrg. Graph represents mean ± SEM of n = 5 biological replicates from 3 independent experiments; Mann-Whitney test, two-tailed. k. Brightfield and immunofluorescence images of bubbly/grape-like-shape (top) and ball-shape (bottom) HepOrg, stained for apical polarity marker CD13 (green) and apoptosis marker (cleaved caspase 3, grey; also shown in Fire LUT for easy visualization). n = 3 independent experiments. Scale bar, 50 µm. l. Still images of live cell imaging analysis of bile acid analogue uptake (CLF, green in the middle panel, fire LUT in most right panel) in membrane-tdTomato HepOrg (mTom, magenta) with bubbly/grape-shape (left) or ball-shape (right). SiR-actin (grey) labels cell borders. Note that bubbly/grape-like organoids uptake and release CLF into their bile canaliculi while ball-shape organoids accumulate it in hepatocytes. n = 2 independent experiments. Left, schematic of experimental set up. Scale bar, 20 µm. Source Data
Extended Data Fig. 3
Extended Data Fig. 3. Optimised HepOrg express hepatocyte markers and present hepatocyte function similar to freshly isolated hepatocytes.
a. qRT-PCR expression analysis of selected marker genes from HepOrg grown in the indicated medium conditions over several passages (P). Graphs represent mean ± SEM of n = 2 biological replicates from n = 2 independent experiments performed as n = 2 technical replicates per experiment. b. Bulk RNA sequencing analysis of HM-Wnt media HepOrg compared to freshly isolated hepatocytes. Heatmap represents the log10(TPM + 1) (transcripts per million) values from the RNAseq for the indicated genes, which are Z-scored across the gene (n = 3 biological replicates). c. Immunofluorescence staining of the tight-junction marker ZO1 (yellow), bile canaliculi marker CD13 (green), DAPI (blue, nuclei) and Phalloidin (F-actin, grey) in HepOrg from optimized medium. Representative images of n = 2 independent experiments. Scale bar, 10 µm. d. Left and middle, immunofluorescence staining for DAPI (Cyan, nuclei), Phalloidin (F-actin, grey), hepatocyte marker albumin (ALB, yellow) and cholangiocyte marker SOX9 (magenta) in optimised HepOrg (left) and cholangiocyte organoids (CholOrg, middle) in EM medium. Right, staining in liver tissue. Representative images of n = 2 independent experiments. Scale bar, 50 µm; zoom-in 10 µm. e. Left and middle, immunofluorescence staining for CD13 (apical, green), E-Cadherin (ECAD, basolateral, magenta), DAPI (nuclei, cyan) and F-actin (Phall, membrane, grey) in HepOrg grown in optimized medium (left) and CholOrg grown in EM medium (middle). Right, immunofluorescence staining for Radixin (apical, green) and E-Cadherin (ECAD, basolateral, magenta) in liver tissue. Representative images of n = 2 independent experiments. Scale bar, 50 µm; zoom-in 10 µm. f. qRT-PCR of multidrug resistance associated protein 2 (Mrp2) in HepOrg from indicated media. Graph represents mean ± SEM of n = 2 biological replicates from n = 2 independent experiments performed as n = 2 technical replicates per experiment. g. Albumin secretion of HepOrg grown in indicated medium conditions; Graph represents mean from n = 2 technical replicates. h. Cytochrome activity (HepOrg n = 4, sandwich n = 3), total bile acid measurements and Albumin secretion (n = 3, each 2 technical replicate) of HM-Wnt HepOrg (Alb and CYP3A4-IPA reproduced from HepOrg bubbly, Extended Data Fig. 2i,j) compared to hepatocyte sandwich culture show improved functionality of HepOrg. Graph represents mean ± SEM; Mann-Whitney test, two-tailed. Source Data
Extended Data Fig. 4
Extended Data Fig. 4. Spontaneous formation of non-physiological hepatocyte-cholangiocyte structures and identification of assembloid co-culture media.
a. Brightfield and immunofluorescence images of chimeric hepatocyte-cholangiocyte (Hep-Chol) organoid, where cholangiocyte organoids (CholOrg) spontaneously emerge in the vicinity of hepatocyte organoids (HepOrg). F-actin (Phall, grey), and nuclei (DAPI, cyan). Note the non-physiological ratio between both cell types (compare to Fig. 1a). n > 3 independent experiments. Scale bars, brightfield −100 µm, IF − 50 µm, zoom-in 10 µm. b. Immunofluorescence (IF) staining for CD13 (BC, green) and SOX9 (cholangiocytes, magenta) in chimeric Hep-Chol organoids. DAPI (nuclei, cyan) and Phalloidin (membrane, grey). Note the lack of connection between the bile canaliculi from hepatocytes and bile duct, despite the proximity of both structures. n > 3 independent experiments. Scale bar, 20 µm, zoom-in, 10 µm. c. Left, schematic of experimental approach (reproduced from ref. (CC BY 4.0)). Right, representative images (n = 3 independent experiments) of seeded hepatocytes after isolation from a tamoxifen-injected Prom1-CreERT2 x R26-LSL-ZsGreen mouse livers after 14 days wash-out period. Note the presence of small ZsGreen-labelled cells (arrowhead, left picture), which then expand into ZsGreen-labelled cholangiocyte organoids (arrowhead, right picture). Scale bars, left 200 µm, right 500 µm. d. Sorting strategy to identify how many cholangiocytes are labelled by ZsGreen in our experiments. Representative plots of n > 2 biological replicates are shown. e. Percentage of recombined cholangiocytes from ‘c’. The % of labelled cells is similar between day 0 and day 7 of culture, suggesting that the CholOrg derived from contaminating cholangiocytes in the hepatocyte isolation prep. Graph represents mean (d0 n = 3, d7 n = 2) of 2 independent experiments. f-j. Co-culture media test to obtain medium that prevented cholangiocyte and mesenchyme overgrowth, while preserving hepatocyte polarity and bile canaliculi structure. f. Representative HepOrg brightfield images at passage 1, cultured in HM-Wnt, and switched to specified media for 7 days. Scale bar, 100 µm, zoom-in, 50 µm. g. HepOrg stained with a live/dead cell dye as detailed in methods; culture at passage 1 switched to specified media for 7 days. Scale bar, 50 µm. h. Ratio of live to dead dye intensity, corresponding to pictures from g. Data is presented as box (the interquartile range, 25th and 75th percentile, with line at median) and whiskers (min, max of the data) plot from HM-Wnt n = 5; DM n = 4; MM n = 5 biological replicates. Paired t test, two-tailed. i. qRT-PCR expression analysis of selected marker genes in HM+Wnt (n = 3), MM (n = 3) and DM (n = 2) media; Graph represents mean, with ± SEM when n = 3. Freshly isolated hepatocytes (n = 2) and CholOrg (n = 1) controls are also included. j. Representative images (n = 2 independent experiments) of cholangiocyte organoids (CholOrg) and portal mesenchymal cells (Msc Pdgfra+Sca1+) monoculture, cultured in MM (top) or HM-Wnt (bottom) and stained with a live/dead fluorescent cell dye. k-l. Total bile acid (k) and albumin (l) production from HepOrg grown in HM-Wnt or MM. Data is presented as mean +/- SD from n = 4 replicates from n = 4 independent experiments. Results are expressed as µM concentration (k) or ng/ml (l) normalised to total cell number per condition; scale bar, 50 µm. m. Number of nuclei per cell in HepOrg grown in specified medium, n = 3. Source Data
Extended Data Fig. 5
Extended Data Fig. 5. HepOrg in MM and HM-Wnt media show some degree of zonation.
a. Bulk RNA sequencing analysis of HM-Wnt and MM media HepOrg compared to freshly isolated hepatocytes. Heatmap represents the log10(TPM + 1) (transcripts per million) values from the RNAseq for the indicated genes, Z-scored across each gene (n = 3 biological replicates). For HM-Wnt, some genes are reproduced from Extended Data Fig. 3b. b. Zonation score calculated from scRNAseq data of HM-Wnt and MM media HepOrg shows that HM-Wnt-grown HepOrg are on average more pericentrally zonated, while the score is shifted periportally for MM-grown HepOrg. c. Dot plot shows gene expression from scRNAseq of HM-Wnt and MM media HepOrg for pericentral and periportal genes, as well as zonated cholesterol metabolism genes. d. UMAP representing the hepatocytes from HM-Wnt and MM media HepOrg and expression of selected periportal (Cdh1, Alb) and pericentral (Cyp1a2, Cyp2e1) genes in the two media. e. Expression of periportal (Gls2, white) and pericentral (Cyp1a1, magenta) gene RNA visualised by RNAscope in HepOrg from MM media, representative of n = 3. Alb (green) and nuclei (DAPI, blue) are also shown. Scale bar, 50 µm, zoom-in, 20 µm. f. Immunofluorescence staining of periportal (E-CAD, E-cadherin, green and Fire LUT), pericentral (CYP2E1, magenta, and Fire LUT), Actin (Phalloidin, grey) and nuclei (DAPI, blue) in HepOrg cultures (P2) grown in HM-Wnt and transferred to MM for 7 days, compared to liver tissue. Representative images from 4 independent experiments are shown. Scale bar, 50 µm. Source Data
Extended Data Fig. 6
Extended Data Fig. 6. HepOrg in assembloid media form narrow and homogenous bile canaliculi network.
a. Immunofluorescence staining for bile canaliculi (CD13, green), nuclei (DAPI, blue) and cell borders (Phalloidin, grey) in HepOrg grown in the different media. Representative images from 3 independent experiments are shown, Scale bar, 100 µm. b. Immunofluorescence staining for bile canaliculi (CD13, green) and cell borders (Phalloidin, grey) in liver tissue (left), HepOrg cultures in MM for 7 days (middle), or HepOrg grown in HM-Wnt media (right). Representative images are shown of n = 3 independent experiments. Scale bar, 20 µm, zoom-in, 10 µm. c. Representative BC networks from healthy mouse liver tissue (left), HepOrg grown in MM media (middle), and HepOrg in HM-Wnt media (right). Colour corresponds to the mean bile canaliculi (BC) diameter in μm as indicated in intensity scale (blue, BC < 1.5 um; white, BC > 6 um). Note that BC is most homogenous in tissue, followed by HepOrg in MM media, while HepOrg in HM-Wnt media show large BC diameter variability. n = 3 independent experiments. d. Still images from time-lapse imaging analysis of fluorescent phosphatidylcholine (16:0-06:0 NBD PC) confirms functionality of MDR2 transporter. Compounds are shown in Royal LUT. Nuclei (SPY555-DNA, magenta) and actin (SiR-act, cyan) are also shown. n = 3 independent experiments. Scale bar, 50 µm. e. Dot plot shows gene expression from scRNAseq of HM-Wnt and MM media HepOrg for bile transporter genes.
Extended Data Fig. 7
Extended Data Fig. 7. Generation and analysis of periportal assembloids.
a. Representative immunofluorescence images of periportal assembloids generated using AggrewellTM method. Msc (PDGFRα-H2BGFP,green), cholangiocytes (nuclear-tdTom, magenta), nuclei (DAPI, blue) and F-actin (Phalloidin, grey) are shown. n = 3 independent experiments. Scale bar, 50 µm, zoom-in, 10 µm. b-c. Aggregation efficiency of periportal assembloids. b. Aggregation efficiency compared to all structures observed (regardless whether they contained one or more cell types). Pie chart represents the mean of n = 3 biological replicates from 3 independent experiment. Results are presented as % of a specific structure respective to the total number of structures. Periportal assembloid with 3 cell types chol, hep, Msc; HepOrg, hepatocyte organoids only; Chol-Org, cholangiocyte organoid only; Chol-Msc, cholangiocyte-Msc organoid. c. Aggregation efficiency comparing conditions where HepOrg had been pre-conditioned for 48hrs prior to aggregation with the co-culture medium MM (MM) or not (HM-Wnt). Graph represents mean n = 2 biological replicates. d. Two examples of assembloid formation. Still images from time-lapse imaging analysis of periportal assembloids composed of hepatocytes, mesenchyme (nuc-GFP, green) and cholangiocytes (mem-tdTomato, magenta). Nuclei are stained with SPY620 (grey). Scale bar, 100 µm, zoom-in, 20 µm. e. Aggregation mode representing assembly before or after seeding in Matrigel. Graph represents mean ± SEM of n = 3 biological replicates from n = 3 independent experiments. f. Representative confocal images (n = 2) of periportal assembloids stained for cholangiocyte (SOX9) and mesenchymal (vimentin) markers. Nuclei are stained with DAPI (blue). Scale bar, 30 µm. g. Representative confocal images of periportal assembloids stained for portal fibroblast marker Elastin (white) marker, in combination with PDGFRα-H2BGFP endogenous signal (GFP), and with Msc membranes visualised by membrane-tdTom. (n = 7 replicates from n = 3 independent experiments). Scale bar, 50 µm. h. Schematic representation of the experimental set up. Cultures were collected at day 7 after assembly and submitted for scRNAseq analysis. i. UMAP representing three biological replicates, each visualising the proportion of mesenchymal (green), cholangiocyte (magenta) and hepatocyte (blue) cells. j. UMAP combining 3 biological replicates of scRNAseq assembloid datasets. k-m. GSEA against GO_Biological_Process_2023 (Cyan), GO_Cellular_Component_2023 (Black) and GO_Molecular_Function_2023 (Red) databases for each of the cell types in assembloids: mesenchyme (k), cholangiocytes (l) and hepatocytes (m), vs the other 2 cell types. NES, normalized enrichment score. Source Data
Extended Data Fig. 8
Extended Data Fig. 8. scRNAseq analysis indicates that periportal assembloids resemble in vivo liver tissue.
a. Correlation analysis of cells from healthy liver tissue datasets with assembloids (this study). b. Dot plot showing hepatocyte (Hep), cholangiocyte (Chol) and mesenchyme (Msc) markers for assembloids (THIS STUDY) and liver atlases. Note similarity between assembloid and liver tissue datasets. c. Dot plot showing hepatic stellate cells (HSC), portal fibroblasts (PFs) and vascular smooth muscle cells (VSMC) gene expression analysis of mesenchymal cell types present in liver tissue datasets compared to mesenchyme in assembloids (THIS STUDY). d. UMAP showing the mesenchymal subtypes in the different datasets: hepatic stellate cells (HSC), portal fibroblasts (PFs) and vascular smooth muscle cells (VSMC), compared to mesenchyme in assembloids (THIS STUDY). Note that the mesenchyme in assembloids clusters next to published portal fibroblasts mesenchyme. e. Zonation score calculated from scRNAseq data of assembloids shows that hepatocytes from homeostasis assembloids are on average more periportally zonated, reminiscent of hepatocytes from HepOrg grown in MM media. f-i. Analysis of Msc, cholangiocytes (Chol) and hepatocytes (Hep) cells FACS-sorted from assembloids and compared to freshly isolated cells from liver tissue. qRT-PCR expression analysis of selected marker genes for mesenchyme (f), cholangiocyte and progenitor (g-h) and hepatocyte (i) identity. Graph represents mean ± SEM from n = 4 (assembloid cells) or n = 3 (tissue cells) from 3 independent experiments. Source Data
Extended Data Fig. 9
Extended Data Fig. 9. Periportal assembloids recapitulate in vivo tissue architecture and functional connection between BC from hepatocytes and bile duct cells.
a. Schematic representation of the interface between hepatocyte bile canaliculi (BC) and lumen of cholangiocyte bile duct (BD). b. Immunofluorescence staining and image reconstruction of hepatocyte-bile duct interface in assembloid (top panel), and liver tissue (bottom panel). Representative images show how the bile canaliculi (CD13, green) from hepatocytes enters into the lumen of bile duct (nuc-tdTomato, PCK, magenta). Right, 3D reconstruction where hepatocytes (red, yellow, cyan) whose bile canaliculi (green) enter the bile duct lumen (magenta) are visualised. Nuclei are counterstained with DAPI (grey). n = 5 biological experiments. Scale bar, 10 µm. c. Schematic of the imaging set up to visualise integration of the BC-BD connection with portal Msc cells. d. Immunofluorescence image of one assembloid containing three physical connections (BC:BD_1, BC:BD_2, BC:BD_3) between hepatocytes and bile duct. Connections are visualized using zonula occludens (ZO-1, green). Nuclei are counterstained with DAPI (blue). n = 6 independent experiments. Scale bar, 50 µm; zoom-in,10 µm. e. Consecutive sections of assembloids containing hepatocytes, cholangiocytes (nuc-tdTom-Chol, magenta) and portal mesenchyme (PDGFRα-H2BGFP-Msc, yellow). Left-to-right, ascending Z-stacks show 2 physical connections between bile canaliculi (CD13, green) from hepatocytes and a single bile duct lumen. Note that portal mesenchyme cells (yellow) are located in close proximity to cholangiocytes (magenta), recapitulating the architectural arrangement of the in vivo tissue (compare to Fig. 1a). Representative image of an entire assembloid (top), and detail (bottom). Nuclei is stained with DAPI (blue) and F-actin with Phalloidin (Phall, grey). n = 3 biological experiments. Scale bar, 50 µm; zoom-in, 10 µm. f. Representative immunofluorescence image (n > 3) of an assembloid containing hepatocytes, cholangiocytes (mem-tdTomato, magenta), and portal mesenchyme (PDGFRα-H2BGFP, green). Zoom-in, detail of two independent connections (1,2) between bile ducts and bile canaliculi (BC). Right, consecutive Z-stacks of Zoom-in number 1 (left) and Zoom-in number 2 (right) showing the BC entering the BD (Z-slice panels: (1) 0.79 µm, 3.95 µm and 5.53 µm; (2) 26.07 µm, 37.92 µm and 57.67 µm). Nuclei are counterstained with DAPI (blue). Scale bar, 50 µm; zoom-in,10 µm. g. Maximum intensity projection (MIP) of an assembloid with two bile duct structures, one embedded in the assembloid and connecting to the bile canaliculi network (A, yellow arrowhead) and one outside of the assembloid and not connected to the bile canaliculi (B, cyan arrowhead). Bile canaliculi (CD13, green), actin (Phalloidin, grey), nuclei (DAPI, blue) are stained, and Msc and cholangiocytes are visualised using the endogenous fluorescence from PDGFRα-H2BGFP (yellow) and nuc-tdTom (magenta), respectively. n = 3 independent experiments with n = 10 total biological replicates. Scale bar, 50 µm; zoom-in, 10 µm. h. Live imaging analysis of the uptake and flow of bile acid analogue (CLF, Fire LUT) from bile canaliculi into the lumen of bile ducts shows functional bile canaliculi-bile duct connection, n = 3. Scale bar, 50 µm. i. CLF (Fire LUT) uptake is not observed in structures with aberrant architecture where cholangiocytes (magenta, mem-tdTomato, magenta arrowhead) are not embedded in the organoid (white arrowhead), n = 3. Scale bar, 50 µm; zoom-in,20 µm. j-k. Dot plots of scRNA gene expression for bile acid transporters (j) and cholangiocyte apical markers (k) indicate that hepatocytes (j) and cholangiocytes (k) functional marker expression are improved upon assembloid culture.
Extended Data Fig. 10
Extended Data Fig. 10. Fibrotic-like assembloids resemble in vivo fibrosis models.
a. Bulk RNA sequencing analysis of homeostasis and fibrotic-like assembloids after 7 days or 2.5 weeks of culture. Heatmap represents the log10(TPM + 1) (transcripts per million) values from the RNAseq for the indicated genes, Z-scored across each gene (n = 3 biological replicates). b. UMAP representation of fibrosis-like assembloids. c. UMAP representation of liver damage models and assembloid integration; green – Msc, magenta – cholangiocytes, blue – hepatocytes, cyan – liver progenitor-like cells (LPLC). d. UMAP representation of the liver damage model datasets (grey) compared to fibrotic-like assembloids (colour). e. GSEA of fibrosis-like and homeostasis from hepatocytes in assembloids (MSigDB_Hallmark_2020). NES, normalized enrichment score. f. GSEA of fibrosis-like and homeostasis from cholangiocytes in assembloids (MSigDB_Hallmark_2020). NES, normalized enrichment score. g. GSEA of fibrosis-like and homeostasis from mesenchyme in assembloids (MSigDB_Hallmark_2020). NES, normalized enrichment score. h. Correlation analysis of various damage models comparing liver tissue datasets with fibrosis-like assembloids (THIS STUDY).
Extended Data Fig. 11
Extended Data Fig. 11. Fibrotic-like assembloids exhibit several features of biliary fibrosis.
a. Immunofluorescence images of hepatocytes (magenta) contacted by mesenchyme (nuclear GFP, green) expressing cleaved caspase 3 (grey) and lacking the DNA staining (cyan). n > 3 independent experiments. Scale bar, 50 µm; zoom-in,10 µm. b. GSEA of fibrosis-like versus homeostasis hepatocytes in assembloids, showing all significant terms relating to cell death. c. Freshly sorted mesenchyme also induces apoptosis in fibrotic-like ratio. Cells were stained for cleaved caspase 3 (orange), Phalloidin (membranes, white) and DAPI (nuclei, blue). Hepatocytes (nuc-tdTomato, magenta) and mesenchyme (PDGFRα-H2BGFP, green) were visualized using their endogenous fluorescent gene expression. n = 2 independent experiments. Scale bar, 100 µm; zoom-in, 50 µm. d. Live imaging of the CLF bile acid analogue uptake in fibrotic-like assembloids. n = 3 independent experiments. Scale bar, 100 µm; zoom-in, 10 µm. e. Quantification of the CLF bile acid analogue uptake and transport to bile canaliculi (BC) in assembloid structures containing 3 cell types in homeostatic (n = 4) or fibrotic-like (n = 4) conditions; Results are presented as % of organoids where CLF is detected in bile canaliculi. Graph represents mean ± SEM. Mann-Whitney test, two-tailed. f. Percentage of assembloids, where the transport of CLF from bile canaliculi (BC) to bile duct (BD) was observed. Graph represents mean ± SEM n≥3 biological replicates. g. Albumin secretion, total bile acid (n = 7) and cytochrome activity (CYP1A2, n = 3) measurements from homeostatic (Hom) or fibrotic-like (Fib) assembloids. Graph represents mean ± SEM from 3 independent experiments. Dot, biological replicate; Mann-Whitney test, two-tailed. h. Immunofluorescence images of periportal assembloids stained for proliferation marker Ki67 (white) and nuclei marker DAPI (blue), with endogenous expression of membrane CFP (mem-CFP, cyan, cholangiocytes), nuclear GFP (PDGFRα-H2BGFP, green, Msc) and membrane dTomato (mem-tdTomato, magenta, hepatocytes). n = 3 independent experiments. Scale bar, 200 µm; zoom-in, 150 µm. i. Long term culture (2.5 weeks) of periportal assembloids shows cholangiocyte expansion from nTdTom cholangiocytes (magenta). Msc (green) and brightfield (grey) are also shown. n = 3 independent experiments. Scale bar, 100 µm. j. UMAP representation of cell proportions in scRNAseq data of homeostasis and fibrosis-like assembloids, from 1 week or 2.5 week (long-term, LT) culture, showing expansion of cholangiocytes in fibrosis-like long-term condition. n = 3 independent experiments. k. Staining of fibrosis-like assembloid for portal fibroblast marker SCA1 (white) as well as all mesenchyme (PDGFRα-H2BGFP, green), cholangiocytes (mem-tdTomato, magenta) and nuclei (DAPI, blue), where cell borders are outlined by phalloidin staining (white). Scale bar, 100 µm; zoom-in, 20 µm. Source Data
Extended Data Fig. 12
Extended Data Fig. 12. Assembloids as a tool to investigate cell-autonomous mechanisms in fibrosis.
a. Circular plots representing the inferred top 30 cell-cell interaction in fibrosis-like and homeostasis-like assembloids. b. Dot plot of genes upregulated in fibrotic-like vs homeostatic mesenchyme. c. Cytokine array of supernatant from homeostasis, and fibrotic-like assembloid culture and from hepatocyte (HepOrg) and cholangiocyte (CholOrg) organoids and portal mesenchyme, grown individually in MM media. n = 2 independent experiments. Blue boxes, hot spots showing positive control and orientation markers; magenta boxes, cytokines that are only expressed in fibrotic-like assembloids; note CXCL1 expression in cholangiocytes, while MMP3 and CCL11 are expressed by the mesenchyme. d. Immunofluorescence images for collagen deposition (SHG) in naïve mesenchyme following exposure to inflammatory cytokines for 7 days. Note that no collagen is detected. Triple denotes a combination of 100 ng/ml of each of CXCL1, CCL11 and CXCL12. Representative images of n = 3 biological replicates. Scale bar, 50 µm; zoom-in,50 µm. e. DETECT analysis of assembloids treated with blocking antibodies against specified proteins, or matched-species control; violin plot shows DETECT distance ratios; Mann-Whitney test. Dot, individual organoids from n = 3 biological replicates. f. Still images from a live imaging analysis of fibrotic-like assembloids containing Msc (nuc-GFP, green, and membrane-tdTomato, magenta) transfected with siRNA against specified genes prior to assembly. Representative images from n = 2 independent biological replicates at day of seeding (top panel) and day 2 of culture (bottom panel). SiR-actin (membrane, grey). Fire LUT images (right panels) show examples of assembloid border segmentation based on maximum intensity projection images. Scale bar, 50 µm. g. Gene knock-down efficiency; Graph represent normalized expression of the genes in the siRNA treatment relative to the non-targeting control (dotted line). h. Violin plots showing median and quartiles of the DETECT distance ratio (d1/d0) for non-targeting pool, Cdh11, Cdh2 and Mmp3 siRNA. Dots represent values of the DETECT distance ratio of individual assembloids from n = 2 biological replicates. Kruskall-Wallis test, followed by Dunn’s multiple comparisons test. i. Graph represents median from the total number of Msc cells (segmented as GFP nuclei) per assembloid at day0 (assembloid seeding). n = 2 independent experiments. Non-targeting pool, n = 15; Cdh11-KD, n = 17. (Mann-Whitney two tailed test, ns, not significant, p = 0,0669). j. Images show the entire assembloid presented as detail in Fig. 5d showing fibrillar collagen deposition as analysed by SHG (second harmonic generation microscopy analysis, yellow) in control (left) and Cdh11-KD Msc assembloids (right). SiR-actin (membrane, grey) and Msc nuclei (green). Right, quantification of SHG; Graph represents the area  ± S.D.  of SHG-positive signal over the area of whole assembloid, for the non-targeting pool control and the Cdh11-KD group at day3 (assembloid seeding). Non-targeting pool, n = 15; Cdh11-KD, n = 14. Mann-Whitney two tailed test, p = 0.0052. Scale bar, 100 µm. Source Data
Extended Data Fig. 13
Extended Data Fig. 13. Knockout of Itgb1 in Msc results in reduction of fibrotic-like phenotype in assembloids.
a. Schematic of experimental set up for a-i. Reproduced from ref. (CC BY 4.0). b. Representative pictures of Itgb1-KO cells expressing ZsGreen before and after FACS sorting. n = 2 independent experiments. Scale bar, 200 µm. c. Validation of Itgb1-KO (n = 4) compared to control (n = 2) by qRT-PCR against Itgb1 gene; graph represents mean and ± SEM when n > 3. d. Live imaging analysis of fibrotic-like assembloids formed with CTRL Msc (top) and Itgb1-KO Msc (bottom), showing that Itgb1-KO prevents collapse of the structures. Representative images from n = 2 biological replicates are shown. Scale bar, 50 µm. e-f. DETECT analysis of the shape change over time. n = 2 independent experiments. (e) Heatmap of the DETECT distance metric for the DETECT results of Itgb1-KO Msc and CTRL-Msc containing fibrotic-like assembloids. (f) Visualisation of morphological variations of Itgb1-KO Msc and CTRL-Msc containing fibrotic-like assembloids using t-SNE based on DETECT calculations that integrate all time points. g. Immunofluorescence images of fibrotic-like assembloids formed by Itgb1-KO Msc (green). Representative images from n = 2 biological replicates are shown. Cholangiocytes (tdTom-nuclei, magenta) are shown, together with actin (phalloidin, grey) and nuclei (DAPI, blue) staining. Note intact organoid structure and intact hepatocyte nuclei. Scale bar, 50 µm. h. Fibrotic-like assembloids containing Itgb1-KO Msc (green) deposit less collagen, as visualised by second harmonic generation (SHG) imaging (yellow). Representative images are shown. Scale bar, 50 µm. i. Quantification of fibrous collagen deposition (SHG) from (h). Graph represents mean ± SEM of n = 4 biological replicates from n = 2 independent experiments. Dot, biological replicate; paired t-test, two-tailed. j. Representative images (left) and quantification (right) of collagen deposition as visualised by second harmonic generation (SHG, yellow) in cultures where 2500 Msc cells were seeded in sparse or confluent/aggregated condition (n = 4 biological replicates). Graph represents mean and ± SEM. Scale bar, 50 µm. Source Data
Extended Data Fig. 14
Extended Data Fig. 14. Mouse MDR2-KO hepatocyte organoids and MDR2-KO-hepatocyte periportal assembloids recapitulate aspects of cholestatic liver disease.
a. Immunofluorescence staining of WT control and MDR2-KO tissue samples showing increased areas stained for osteopontin cholangiocyte marker (OPN, magenta) and CD34 marker of portal fibroblast (green), indicative of cholangiocyte and mesenchyme expansion in this model of biliary fibrosis; nuclei (DAPI, blue) and actin cytoskeleton (Phalloidin, white) are also stained. n = 3 independent experiments. Scale bar, 100 µm. b. Immunofluorescence staining of WT control and MDR2-KO tissue samples showing increased areas stained for osteopontin cholangiocyte marker (OPN, magenta) and CD34 marker of portal fibroblast (green), nuclei (SiR-DNA, blue) and collagen (SHG, yellow). Scale bar, 50 µm. c. Left, Immunofluorescence staining of bile canaliculi (CD13, green) and F-actin (Phalloidin, grey) in Mdr2-/- liver tissue (top panel) and Mdr2-/- HepOrg (bottom panel). Note the similarity between the bile canaliculi morphology of the HepOrg and the tissue. Cyan arrowheads, apical bulkheads. Yellow arrowheads, inward blebs. Representative images from n = 2 (tissue), n = 3 (HepOrg) independent experiments are shown. Scale bar, 50 µm; zoom-in, 20 µm. Right, scheme showing bile canaliculi features of apical bulkheads. d. Immunofluorescence staining of bile canaliculi (CD13, green) and F-actin (Phalloidin, grey) in Mdr2-/- HepOrg cultures, showing emergence of hepatocyte rosettes. Representative images from n = 3 independent experiments are shown. Scale bar, 50 µm; zoom-in, 20 µm. Scheme showing bile canaliculi features of rosettes. e. Immunofluorescence staining of the interface and connection between bile canaliculi from hepatocytes and the lumen from bile duct in Mdr2-/- liver tissue (top) and assembloids (bottom). Hepatocytes (red, yellow) whose bile canaliculi (green) enter the bile duct lumen (magenta) are visualised. Interface between BC and BD in Mdr2-/- assembloid (bottom) and tissue (top) are pointed to with white arrowheads. Representative images from n = 2 biological replicates from n = 2 independent experiments are shown. Scale bar, 50 µm; zoom-in, 10 µm. f. Graph representing correlation between the initial cholangiocyte (chol) number at day 0 (d0) and day 5 (d5-d0) from n = 2 biological replicates from n = 2 independent experiments. Dots represent individual assembloids. Slopes represent simple linear regression with coloured area denoting standard error. R2 = 0,759 for Mdr2-/- portal assembloids slope p-value p < 0,0001, and R2 = 0,1423 for Mdr2 + /+ portal assembloids, p = 0,0760. Source Data

References

    1. Wells, R. G. The portal fibroblast: not just a poor man’s stellate cell. Gastroenterology147, 41–47 (2014). - PMC - PubMed
    1. Pinzani, M. & Luong, T. V. Pathogenesis of biliary fibrosis. Biochim. Biophys. Acta1864, 1279–1283 (2018). - PubMed
    1. Lancaster, M. A. & Huch, M. Disease modelling in human organoids. Dis. Model Mech.12, dmm039347 (2019). - PMC - PubMed
    1. Campana, L., Esser, H., Huch, M. & Forbes, S. Liver regeneration and inflammation: from fundamental science to clinical applications. Nat. Rev. Mol. Cell Biol.22, 608–624 (2021). - PubMed
    1. Fausto, N., Campbell, J. S. & Riehle, K. J. Liver regeneration. J. Hepatol.57, 692–694 (2012). - PubMed

MeSH terms

LinkOut - more resources