. 2025 May 29;13(1):57.
doi: 10.1038/s41413-025-00426-z.

RUNX2 is essential for maintaining synchondrosis chondrocytes and cranial base growth

Affiliations

RUNX2 is essential for maintaining synchondrosis chondrocytes and cranial base growth

Shawn A Hallett et al. Bone Res. .

Abstract

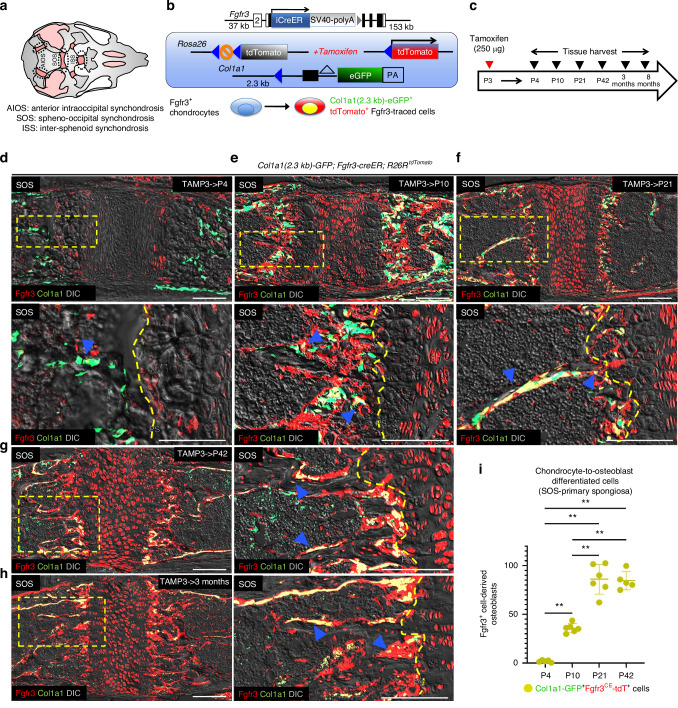
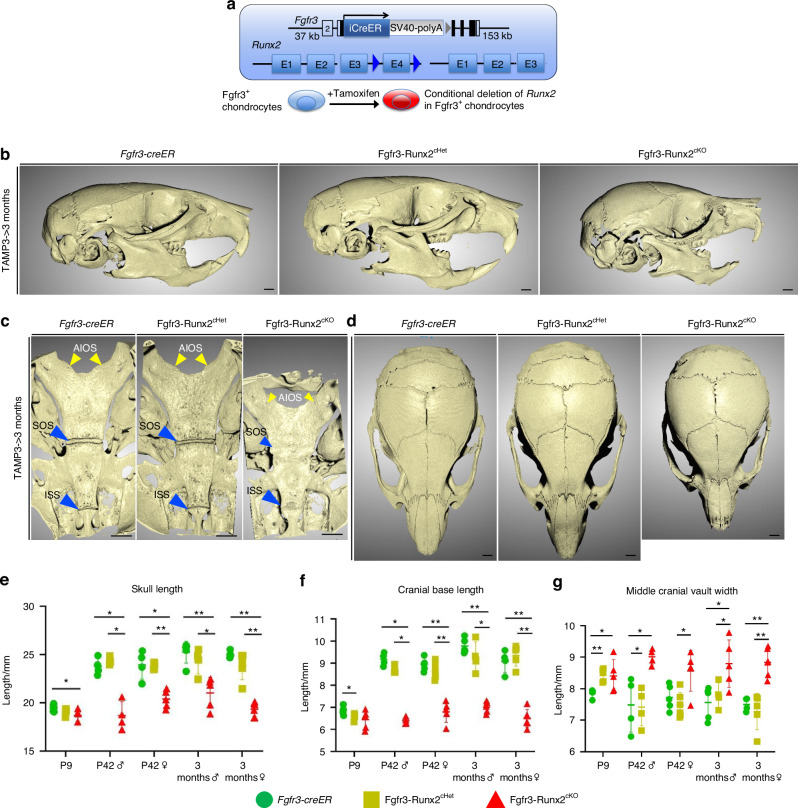
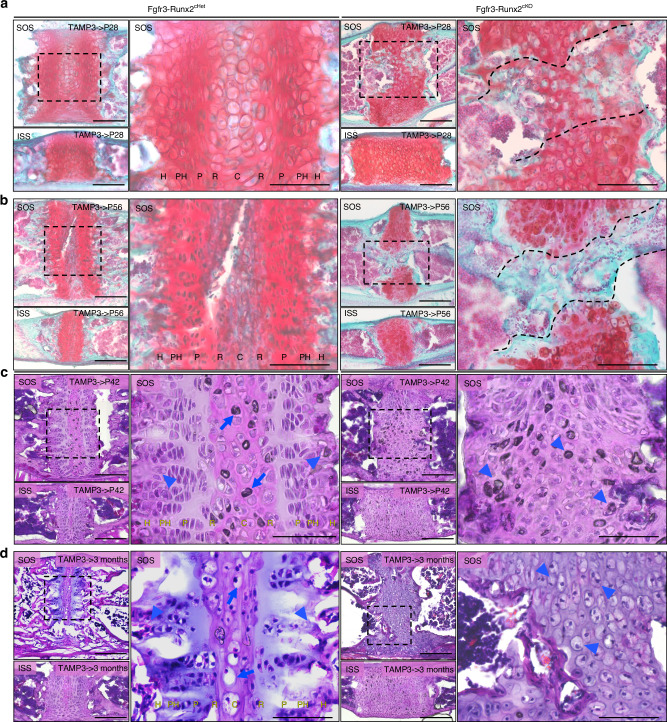
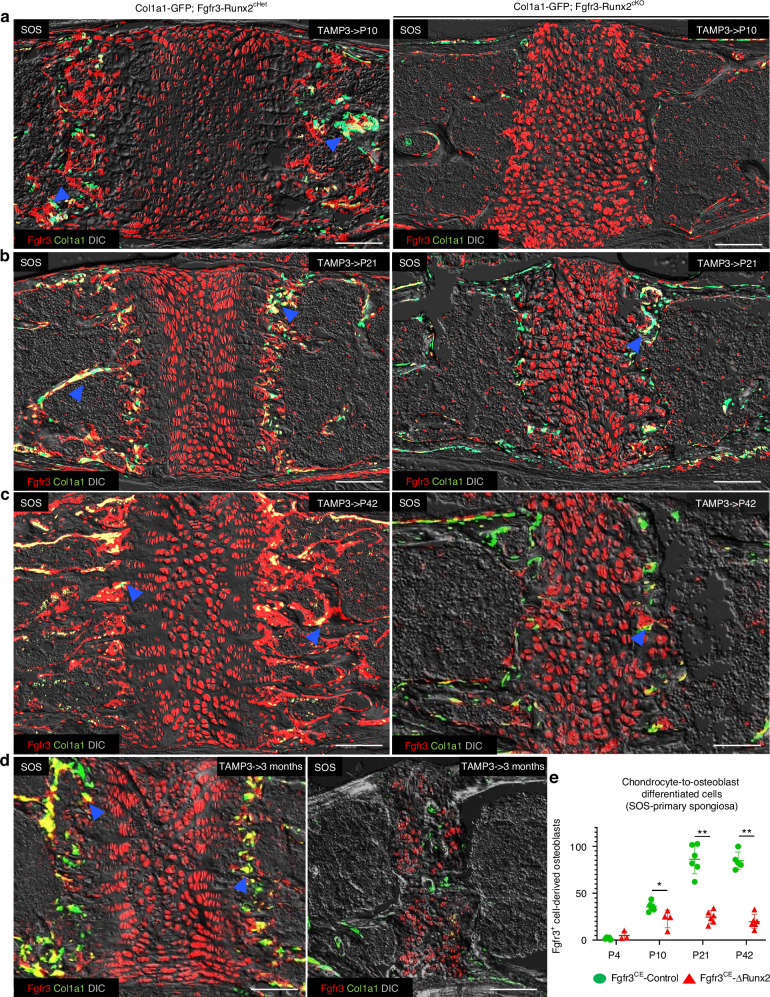
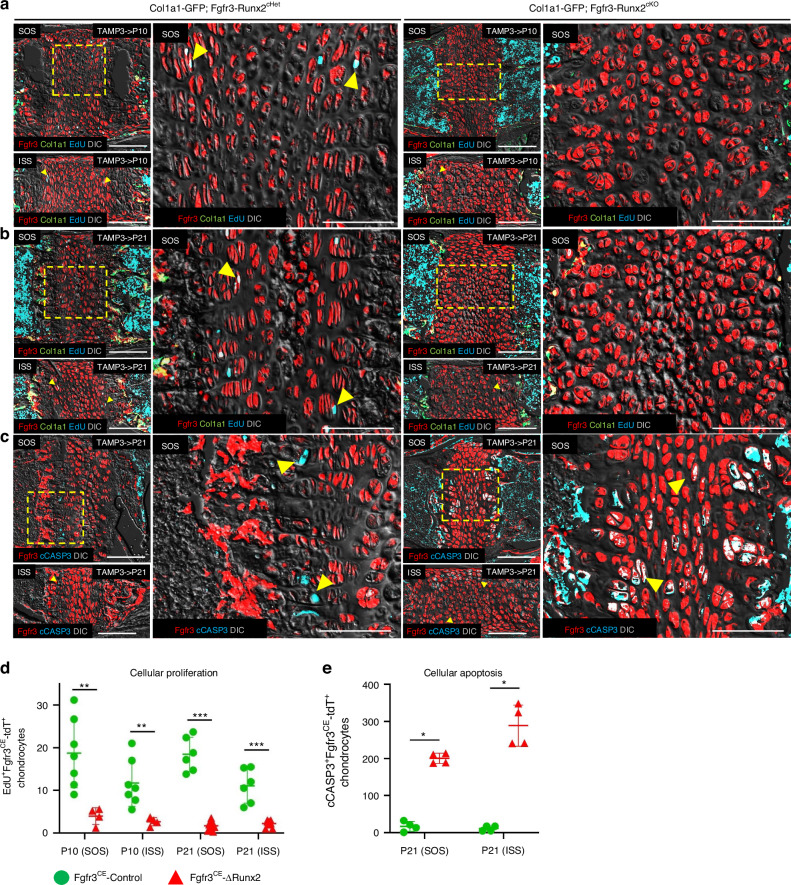
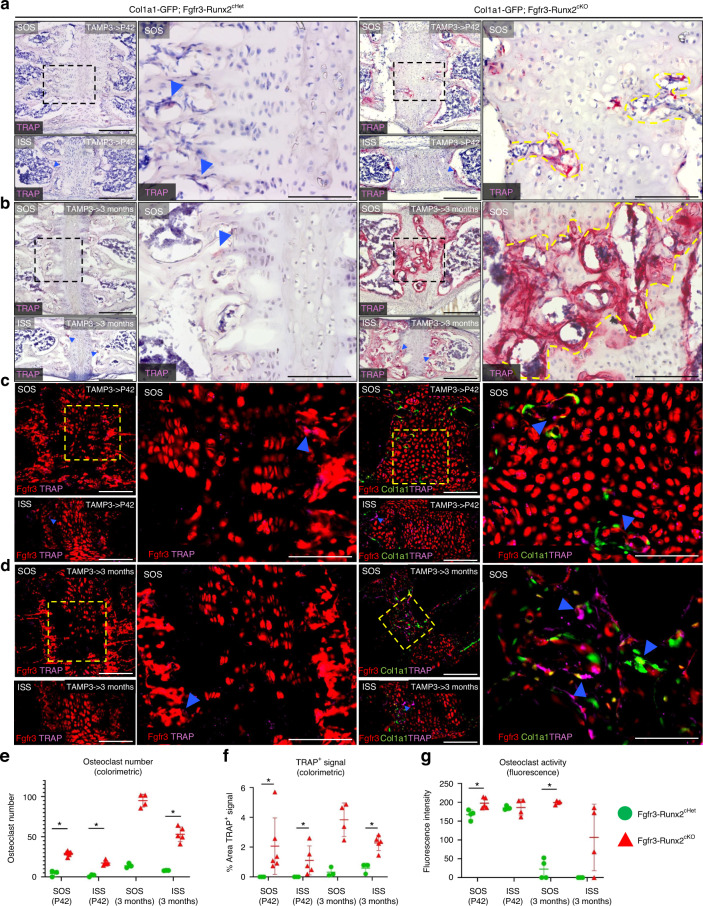
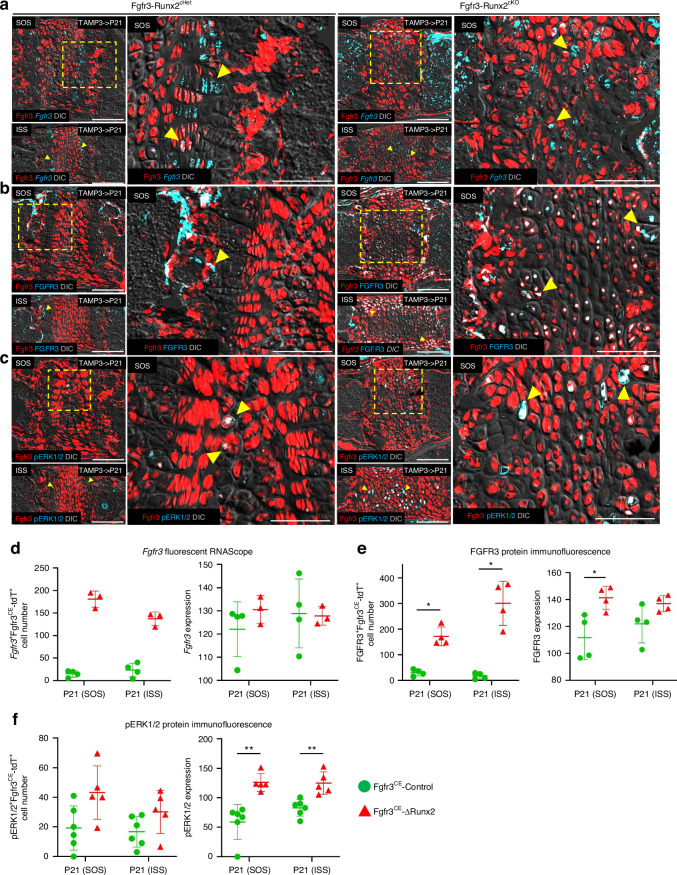
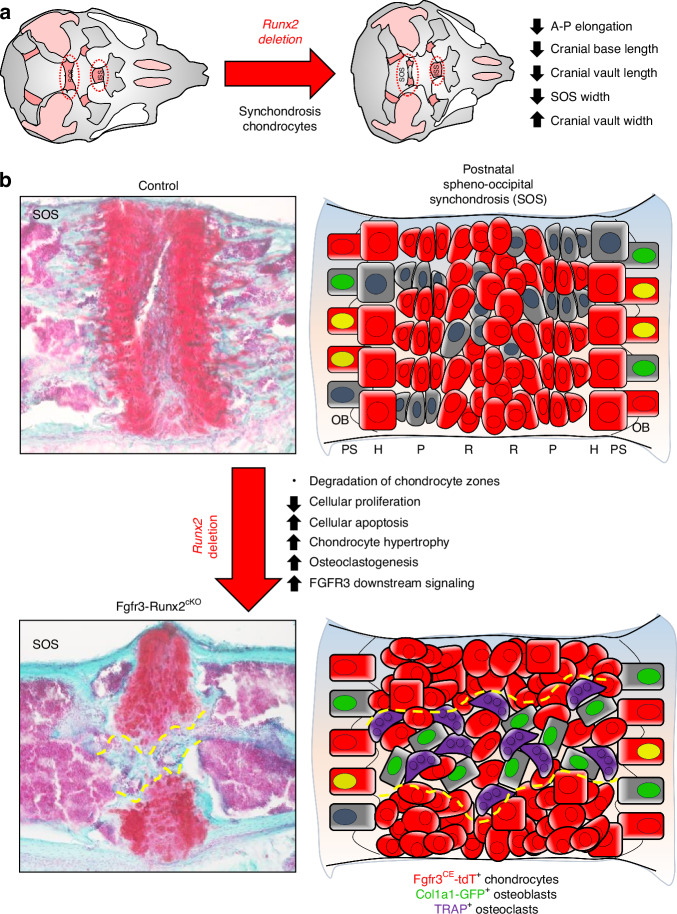
The cranial base synchondroses, comprised of opposite-facing bidirectional chondrocyte layers, drive anteroposterior cranial base growth. In humans, RUNX2 haploinsufficiency causes cleidocranial dysplasia associated with deficient midfacial growth. However, how RUNX2 regulates chondrocytes in the cranial base synchondroses remains unknown. To address this, we inactivated Runx2 in postnatal synchondrosis chondrocytes using a tamoxifen-inducible Fgfr3-creER (Fgfr3-Runx2cKO) mouse model. Fgfr3-Runx2cKO mice displayed skeletal dwarfism and reduced anteroposterior cranial base growth associated with premature synchondrosis ossification due to impaired chondrocyte proliferation, accelerated hypertrophy, apoptosis, and osteoclast-mediated cartilage resorption. Lineage tracing reveals that Runx2-deficient Fgfr3+ cells failed to differentiate into osteoblasts. Notably, Runx2-deficient chondrocytes showed an elevated level of FGFR3 and its downstream signaling components, pERK1/2 and SOX9, suggesting that RUNX2 downregulates FGFR3 in the synchondrosis. This study unveils a new role of Runx2 in cranial base chondrocytes, identifying a possible RUNX2-FGFR3-MAPK-SOX9 signaling axis that may control cranial base growth.


Conflict of interest statement

Competing interests: The authors declare no competing interests.

Figures

Fig. 1
Fig. 1
Fgfr3-creER labels chondrocytes and their precursors in postnatal cranial base synchondrosis. a Cartoon illustration of cranial base spheno-occipital synchondrosis (SOS), inter-sphenoid synchondrosis (ISS), and anterior intra-occipital synchondrosis (AIOS) housed within the craniofacial complex. Pink: cartilage, gray: bone. b Fgfr3-creER; R26R-tdTomato lineage-tracing model combined with Col1a1(2.3kb)-eGFP reporter. Single intraperitoneal injection of tamoxifen at P3 induces cre recombination, leading to the labeling of Fgfr3+ cells by tdTomato. If these cells differentiate into osteoblastic cells, they become simultaneously marked by Col1a1(2.3 kb)-eGFP. c Timeline for the lineage-tracing experiments. Tamoxifen injection (250 μg) at P3 and lineage-traced to P4, P10, P21, P42, 3 months and 8 months. Lineage-tracing of Fgfr3CE-tdT+ SOS cells at P4 (d) P10 (e) P21 (f) P42 (g) and 3 months (h). The boxed region is shown in higher magnification. Blue arrowheads represent Col1a1(2.3 kb)-GFP+ osteoblasts derived from Fgfr3CE-tdT+ chondrocytes at primary spongiosa. Red: Fgfr3CE-tdT, green: Col1a1(2.3 kb)-GFP, yellow: Col1a1(2.3 kb)-GFP+Fgfr3CE-tdT+, gray: DIC. PS: primary spongiosa. Scale bar: 100 µm. i Quantification of Col1a1(2.3 kb)-GFP+Fgfr3CE-tdT+ cells at primary spongiosa at P4 (n = 5), P10 (n = 6), P21 (n = 6) and P42 (n = 5) collected from serial sections of the SOS. **P < 0.01, Mann-Whitney’s U-test. Data are presented as mean ± s.d
Fig. 2
Fig. 2
Runx2 inactivation in Fgfr3+ cells causes craniofacial skeletal abnormalities. a Fgfr3-creER; R26R-tdTomato mice were crossed with mice carrying a runt-related transcription factor 2 (Runx2) floxed allele (flanking exon 4). Single intraperitoneal injection of tamoxifen at P3 induces cre recombination, leading to heterozygous or homozygous knockout of Runx2 in Fgfr3+ chondrocytes [Fgfr3-creER; Runx2fl/+ (Fgfr3-Runx2cHet)/Fgfr3-creER; Runx2fl/fl (Fgfr3-Runx2cKO)]. 3D renderings of Control (Fgfr3-creER), Fgfr3-Runx2cHet, and Fgfr3-Runx2cKO mice at 3 months indicate decreased anteroposterior growth of entire craniofacial complex (b), premature ossification of the synchondroses (c), and widened cranial vaults (d) in Fgfr3-Runx2cKO animals. Quantification of skull length (e), cranial base length (f), and middle cranial vault width (g) at P9 [Control (n = 6)], Fgfr3-Runx2cHet (n = 5), Fgfr3-Runx2cKO (n = 5), P42 [male-Control (n = 4), Fgfr3-Runx2cHet (n = 4), Fgfr3-Runx2cKO (n = 4); female-Control (n = 5), Fgfr3-Runx2cHet (n = 6), Fgfr3-Runx2cKO (n = 5)] and 3 months [male-Control (n = 5), Fgfr3-Runx2cHet (n = 4), Fgfr3-Runx2cKO (n = 5); female-Control (n = 4), Fgfr3-Runx2cHet (n = 5), Fgfr3-Runx2cKO (n = 6)]. *P < 0.05, **P < 0.01, Mann-Whitney’s U-test. Data are presented as mean ± s.d. Scale bar = 1 mm
Fig. 3
Fig. 3
Runx2 inactivation in Fgfr3+ cells disrupts cell organization of the synchondrosis. Fgfr3-Runx2cHet and Fgfr3-Runx2cKO mice were injected with a single dose of tamoxifen once at P3 and euthanized at P28 (a) and P56 (b). Safranin-O staining revealed organized chondrocyte layers in Fgfr3-Runx2cHet mice. Boxed regions show higher magnification. Fgfr3-Runx2cKO mice displayed a progressive fusion of the central portion of the SOS (a, b right magnified panels) while the ISS was widened. Black dashed lines highlight the fusion defect. Fgfr3-Runx2cHet and Fgfr3-Runx2cKO mice were injected with tamoxifen once at P3 and euthanized at P42 (c) and 3 months (d). Hematoxylin and eosin staining revealed organized chondrocyte layers in Fgfr3-Runx2cHet mice, showing higher magnification in boxed regions. Fgfr3-Runx2cKO mice displayed bone formation areas throughout the SOS’s central portion (c, d right panels). Arrows and arrowheads indicate hypertrophic-like cells in the central and hypertrophic zones of SOS, respectively (c, d left magnified panels) and areas of chondrocyte disorganization in the Fgfr3-Runx2cKO SOS (c, d right magnified panels). C central zone, R resting zone, P proliferating zone, PH pre-hypertrophic zone, H hypertrophic zone. Scale bar = 100 µm
Fig. 4
Fig. 4
Runx2 inactivation impairs osteoblast differentiation of Fgfr3+ cells in the synchondrosis. Lineage-tracing of Col1a1(2.3 kb)-GFP+Fgfr3CE-tdT+ SOS cells in Fgfr3-Runx2cHet and Fgfr3-Runx2cKO mice following tamoxifen injection at P3 and lineage-traced to P10 (a) P21 (b) P42 (c) and 3 months (d). Blue arrowheads indicate Col1a1(2.3 kb)-GFP+Fgfr3CE-tdT+ differentiated cells at the primary spongiosa. Red: Fgfr3CE-tdT, green: Col1a1(2.3 kb)-GFP, yellow: Col1a1(2.3 kb)-GFP+Fgfr3CE-tdT+, gray: DIC. Scale bar: 100 µm. e Quantification of Col1a1(2.3 kb)-GFP+Fgfr3CE-tdT+ cells at primary spongiosa at P4 (Fgfr3CE-Control n = 5, Fgfr3CE-∆Runx2 n = 3), P10 (Fgfr3CE-Control n = 6, Fgfr3CE-∆Runx2 n = 4), P21 (Fgfr3CE-Control nn = 6, Fgfr3CE-∆Runx2 n = 6) and P42 (Fgfr3CE-Control n = 5, Fgfr3CE-∆Runx2 n = 6) collected from serial sections of SOS at all time points. *P < 0.05, **P < 0.01, Mann-Whitney’s U-test. Data are presented as mean ± s.d
Fig. 5
Fig. 5
Runx2 inactivation impairs proliferation and promotes apoptosis of synchondrosis chondrocytes. Fgfr3-Runx2cHet and Fgfr3-Runx2cKO mice were injected with tamoxifen at P3 and lineage-traced to P10 (a) and P21 (b). Mice were injected with EdU 3 h prior to euthanasia. Boxed regions show higher magnification. EdU+ Fgfr3CE-Control+ cells are present in the proliferating zone of Fgfr3-Runx2cHet synchondroses at P10 and P21 (a, b left magnified panels, arrowheads). EdU+ cells populate Fgfr3CE-tdT bone marrow stromal cells throughout the primary spongiosa but do not label Fgfr3CE-∆Runx2+ synchondrosis chondrocytes (a, b right magnified panels). Red: Fgfr3CE-tdT, green: Col1a1(2.3 kb)-GFP, yellow: Col1a1(2.3 kb)-GFP; Fgfr3CE-tdT, blue: EdU, gray: DIC. c Fgfr3-Runx2cHet and Fgfr3-Runx2cKO mice were injected with tamoxifen at P3 and lineage-traced to P21. Synchondroses were stained with cCASP3. Boxed regions show higher magnification. cCASP3+Fgfr3CE-Control+ hypertrophic chondrocytes sparsely label Fgfr3-Runx2cHet synchondroses (c left magnified panels, arrowheads). cCASP3+Fgfr3CE-∆Runx2+ robustly label all Fgfr3-Runx2cKO synchondrosis chondrocytes (c, right magnified panels, arrowheads). Red: Fgfr3CE-tdT, green: Col1a1(2.3 kb)-GFP, yellow: Col1a1(2.3 kb)-GFP+Fgfr3CE-tdT+, blue: cCASP3, gray: DIC. Scale bar: 100 µm. d Quantification of EdU+Fgfr3CE-tdT+ chondrocytes at P10 (Fgfr3CE-Control n = 7, Fgfr3CE-∆Runx2 n = 5) and P21 [Fgfr3CE-Control n = 6, Fgfr3CE-∆Runx2 n = 9 (SOS)/n = 7 (ISS)]. **P < 0.01, ***P < 0.001, Mann-Whitney’s U-test. Data are presented as mean ± s.d. e Quantification of cCASP3+Fgfr3CE-tdT+ synchondrosis chondrocytes at P21 (Fgfr3CE-Control n = 4, Fgfr3CE-∆Runx2 n = 4). *P < 0.05, Mann-Whitney’s U-test. Data are presented as mean ± s.d
Fig. 6
Fig. 6
Runx2 inactivation causes precocious hypertrophy of synchondrosis chondrocytes. Fgfr3-Runx2cHet and Fgfr3-Runx2cKO mice were injected with tamoxifen at P3 and lineage-traced to P10 (a) and P21 (b). Synchondroses were stained with COLX. Boxed regions show higher magnification. COLX+Fgfr3CE-Control+ cells sparsely label Fgfr3-Runx2cHet hypertrophic chondrocytes (a, b left magnified panels, arrowheads). COLX+Fgfr3CE-∆Runx2+ synchondrosis chondrocytes robustly label Fgfr3-Runx2cKO synchondroses (a, b, right magnified panels, arrowheads). Red: Fgfr3CE-tdT, blue: COLX, gray: DIC. Scale bar: 100 µm. c Fgfr3-Runx2cHet and Fgfr3-Runx2cKO mice were injected with tamoxifen at P3 and lineage-traced to P10 (a) and P21 (b). Synchondroses were stained with Rankl. Boxed regions show higher magnification. Rankl+Fgfr3CE-Control+ cells sparsely label Fgfr3-Runx2cHet hypertrophic chondrocytes (a, b left magnified panels, arrowheads). Rankl+Fgfr3CE-∆Runx2+ synchondrosis chondrocytes robustly label Fgfr3-Runx2cKO synchondroses (a, b right magnified panels, arrowheads). Red: Fgfr3-CEtdT, blue: Rankl, gray: DIC. Scale bar: 100 µm. d Quantification of COLX+Fgfr3CE-tdT+ synchondrosis chondrocytes at P10 (Fgfr3CE-Control n = 4, Fgfr3CE-∆Runx2 n = 4) and P21 (Fgfr3CE-Control n = 4, Fgfr3CE-∆Runx2 n = 4). *P < 0.05, Mann-Whitney’s U-test. Data are presented as mean ± s.d. e Quantification of Rankl+Fgfr3CE-tdT+ synchondrosis chondrocytes (left graph, Fgfr3CE-Control n = 4, Fgfr3CE-∆Runx2 n = 3) and % area Rankl+ signal (right graph, Fgfr3CE-Control n = 4, Fgfr3CE-∆Runx2 n = 3) at P21. *P < 0.05, Mann-Whitney’s U-test. Data are presented as mean ± s.d
Fig. 7
Fig. 7
Osteoclast-driven degradation of Fgfr3-Runx2cKO synchondroses. Fgfr3-Runx2cHet and Fgfr3-Runx2cKO mice were injected with tamoxifen at P3 and lineage-traced to P42 (a) and 3 months (b). Synchondroses were stained with tartrate-resistant acid phosphatase (TRAP). Boxed regions show higher magnification. TRAP+ osteoclasts sparsely label the primary spongiosa at P42 and 3 months in Fgfr3-Runx2cHet synchondroses (a, b left magnified panels, arrowheads). TRAP+ signal envelopes the entire fusion defect in the SOS of Fgfr3-Runx2cKO animals (a, b right magnified panels, yellow dashed lines). Fgfr3-Runx2cHet and Fgfr3-Runx2cKO mice were injected with tamoxifen at P3 and lineage-traced to P42 (c) and 3 months (d). Synchondroses were stained with fluorescent TRAP (ELF97). Boxed regions show higher magnification. TRAP+ osteoclasts sparsely label the primary spongiosa at P42 and 3 months in Fgfr3-Runx2cHet synchondroses (c, d left magnified panels, arrowheads). In the SOS of Fgfr3-Runx2cKO mice, Col1a1(2.3 kb)-GFP+, Fgfr3CE-tdT+, TRAP+ cells independently label the fusion defect (c, d right magnified panels, arrowheads). Red: Fgfr3CE-tdT, green: Col1a1(2.3 kb)-GFP, purple: TRAP. Scale bar: 100 µm. Quantification of colorimetric TRAP+ osteoclasts (e) and % area TRAP+ signal (f) at P42 [Fgfr3-Runx2cHet n = 3, Fgfr3-Runx2cKO n = 6 (SOS)/n = 5 (ISS)] and 3 months [Fgfr3-Runx2cHet n = 3, Fgfr3-Runx2cKO n = 4 (SOS)/n = 5 (ISS)]. *P < 0.05, Mann-Whitney’s U-test. Data are presented as mean ± s.d. g Quantification of fluorescent TRAP+ osteoclasts at P42 [Fgfr3-Runx2cHet n = 4, Fgfr3-Runx2cKO n = 5 (SOS)/n = 4 (ISS)] and 3 months [Fgfr3-Runx2cHet n = 4 (SOS)/n = 3 (ISS), Fgfr3-Runx2cKO n = 4 (SOS)/n = 4 (ISS)]. *P < 0.05, Mann-Whitney’s U-test. Data are presented as mean ± s.d
Fig. 8
Fig. 8
RUNX2-FGFR3-MAPK-SOX9 signaling controls postnatal cranial base development. Fgfr3-Runx2cHet and Fgfr3-Runx2cKO mice were injected with tamoxifen at P3 and lineage-traced to P21. Synchondroses were stained with Fgfr3 (a) and FGFR3 (b). Boxed regions show higher magnification. Fgfr3+Fgfr3CE-Control+ and FGFR3+Fgfr3CE-Control+ expression is localized to proliferating and pre-hypertrophic chondrocytes, respectively, in Fgfr3-Runx2cHet synchondroses (a, b, left magnified panels, arrowheads). Fgfr3+Fgfr3CE-∆Runx2+ cells are distributed randomly throughout Runx2cKO synchondroses (a, right magnified panels, arrowheads). FGFR3+Fgfr3CE-∆Runx2 chondrocytes robustly label chondrocyte layers in Fgfr3-Runx2cKO synchondroses (b, right magnified panels, arrowheads). Red: Fgfr3CE-tdT, blue: Fgfr3 (a) or FGFR3 (b), gray: DIC. Scale bar: 100 µm. c Fgfr3-Runx2cHet and Fgfr3-Runx2cKO mice were injected with tamoxifen at P3 and lineage-traced to P21. Synchondroses were stained with pERK1/2. Boxed regions show higher magnification. pERK1/2+Fgfr3CE-Control+ cells sparsely label Fgfr3-Runx2cHet hypertrophic-like chondrocytes at low levels (c, left magnified panels, arrowheads). pERK1/2+Fgfr3CE-∆Runx2+ synchondrosis chondrocytes label Fgfr3-Runx2cKO synchondroses at greater numbers and increased fluorescence intensities (a, b, right magnified panels, arrowheads). Red: Fgfr3CE-tdT, blue: pERK1/2, gray: DIC. Scale bar: 100 µm. d Quantification of Fgfr3+Fgfr3CE-tdT+ synchondrosis chondrocytes (left graph) and Fgfr3+ fluorescence intensity (right graph) at P21 (Fgfr3CE-Control n = 4, Fgfr3CE-∆Runx2 n = 3). Mann-Whitney’s U-test. Data are presented as mean ± s.d. e Quantification of FGFR3+Fgfr3CE-tdT+ synchondrosis chondrocytes (left graph) and FGFR3+ fluorescence intensity (right graph) at P21 (Fgfr3CE-Control n = 4, Fgfr3CE-∆Runx2 n = 4). *P < 0.05, Mann-Whitney’s U-test. Data are presented as mean ± s.d. f Quantification of pERK1/2+Fgfr3CE-tdT+ synchondrosis chondrocytes (left graph) and pERK1/2+ fluorescence intensity (right graph) at P21 (Fgfr3CE-Control n = 6, Fgfr3CE-∆Runx2 n = 5). **P < 0.01, Mann-Whitney’s U-test. Data are presented as mean ± s.d
Fig. 9
Fig. 9
RUNX2 is a critical regulator of cranial base synchondrosis organization, maintenance, and fusion. a Postnatal Runx2 deletion causes aberrant development of the craniofacial complex, leading to reductions in anteroposterior elongation, cranial base and vault lengths, and skull width. b Runx2 deletion in synchondrosis chondrocytes causes degradation and premature ossification of the postnatal cranial base synchondroses via reduced cell proliferation, increased chondrocyte hypertrophy and death, osteoclastogenesis associated with localized angiogenesis and FGFR3 downstream signaling, leading to aberrant endochondral ossification and gross craniofacial structural deficiencies

References

    1. Venugopalan, S. R. & Van Otterloo, E. The skull’s girder: a brief review of the cranial base. J. Dev. Biol.9, 3 (2021). - PMC - PubMed
    1. Cendekiawan, T., Wong, R. W. K. & Rabie, A. B. M. Relationships between cranial base synchondroses and craniofacial development: a review. Open Anat. J.2, 67–75 (2010).
    1. Petrovic, A. & Charlier, J. P. The spheno-occipital synchondrosis of the young rat in organ culture: demonstration of a potential of independent growth. C. R. Acad. Hebd. Seances Acad. Sci. D.265, 1511–1513 (1967). - PubMed
    1. Servoss, J. M. An in vivo and in vitro autoradiographic investigation of growth in synchondrosal cartilage. Am. J. Anat.136, 479–485 (1973). - PubMed
    1. Kuroda, T., Miura, F., Nakamura, T. & Noguchi, K. Cellular kinetics of synchondrosal cartilage in organ culture. Proc. Finn. Dent. Soc.77, 89 (1981). - PubMed

Substances

LinkOut - more resources