. 2025 May 30;16(1):5007.
doi: 10.1038/s41467-025-60028-5.

Single-cell and spatial transcriptome analyses reveal tumor heterogeneity and immune remodeling involved in pituitary neuroendocrine tumor progression

Affiliations

Single-cell and spatial transcriptome analyses reveal tumor heterogeneity and immune remodeling involved in pituitary neuroendocrine tumor progression

Wan Su et al. Nat Commun. .

Abstract

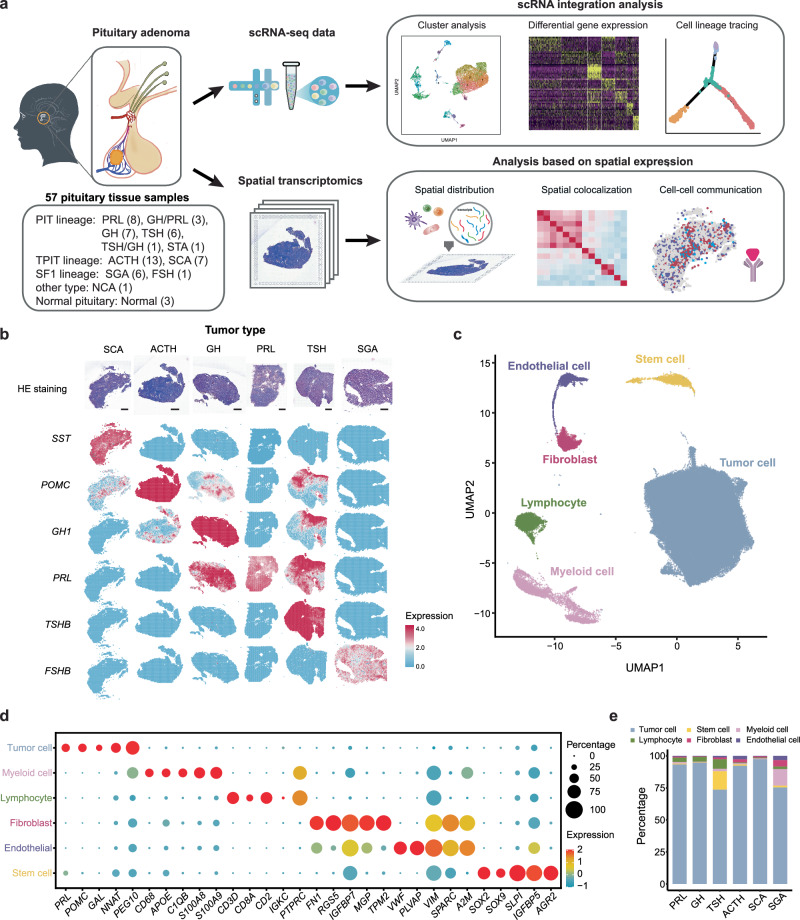
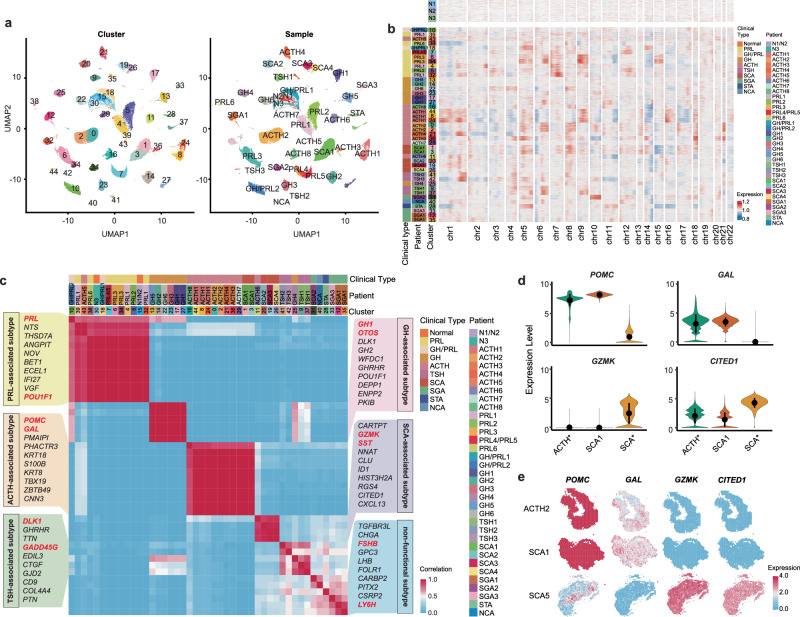
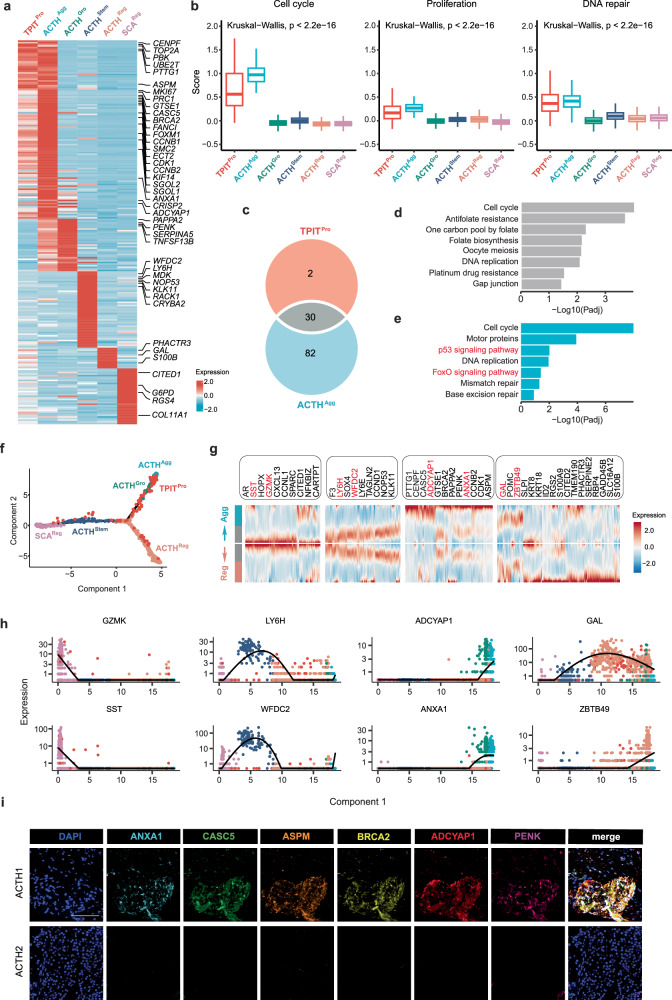
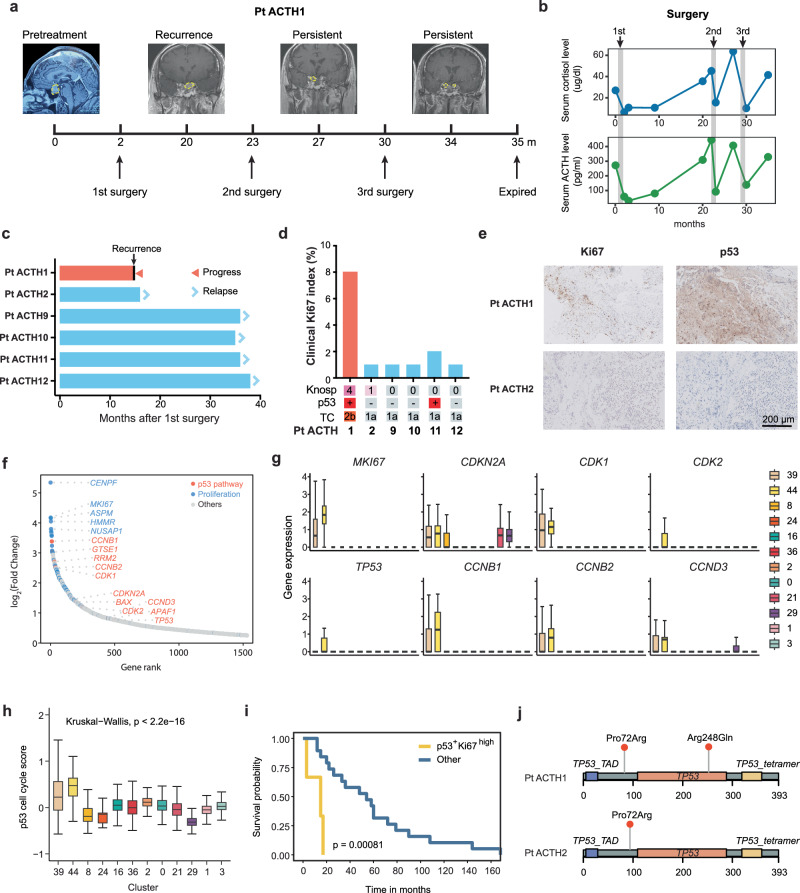
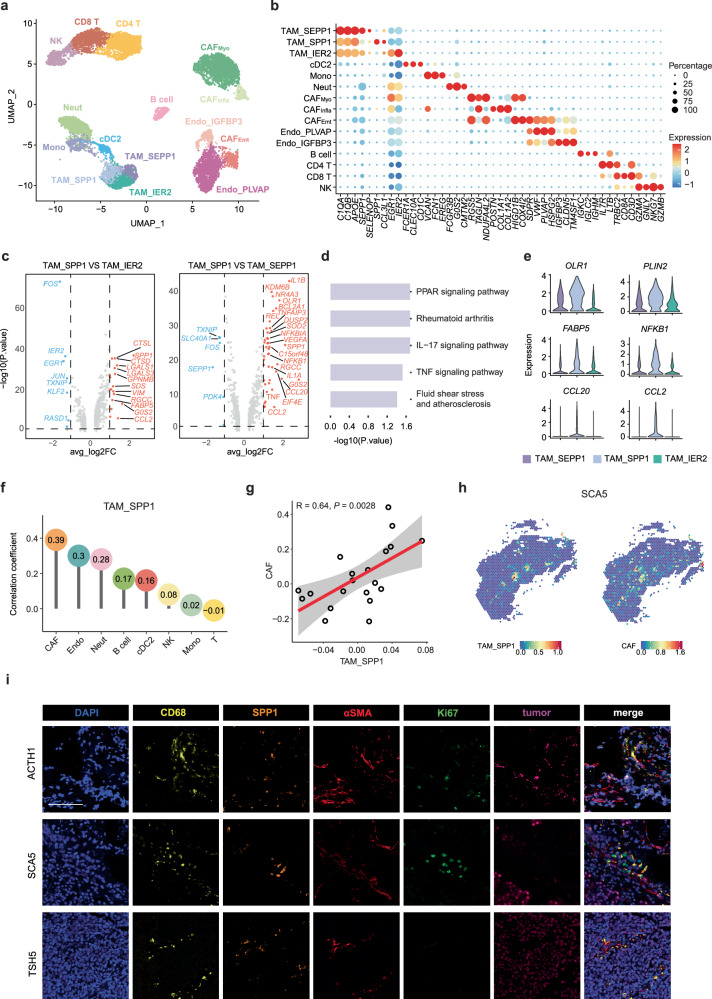
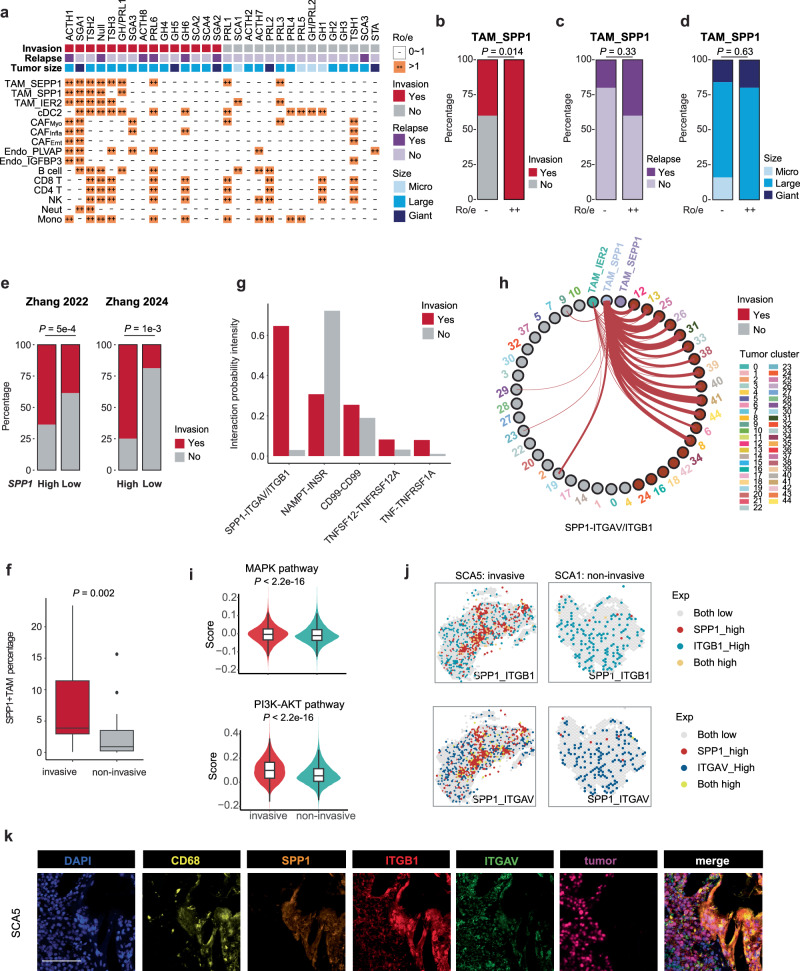
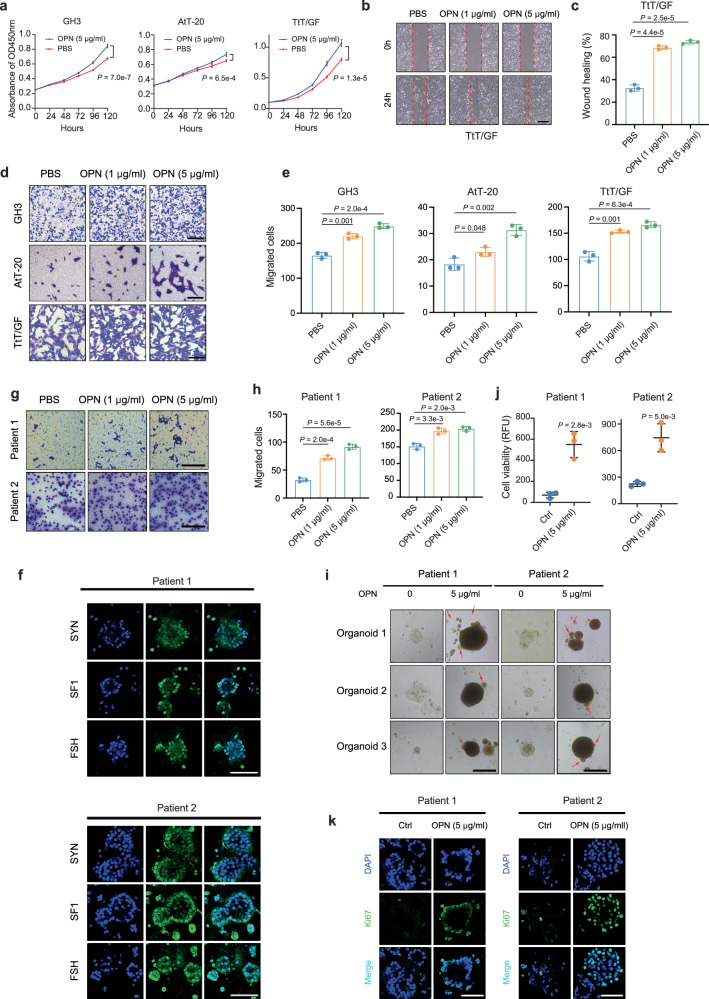
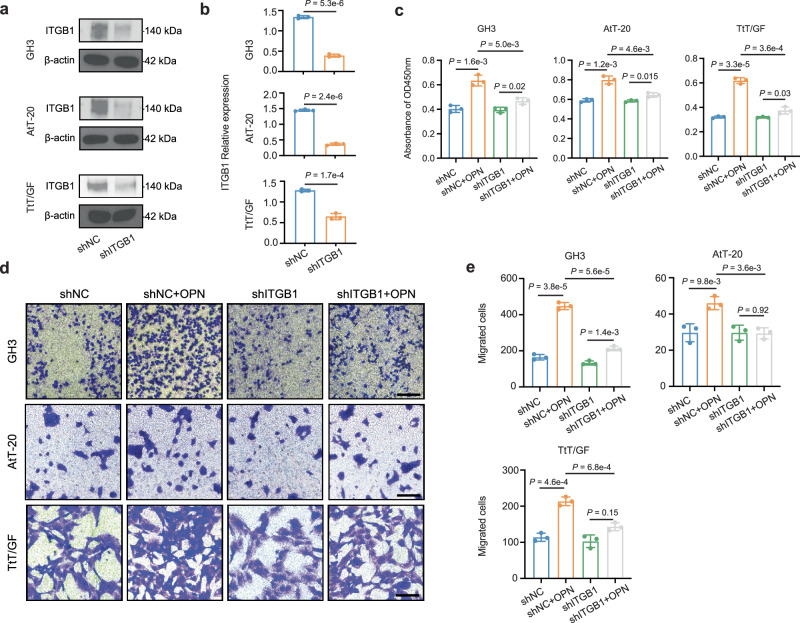
Pituitary neuroendocrine tumors (PitNETs) can be invasive or aggressive, yet the mechanisms behind these behaviors remain poorly understood, impeding treatment advancements. Here, we integrat single-cell RNA sequencing and spatial transcriptomics, analyzing over 177,000 cells and 35,000 spots across 57 tissue samples. This comprehensive approach facilitates the identification of PitNETs tumor populations and characterizes the reconfiguration of the tumor microenvironment (TME) as PitNETs progress and invade. We trace the trajectory of TPIT-lineage PitNETs and identify an aggressive tumor cluster marked by elevated p53-mediated proliferation and a higher Trouillas classification, both associated with tumor progression. Additionally, we document the heterogeneity of immune stromal cells within PitNETs, particularly noting the enrichment of SPP1+ tumor associated macrophages (TAMs) in invasive tumors. These TAMs facilitate tumor invasion through the SPP1-ITGAV/ITGB1 signaling pathway. Our in-depth single-cell and spatial analysis of PitNETs uncovers the molecular dynamics within the TME, suggesting potential targets for therapeutic intervention.


Conflict of interest statement

Competing interests: The authors declare no competing interests.

Figures

Fig. 1
Fig. 1. Single-cell transcriptome and spatial profiling of PitNETs.
a Overview of the study design depicted schematically. Created in BioRender. su, w. (2025) https://BioRender.com/7d5vpht. b H&E staining alongside visualization of single-cell spatial distribution of marker genes in PitNET. Scale bars, 1 mm. c UMAP plot illustrating the distinct cell clusters identified by scRNA-seq (n = 172,510 cells from 37 samples). d Bubble heatmap showing the marker genes for each cell cluster identified through scRNA-seq. e Stacked bar plot representing the proportions of major cell populations across different tumor subtypes. Source data are provided as a Source Data file for (d).
Fig. 2
Fig. 2. Tumor-associated signatures of PitNETs at single-cell resolution.
a UMAP plot showing the distribution of pituitary tumor and normal cell populations (n = 160,243 cells from 37 samples). b Heatmap of copy number variations (CNVs) in single pituitary cells from normal (top) and tumor (bottom) tissues, inferred from scRNA-seq data. c Heatmap depicting Pearson correlation among PitNET tumor clusters (n = 160,243 cells), with color intensity representing correlation strength. d Violin plot displaying gene expression profiles for regular ACTH adenomas (ACTH*,including ACTH1, ACTH2, ACTH3, ACTH4, ACTH7, ACTH8), SCA1 and regular SCAs (SCA*,including SCA2, SCA3, SCA4). Data are presented as mean values +/- SD. e Spatial gene expression patterns in ACTH2 (a regular ACTH adenoma), SCA1, and SCA5 (a regular SCA tumor). Source data are provided as a Source Data file for (c).
Fig. 3
Fig. 3. Characterization of tumor cells in TPIT samples.
a Heatmap displaying specific gene expression profiles across six TPIT tumor subtypes. b Boxplots illustrating cell cycle (left), proliferation (middle), and DNA repair (right) scores for each TPIT tumor subtype. Boxes span the interquartile range (IQR) and whiskers extend to points that lie within 1.5 IQRs of the lower and upper quartile. Center line is drawn at the median. Statistical analysis was performed using the two-sided Kruskal–Wallis test. For (a) and (b) a total of 70,196 cells from 12 samples were analyzed across six groups: TPITPro (n = 378), ACTHAgg (n = 217), ACTHGro (n = 7,725), ACTHStem (n = 3,789), ACTHReg (n = 44,079), and SCAReg (n = 14,008). c Venn diagram showing the overlap of marker genes between TPITPro and ACTHAgg groups. d KEGG pathway enrichment analysis of common genes shared by TPITPro and ACTHAgg groups. One-sided Fisher’s exact test. e KEGG pathway enrichment analysis of genes specific to ACTHAgg group. One-sided Fisher’s exact test. f Developmental trajectory of TPIT tumor cells as inferred by Monocle2, with each dot representing a cell. g Branched heatmap showing significant gene expression changes over pseudotime, with genes indicated on top. h Gene expression trends for selected genes along the trajectory. i Representative multiplex immunofluorescence staining of ACTH1 (aggressive ACTH tumor) and ACTH2 (non-aggressive ACTH tumor), each with 3 technical replicates. Individual and merged channels are shown for DAPI, ANXA1, CASC5, ASPM, BRCA2, ADCYAP1, and PENK. Scale bar, 100 µm. Source data are provided as a Source Data file for (b) and (c).
Fig. 4
Fig. 4. Clinical and molecular features of aggressive ACTH tumors.
a Timeline of diagnosis, treatment, recurrence, and persistence for patient ACTH1, with MRI images at key points and tumor borders outlined in yellow dashed lines. b Serum cortisol and ACTH levels during the treatment of patient ACTH1. c, Bar plot of recurrence time after initial surgery for ACTH patients. d Bar plot of Ki67 index, Knosp grade, p53 IHC staining, and Trouillas classification (TC) in ACTH patients. e IHC staining of Ki67 and p53 in tissue sections from patients ACTH1 and ACTH2 (n = 3 technical replicates for each patient). f Gene-rank plot of marker genes in cluster 44, with p53 pathway genes in red and proliferation-related genes in blue. g Expression of cell cycle-related p53 pathway genes across clusters. Boxes span the interquartile range (IQR) and whiskers extend to points that lie within 1.5 IQRs of the lower and upper quartile. Center line is drawn at the median. h Boxplot of p53-associated cell cycle scores by cluster, using the Kruskal–Wallis test. Boxes span the interquartile range (IQR) and whiskers extend to points that lie within 1.5 IQRs of the lower and upper quartile. Center line is drawn at the median. For (g, h) a total of 54,607 cells were analyzed across 12 clusters: 0 (n = 11,109), 1 (n = 9,127), 3 (n = 8,674), 8 (n = 5,033), 11 (n = 4,455), 16 (n = 3,789),21 (n = 3,021), 24 (n = 2,692),29 (n = 2,291), 36 (n = 851), 39 (n = 378), and 44 (n = 217). i Kaplan-Meier progression-free survival curves for 18 patients with tumor recurrence, stratified by p53 staining and Ki67 index, analyzed by log-rank test. j Lollipop plot showing TP53 mutation sites in patients ACTH1 and ACTH2. Source data are provided as a Source Data file for (h) and (i).
Fig. 5
Fig. 5. Single-cell tumor immune microenvironment in PitNETs.
a UMAP plot showing the distribution of tumor immune microenvironment in PitNETs, colored by their cell types (n = 12,267 cells from 37 samples). b Bubble heatmap showing marker genes across 15 cell clusters through scRNA-seq (n = 12,267 cells from 37 samples). c Volcano plot showing differentially expressed genes between TAM_SPP1 versus TAM_IER2 (left), and TAM_SPP1 versus TAM_SEPP1 (right). A total of 1,367 TAMs were analyzed, including TAM_SEPP1 (n = 269 cells), TAM_SPP1 (n = 456 cells), and TAM_IER2 (n = 642 cells). Two-sided unpaired limma moderated t-test. d The pathway enrichment analysis of upregulated genes by TAM_SPP1. One-sided Fisher’s exact test. e Violin plot showing upregulated genes of TAM_SPP1 in TAM clusters. f Lollipop plot showing the spatial correlation coefficient between TAM_SPP1 cluster score and other dominant immune cell cluster scores (n = 35,347 spots from 20 samples). Spearman-correlation test. g Scatter plot showing the correlation between the infiltration of TAM_SPP1 and CAFs based on the average GSVA scores for each spatial transcriptomic (ST) sample (n = 20). Each circle represents one ST sample. The error band indicates a 95% confidence interval, the mean was used as the center for the error bars. Two-sided spearman-correlation test. h Spatial feature plots of signature score of TAM_SPP1 and CAFs in tissue sections. i Representative multiplex immunofluorescence staining of human PitNET tumors. DAPI (blue), CD68 (yellow), SPP1 (orange), αSMA (red), Ki67 (green), and tumor markers ACTH (ACTH1), TPIT (SCA5), and PIT-1 (TSH5) (magenta) are shown in individual and merged channels. Experiment was performed in three independent patients, each with three technical replicates. Scale bar, 100 µm. Source data are provided as a Source Data file for (c) and (e).
Fig. 6
Fig. 6. SPP1 + TAM and tumor invasiveness in PitNETs.
a Prevalence of each immune stroma cluster, estimated by Ro/e score. b−d Proportions of patients with different invasion (b), relapse (c) and size (d) statuses comparing TAM_SPP1-enriched (n = 5) versus TAM_SPP1-depleted (n = 25) groups. P-values were determined by two-sided chi-square test. e Patient proportions with varying invasion statuses, using bulk sequencing data from Zhang 2022 (n = 80 (SPP1 high) and 114 (SPP1 low)) and Zhang 2024 (n = 16 (SPP1 high) and 16 (SPP1 low)). p-values calculated by two-sided chi-square test. f Bar plot showing the proportion of SPP1+ TAMs in invasive (n = 14) and non-invasive (n = 33) PitNETs, as determined by multiplex immunofluorescence staining data. p-value was calculated using the two-sided wilcoxon signed-rank test. Boxes span the interquartile range (IQR) and whiskers extend to points that lie within 1.5 IQRs of the lower and upper quartile. Center line is drawn at the median. g Bar plot of top 5 ligand-receptor pairs with the highest interaction probabilities between invasive and noninvasive PitNETs. h Chord diagrams illustrating interactions between TAM subtypes and tumor clusters via SPP1-ITGAV/ITGB1 ligand-receptor pair, with line width indicating interaction intensity. i Signature scores of MAPK pathways (top) and PI3K-AKT pathways (bottom) for invasive (n = 44,607 cells) and non-invasive (n = 103,032 cells) tumor clusters. p-values were determined using the two-sided wilcoxon signed-rank test. Boxes span the interquartile range (IQR) and whiskers extend to points that lie within 1.5 IQRs of the lower and upper quartile. Center line is drawn at the median. j Spatial gene expression patterns of SPP1, ITGAV, and ITGB1 in samples SCA5 (invasive tumor) and SCA1 (non-invasive tumor). k Representative multiplex immunofluorescence staining of human PitNET tissue. DAPI (blue), CD68 (yellow), SPP1 (orange), ITGB1 (red), ITGAV (green), and tumor marker TPIT (magenta) are shown in individual and merged channels (n = 3 biological replicates). Scela bar, 100 µm. Source data are provided as a Source Data file for (ai).
Fig. 7
Fig. 7. SPP1 (Osteopontin, OPN) promotes proliferation and invasion of pituitary tumor cells.
a CCK-8 cell viability assay of GH3, AtT-20, and TtT/GF cells treated with OPN or PBS (n = 5 biological replicates). Data are presented as mean values +/- SD. b Representative images of the wound healing assay, and (c) quantitative analysis of TtT/GF cells treated with OPN or PBS (n = 3 biological replicates). Data are presented as mean values +/- SD. d Transwell invasion assay and (e) quantitative analysis of GH3, AtT-20, and TtT/GF cells treated with OPN or PBS (n = 3 biological replicates). Data are presented as mean values +/- SD. f Immunofluorescence images of PitNET markers (SYN, SF1, FSH) in PitNET organoids from two independent patients (n = 3 biological replicates). g Transwell invasion assay and (h) quantitative analysis of primary pituitary tumor cells cultured from two independent patients, treated with OPN or PBS (n = 3 biological replicates). Data are presented as mean values +/- SD. i Bright-field images illustrating representative phenotypes of three independently derived PitNET organoids from each of the two patients treated with OPN or PBS. Arrows indicate cell protrusions in PitNET organoids. j CellTiter-Glo luminescent cell viability assay of PitNET organoids treated with OPN or PBS (n = 3 biological replicates). Data are presented as mean values +/- SD. k Immunofluorescence images of Ki67 in PitNET organoids from two patients treated with OPN or PBS (n = 3 biological replicates). For all panels, scale bar, 100 µm. Two-sided unpaired t-test was performed for (aj). Data are presented as mean values +/- SD for (aj). Source data are provided as a Source Data file for (aj).
Fig. 8
Fig. 8. ITGB1 knockdown inhibits osteopontin (OPN)-induced proliferation and invasion in pituitary tumor cells.
a Western blot analysis of ITGB1 expression in GH3, AtT-20, and TtT/GF cell lines. b Semi-quantitative analysis of ITGB1 in GH3, AtT-20, and TtT/GF cell lines (n = 3 biological replicates). c CCK-8 cell viability assay of GH3, AtT-20, and TtT/GF cell lines under specified treatments (n = 3 biological replicates). d Transwell invasion assay of GH3, AtT-20, and TtT/GF cell lines under specified treatments (n = 3 biological replicates). e Quantitative analysis of Transwell invasion assay in GH3, AtT-20, and TtT/GF cell lines under specified treatments (n = 3 biological replicates). Scale bar, 100 µm. Two-sided unpaired t-test was performed for (be). Data are presented as mean values +/- SD for (be). Source data are provided as a Source Data file for (ae).

Similar articles

Cited by

References

    1. Melmed, S. Pituitary-tumor endocrinopathies. N. Engl. J. Med.382, 937–950 (2020). - PubMed
    1. Mete, O. & Lopes, M. B. Overview of the 2017 WHO classification of pituitary tumors. Endocr. Pathol.28, 228–243 (2017). - PubMed
    1. Tritos, N. A. & Miller, K. K. Diagnosis and management of pituitary adenomas: a review. JAMA329, 1386–1398 (2023). - PubMed
    1. Molitch, M. E. Diagnosis and treatment of pituitary adenomas: a review. JAMA317, 516–524 (2017). - PubMed
    1. Petersenn, S. et al. Diagnosis and management of prolactin-secreting pituitary adenomas: a pituitary society international consensus statement. Nature reviews. Endocrinology19, 722–740 (2023). - PubMed

MeSH terms