. 2025 May 30;16(1):5009.
doi: 10.1038/s41467-025-60457-2.

Precision targeting of β-catenin induces tumor reprogramming and immunity in hepatocellular cancers

Affiliations

Precision targeting of β-catenin induces tumor reprogramming and immunity in hepatocellular cancers

Brandon M Lehrich et al. Nat Commun. .

Abstract

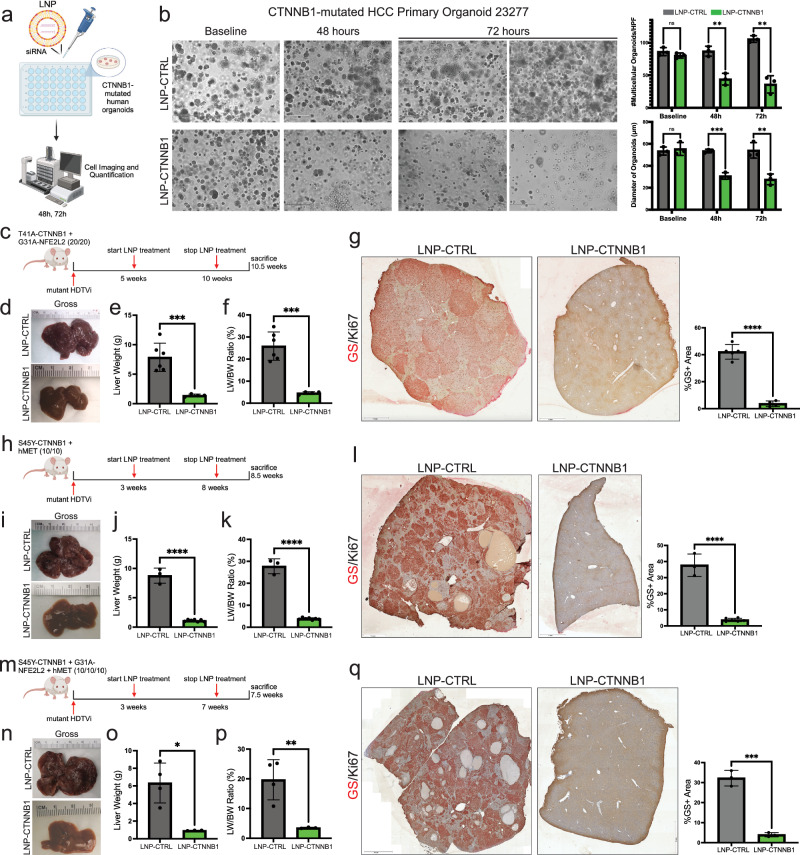
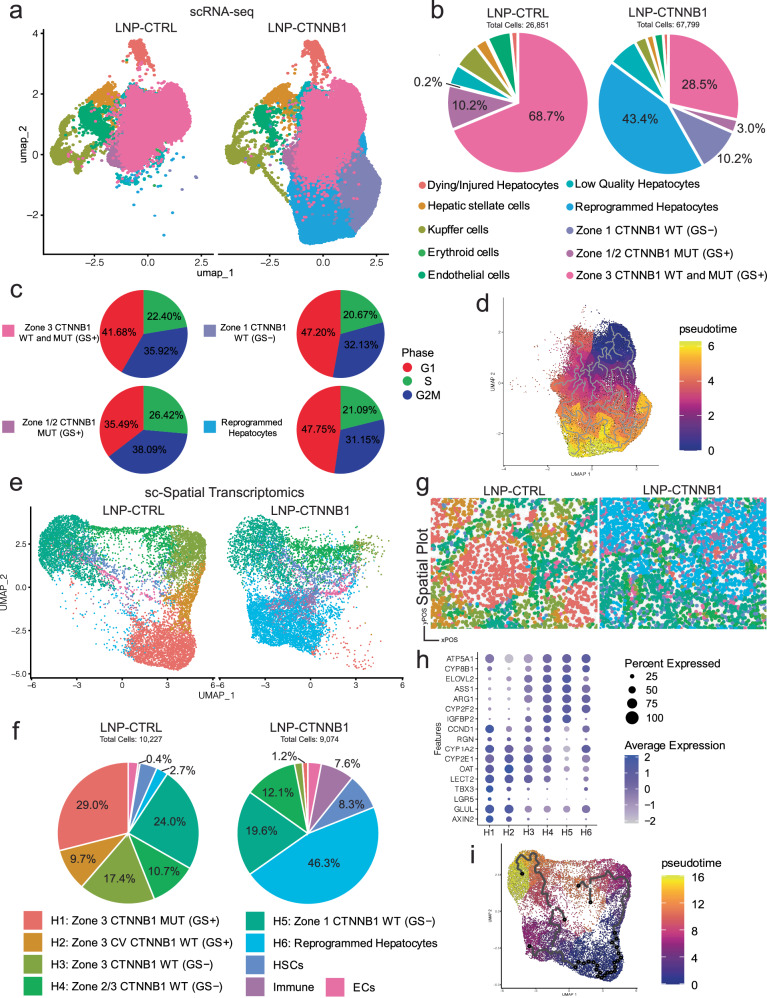
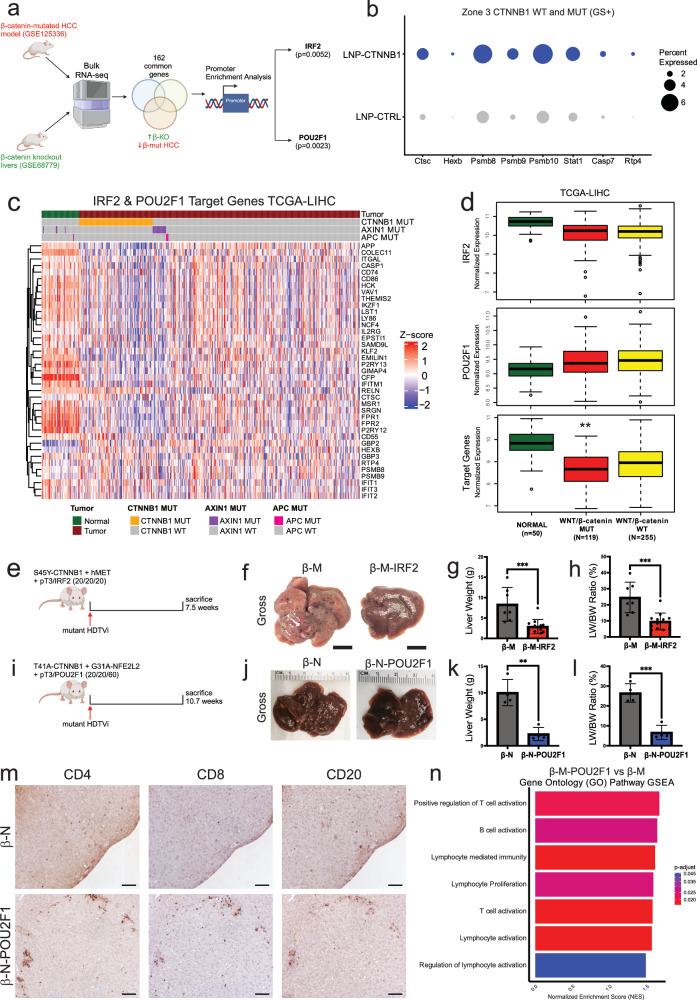
First-line immune checkpoint inhibitor (ICI) combinations show responses in subsets of hepatocellular carcinoma (HCC) patients. Nearly half of HCCs are Wnt-active with mutations in CTNNB1 (encoding for β-catenin), AXIN1/2, or APC, and demonstrate heterogeneous and limited benefit to ICI due to an immune excluded tumor microenvironment. We show significant tumor responses in multiple β-catenin-mutated immunocompetent HCC models to a novel siRNA encapsulated in lipid nanoparticle targeting CTNNB1 (LNP-CTNNB1). Both single-cell and spatial transcriptomics reveal cellular and zonal reprogramming, along with activation of immune regulatory transcription factors IRF2 and POU2F1, re-engaged type I/II interferon signaling, and alterations in both innate and adaptive immunity upon β-catenin suppression with LNP-CTNNB1 at early- and advanced-stage disease. Moreover, ICI enhances response to LNP-CTNNB1 in advanced-stage disease by preventing T cell exhaustion and through formation of lymphoid aggregates (LA). In fact, expression of an LA-like gene signature prognosticates survival for patients receiving atezolizumab plus bevacizumab in the IMbrave150 phase III trial and inversely correlates with CTNNB1-mutatational status in this patient cohort. In conclusion, LNP-CTNNB1 is efficacious as monotherapy and in combination with ICI in CTNNB1-mutated HCCs through impacting tumor cell-intrinsic signaling and remodeling global immune surveillance, providing rationale for clinical investigations.


Conflict of interest statement

Competing interests: S.P.M. has received research grants from Alnylam Pharmaceuticals. He also received funding from Fog Pharmaceuticals and is a consultant on Advisory Boards for Surrozen, AntlerA, Alnylam, Mermaid Bio, Vicero Inc., and UbiquiTx, and there is no pertinent conflict of interest of these entities as relevant to the current manuscript. T.D., M.M., and W.B. are employed by Alnylam Pharmaceuticals, Cambridge, MA. X.G., H.K., and Y.G. are employed by Genentech Inc., San Francisco, CA. No other authors have any relevant conflicts of interests to declare regarding the current study.

Figures

Fig. 1
Fig. 1. RNAi-mediated β-catenin inhibition is efficacious in multiple immunocompetent CTNNB1-mutated HCC mouse models in early-stage disease setting.
a Schematic of CTNNB1-mutated patient-derived HCC organoid LNP treatment (20 nM). b (Left) Brightfield images at baseline, 48-, and 72-h. Scale bar represents 200 μm. (Right) Quantification of number of multi-cellular organoids per high powered field (HPF) and organoid diameter (n = 3 biological replicates per treatment and time point). c LNP treatment scheme in β-catenin-Nrf2 (β-N) model. Mice received once weekly intravenous (I.V.) injections at 1 mg/kg dosage starting at 5-weeks post-hydrodynamic tail vein injection (HDTVi). d Representative gross liver images of LNP-CTRL and LNP-CTNNB1 (1 mg/kg) treated β-N animals at 10.5-week timepoint. e, f Liver weights (p = 0.0008) and liver weight/body weight (LW/BW) (p = 0.0002) comparing LNP-CTRL (n = 6) and LNP-CTNNB1 (n = 4; 1 mg/kg) treated β-N animals. g (Left) Representative images of immunohistochemistry (IHC) for glutamine synthetase (GS)/Ki67 co-stain comparing LNP-CTRL and LNP-CTNNB1 (1 mg/kg) treated β-N animals. (Right) Quantification of %GS+ area comparing LNP-CTRL (n = 5) and LNP-CTNNB1 (n = 4). h LNP treatment scheme in β-catenin-hMet (β-M) model. Mice received once weekly I.V. injections at 1 mg/kg dosage starting at 3-weeks post-HDTVi. i Representative gross liver images of LNP-CTRL and LNP-CTNNB1 (1 mg/kg) treated β-M animals at 8.5-week timepoint. j, k Liver weights and LW/BW comparing LNP-CTRL (n = 3) and LNP-CTNNB1 (n = 7; 1 mg/kg) treated β-M animals. l (Left) Representative images of IHC for GS/Ki67 co-stain comparing LNP-CTRL and LNP-CTNNB1 (1 mg/kg) treated β-M animals. (Right) Quantification of %GS+ area comparing LNP-CTRL (n = 3) and LNP-CTNNB1 (n = 6). m LNP treatment scheme in β-catenin-Nrf2-hMet (β-N-M) model. Mice received once weekly I.V. injections at 1 mg/kg dosage starting at 3-weeks post-HDTVi. n Representative gross liver images of LNP-CTRL and LNP-CTNNB1 (1 mg/kg) treated β-N-M animals at 7.5-week timepoint. o, p Liver weights (p = 0.01) and LW/BW (p = 0.0098) comparing LNP-CTRL (n = 4) and LNP-CTNNB1 (n = 3; 1 mg/kg) treated β-N-M animals. q (Left) Representative images of IHC for GS/Ki67 co-stain comparing LNP-CTRL and LNP-CTNNB1 (1 mg/kg) treated β-N-M animals. (Right) Quantification of %GS+ area comparing LNP-CTRL (n = 3) and LNP-CTNNB1 (n = 3) (p = 0.0003). Created in BioRender. Lehrich (2025) https://BioRender.com/smaki7g. Lehrich (2025) https://BioRender.com/858w237. Lehrich (2025) https://BioRender.com/6ce7tob. Lehrich (2025) https://BioRender.com/9127h6y. For (b), (eg), (jl), and (oq), data presented as mean values ± standard deviation (SD) and P-values calculated by unpaired two-tailed Student’s t-test. Source data are provided as a Source Data File. For (g), (l), (q), scale bar indicates magnification. *p < 0.05, **p < 0.01, ***p < 0.001, ****p < 0.0001.
Fig. 2
Fig. 2. Earliest biological response to RNAi-mediated β-catenin inhibition is observed 3-days following LNP treatment.
a LNP treatment scheme in β-catenin-Nrf2 (β-N) model. b (Left) Representative gross liver images and (Right) liver weight/body weight (LW/BW) comparing LNP-CTRL (n = 4) and LNP-CTNNB1 (n = 4; 1 mg/kg) β-N treated animals 3-days post 1st LNP treatment. c qPCR RNA expression levels of Ctnnb1 and β-catenin target genes (Glul, Ccnd1, Lect2, Rgn) between LNP-CTRL (n = 3) and LNP-CTNNB1 (n = 3) β-N treated animals. d, e Representative immunohistochemistry (IHC) images for glutamine synthetase (GS), Ki67, and TUNEL comparing LNP-CTRL and LNP-CTNNB1 treated β-N animals 3-days post 1st LNP treatment. Scale bar represents 100 μm. f Quantification of number of Ki67- and TUNEL-positive cells across multiple high-power fields (HPF) between LNP-CTRL (n = 3) and LNP-CTNNB1 (n = 3) treated β-N animals 3-days post 1st LNP treatment (p = 0.0006). g Principal component analysis of bulk RNA-sequencing transcriptomic profiles of β-N and β-M model treated with LNP-CTRL or LNP-CTNNB1 and harvested 3-days post-LNP treatment, using all genes (n = 3–4 per condition and model). h Venn diagram highlighting number of common downregulated differentially expressed genes (DEGs) (n = 230) between β-N and β-M models treated with LNP-CTRL or LNP-CTNNB1 3-days post-LNP treatment. i Venn diagram highlighting number of common upregulated DEGs (n = 73) between β-N and β-M models treated with LNP-CTRL or LNP-CTNNB1 3-days post-LNP treatment. DEGs defined by FDR = 0.05 and fold change >1.5. j Heatmap of selected common downregulated and upregulated genes demonstrating normalized z-score expression value in each model with each LNP treatment condition from (h) and (i). k Kyoto Encyclopedia of Genes and Genomes (KEGG) pathway gene set enrichment analysis (GSEA) in β-N model comparing LNP-CTRL and LNP-CTNNB1 treated animals. l KEGG pathway GSEA in β-M model comparing LNP-CTRL and LNP-CTNNB1 treated animals. For (k, l), normalized enrichment score (NES) was normalized from ES, which was calculated by Kolmogorov–Smirnov-like statistic and the p-value was calculated using the one-tailed empirical permutation test procedure. Created in BioRender. Lehrich (2025) https://BioRender.com/kymtir0. For (b), (c), and (f), data are presented as mean values ± standard deviation (SD) and P-values calculated by unpaired two-tailed Student’s t-test. Source data are provided as a Source Data File. *p < 0.05, **p < 0.01, ***p < 0.001, ****p < 0.0001.
Fig. 3
Fig. 3. Integrated single-cell analyses reveal de novo formation of reprogrammed hepatocytes within remnant tumor nodules 3-days post-LNP-CTNNB1 treatment.
a Uniform manifold approximation and projection (UMAP) visualization of single-cell RNA-seq data following liver perfusion and enrichment of hepatocyte cell populations from LNP-CTRL and LNP-CTNNB1 treated β-catenin-Nrf2 (β-N) animals 3-days post-LNP treatment. UMAP split by treatment condition with 94,650 cells total across both treatment conditions. LNP-CTRL (n = 2) has 26,851 cells in the library; LNP-CTNNB1 (n = 3) has 67,799 cells in the library after data integration. b Pie chart of cell-type proportions between LNP-CTRL and LNP-CTNNB1 treatment conditions from (a). c Cell cycle regression scoring visualized via pie charts depicting cell cycle phase proportions in each of the indicated hepatocyte cell clusters. Each pie slice represents a group of cells colored by whether the RNA expression fits single cells belonging to G1 (red), S (green), or G2M (blue) phases of the cell cycle. d Pseudotime trajectory analysis on UMAP plot subset to only hepatocyte specific cell populations using the Zone 3 CTNNB1 WT and MUT (GS+) cell cluster as the root. e UMAP visualization of single-cell spatial transcriptomic data via Molecular CartogrpahyTM platform taken from frozen liver tissue sections of LNP-CTRL (n = 1) and LNP-CTNNB1 (n = 1) treated β-N animals 3-days post-treatment. UMAP generated based on expression of 100 genes. UMAP split by treatment condition with 19,301 cells total across both treatment conditions (LNP-CTRL library has n = 6 regions of interest (ROIs) with 10,227 cells total; LNP-CTNNB1 library has n = 5 ROIs with 9074 cells total). Labeled cell populations indicated by color. f Pie chart of cell-type proportions between LNP-CTRL and LNP-CTNNB1 treatment conditions from (e). g Spatial plots of LNP-CTRL and LNP-CTNNB1 regions of interest demonstrating visualization of certain cell populations by color from (e, f) on a virtual tissue section. h Dot plot visualization of various zonated marker gene expression (for all zones 1–3) for each hepatocyte cluster from (e, f). i Pseudotime trajectory analysis on Uniform manifold approximation and projection (UMAP) plot using the H1: Zone 3 CTNNB1 MUT (GS+) cluster as the root/origin. For (b), (c), and (f) labeled cell populations indicated by color and Source data are provided as a Source Data File.
Fig. 4
Fig. 4. RNAi-mediated β-catenin inhibition induces infiltration of pro-inflammatory M1-like macrophages due to re-engaged interferon signaling.
a UMAP visualization of integrated single-cell RNA-seq data following liver perfusion and enrichment of immune populations from LNP-CTRL (n = 3) and LNP-CTNNB1 (n = 3; 1 mg/kg) treated β-catenin-Nrf2 (β-N) animals 3-days post-LNP treatment. UMAP split by LNP treatment condition. b Stacked bar plot of cell-type proportions between LNP-CTRL (n = 8499 cells) and LNP-CTNNB1 (n = 11,736 cells) from (a). Labeled cell populations indicated by color for (a, b). c Dot plot visualization of expression of M1-like and M2-like macrophage phenotype markers. d Bar plot comparing percentage of M1-like macrophages amongst the total cell population in the LNP-CTRL (n = 3) and LNP-CTNNB1 (n = 3; 1 mg/kg) groups (p = 0.0653). e Gene Ontology (GO) pathway gene set enrichment analysis (GSEA) in the M1-like macrophage population comparing LNP-CTRL and LNP-CTNNB1 groups. f Stacked horizontal bar plot comparing relative information flow from CellChat between LNP-CTRL and LNP-CTNNB1 (1 mg/kg) groups. Boxed pathways show 100% information flow in LNP-CTNNB1 (1 mg/kg) group. IFN-II signaling highlighted in light blue show 100% enriched in LNP-CTNNB1 (1 mg/kg) group. g Chord diagram for IFN-II pathway in LNP-CTNNB1 (1 mg/kg) group demonstrating information flow from proliferative T cells to macrophage populations. No information flow in LNP-CTRL treated animals. h IFNγ treatment schematic in β-catenin-hMet (β-M) model. Mice received multi-weekly intra-peritoneal (I.P.) injections of IFNγ at 1 × 106 IU/ml dosage or vehicle control starting at 3-weeks post-hydrodynamic tail vein injection (HDTVi). Mice were sacrificed at 7.5-weeks post-HDTVi. i, j Representative gross liver images and liver weight/body weight (LW/BW) comparing β-M animals treated with either vehicle control (n = 3) or IFNγ (n = 8) at 7.5-week timepoint (p = 0.0086). k Representative immunohistochemistry (IHC) images for S100A8/9 comparing Vehicle and IFNγ treated β-M animals. 10× objective lens, scale bar is 100 μm. IHC was repeated at least twice on tissue sections from multiple animals. Created in BioRender. Lehrich (2025) https://BioRender.com/9a8wkfh. For (d, j), data presented as mean values ± standard deviation (SD) and P-values calculated by unpaired two-tailed Student’s t-test. For (e), normalized enrichment score (NES) was normalized from ES, which was calculated by Kolmogorov–Smirnov-like statistic and the adjusted p-value was calculated using the one-tailed empirical permutation test procedure. Source data are provided as a Source Data File. *p < 0.05, **p < 0.01, ***p < 0.001, ****p < 0.0001.
Fig. 5
Fig. 5. IRF2 and POU2F1 repression by mutated-β-catenin is a major tumor cell-intrinsic mechanism of immune exclusion in CTNNB1-mutated HCC.
a Schematic of pipeline comparing whole transcriptomes of β-catenin-mutated HCC to β-catenin knockout livers. b Dot plot highlighting Irf2 and Pou2f1 target genes within the Zone 3 CTNNB1 WT and MUT (GS+) cell population between LNP-CTRL and LNP-CTNNB1 from Fig. 3a, b. c Heatmap of z-scored expression values of IRF2/POU2F1 target genes in TCGA-LIHC patients (n = 374) and adjacent normal (n = 50). Data stratified by CTNNB1- (n = 98), AXIN1- (n = 18), and APC-mutated patients (n = 3). d Boxplots of normalized expression of IRF2, POU2F1, and IRF2/POU2F1 target genes stratified by adjacent normal (n = 50), Wnt/β-catenin-mutant (n = 119), and -wild-type (n = 255). e Schematic of β-catenin-hMet (β-M) animals co-injected with pT3 or IRF2 at time of hydrodynamic tail vein injection (HDTVi) and sacrificed at 7.5-weeks post-HDTVi. f Representative gross liver images from β-M-pT3 and β-M-IRF2 animals. Scale bar indicates 1 centimeter (cm). g, h Liver weights (p = 0.0008) and liver weight/body weight (LW/BW) (p = 0.0003) comparing β-M-pT3 (n = 7) and β-M-IRF2 (n = 12) animals at 7.5-week timepoint. i Schematic of β-catenin-Nrf2 (β-N) animals co-injected with pT3 or POU2F1 at time of HDTVi and sacrificed at 10.7-weeks post-HDTVi. j Representative gross liver images from β-N-pT3 and β-N-POU2F1 animals. k, l Liver weights (p = 0.0013) and LW/BW (p = 0.0005) comparing β-N-pT3 (n = 4) and β-N-POU2F1 (n = 4) animals at 10.7-week timepoint. m Representative IHC images for CD4, CD8, and CD20 comparing β-N-pT3 and β-N-POU2F1 animals at 10.7-week timepoint. n GO pathway gene set enrichment analysis comparing β-M-POU2F1 to β-M-pT3. Created in BioRender. Lehrich (2025) https://BioRender.com/25qvbwj. Lehrich (2025) https://BioRender.com/qqvvb4x. Lehrich (2025) https://BioRender.com/ecs8omd. For (g, h), (k, l), data presented as mean values ± standard deviation (SD) and P-values calculated by unpaired two-tailed Student’s t-test. For (d), the center line shows the median, the box limits show the interquartile range (IQR; the range between the 25th and 75th percentile) and the whiskers show 1.5× IQR. For (d), One-way ANOVA with Tukey-HSD post-hoc adjusted p-values comparing Wnt/β-catenin-mutant vs wild-type are: p = 0.80, p = 0.54, and p = 0.009 for IRF2, POU2F1, and IRF2/POU2F1 target gene expression, repsectively. For (n), NES was normalized from ES, which was calculated by Kolmogorov–Smirnov-like statistic and the adjusted p-value was calculated using the one-tailed empirical permutation test procedure. Source data are provided as a Source Data File. *p < 0.05, **p < 0.01, ***p < 0.001, ****p < 0.0001.
Fig. 6
Fig. 6. Lack of response to RNAi-mediated β-catenin inhibition in CTNNB1-mutated HCC mouse models in advanced-stage disease setting is due to expansion of clones derived from the secondary driver.
a LNP treatment schematic in β-catenin-hMet (β-M) model for advanced-stage disease. Mice received once weekly intravenous (I.V.) injections at 1 mg/kg dosage starting at 6-weeks post-hydrodynamic tail vein injection (HDTVi) and sacrificed at 10.5-weeks post-HDTVi. b Representative gross liver images of LNP-CTNNB1 treated β-M animals at 10.5-week timepoint demonstrating non-responders (NR) and responders (R) compared to LNP-CTRL β-M animals when moribund at ~8.5-weeks. c Liver weight/body weight (LW/BW) comparing LNP-CTRL (n = 4) and LNP-CTNNB1 (n = 8) treated β-M animals at 8.5-week and 10.5-week timepoint, respectively (p = 0.0373). d LNP treatment schematic in β-catenin-Nrf2 (β-N) model for advanced-stage disease. Mice received once weekly intravenous (I.V.) injections at 1 mg/kg dosage starting at 8-weeks post-HDTVi. e Representative gross liver images of LNP-CTNNB1 treated β-N animals at 13.5-week timepoint demonstrating NR and R compared to LNP-CTRL β-N animals when moribund at ~10.5-weeks. f LW/BW comparing LNP-CTRL (n = 6) and LNP-CTNNB1 (n = 8) treated β-N animals at 10.5-week and 13.5-week timepoint, respectively (p = 0.0005). g (Top) Spatial plot of all 17 clusters from the uniform manifold approximation and projection (UMAP) visualization showing the spatial localization on the H&E tissue section. (Bottom) Spatial plot of cluster 3 ident on the H&E tissue section. h Stacked bar chart of cluster proportions for the 3 LNP response (Control, NR, and R) groups. Asterisk denotes cluster 3. i (Top) Spatial plot of all 13 spot clusters from the UMAP visualization showing the spatial localization on the H&E tissue section. (Bottom) Spatial plot of cluster 11 ident on the H&E tissue section. j Stacked bar chart of cluster proportions for the 3 LNP response (Control, NR, and R) groups. Asterisk denotes cluster 11. k Waterfall plot of predicted kinases upstream of the differentially expressed genes (DEGs) in cluster 3 from the β-M model. l Waterfall plot of predicted transcriptional regulators upstream of the DEGs in cluster 11 from the β-N model. Created in BioRender. Lehrich (2025) https://BioRender.com/63585xs. Lehrich (2025) https://BioRender.com/6yyrkql. For (c, f), data presented as mean values ± standard deviation (SD) and P-values calculated by unpaired two-tailed Student’s t-test. Source data are provided as a Source Data File. *p < 0.05, **p < 0.01, ***p < 0.001, ****p < 0.0001.
Fig. 7
Fig. 7. ICI enhances response to RNAi-mediated β-catenin inhibition in β-M CTNNB1-mutated mouse model in advanced-stage disease setting.
a Dot plot of T cell markers (Cd3d, CD3e, Cd3g, Cd4, Cd8a) in clusters 9 and 12 stratified by LNP treatment response (LNP-CTRL [blue]; non-responder [NR; red], responder [R; green]) in β-catein-hMet (β-M) from Fig. 6g, h. b, c Representative immunohistochemistry (IHC) images for CD3 and CD4 in β-M animals treated with LNP-CTRL or LNP-CTNNB1. 5× objective magnification. Scale bar indicates 200 μm. d Dot plot of Cd274 expression by LNP treatment response in β-M. e Schematic of LNP + IgG/α-PD1 in β-M model. Mice received weekly LNP injections at 1 mg/kg dosage starting at 6-weeks post-hydrodynamic tail vein injection (HDTVi) with twice weekly injections of IgG/α-PD1 (200 μg) for two weeks starting 3-days after first LNP treatment. f Representative gross liver images of LNP-CTNNB1 ± IgG/α-PD1 treated β-M animals at 10.5-week timepoint compared to LNP-CTRL ± IgG/α-PD1 when moribund. g Liver weight/body weight (LW/BW) comparing LNP-CTNNB1 ± IgG/α-PD1 (n = 8/n = 8) treated β-M animals at 10.5-week timepoint to LNP-CTRL ± IgG/α-PD1 (n = 4/n = 4) when moribund. h Magnetic resonance images (MRI) of LNP-CTNNB1 ± IgG/α-PD1 treated β-M animals at 10.5-week timepoint. i RNA expression levels by qPCR of mCTNNB1 and hCTNNB1 in β-M animals treated with LNP-CTNNB1 ± IgG/α-PD1 (n = 8). j Representative tiled IHC images for granzyme B (GZMB) from LNP-CTNNB1 ± IgG/α-PD1 treated β-M animals at 10.5-week timepoint. Scale bar indicates magnification. k Violin plot showing quantification of number of GZMB+ lymphoid aggregates per tissue section in tumoral regions from LNP-CTNNB1 ± IgG/α-PD1 (n = 8) treated β-M animals at 10.5-week timepoint. l Kaplan–Meier overall survival (OS) curve comparing β-M animals treated with LNP-CTRL ± IgG/α-PD1 (n = 3/n = 4) or LNP-CTNNB1 ± IgG/α-PD1 (n = 10/n = 8) (p = 0.0188). m Schematic of two-part mechanistic working model for LNP-CTNNB1 response in β-catenin-mutated HCC. Created in BioRender. Lehrich (2025) https://BioRender.com/z4h1j67. Lehrich (2025) https://BioRender.com/hjjd4zn. For (g, i), data presented as mean values ± standard deviation (SD). For (g), P-values calculated by one-way ANOVA with Tukey-HSD post-hoc correction. For (i, k), P-values calculated by unpaired two-tailed Student’s t-test. For (l), P-value calculated by log-rank test to compare difference in mean OS time between LNP-CTNNB1 + IgG and LNP-CTNNB1 + α-PD1. Source data are provided as a Source Data File. *p < 0.05, **p < 0.01, ***p < 0.001, ****p < 0.0001.
Fig. 8
Fig. 8. Lymphoid aggregates are prognostic in hepatocellular carcinoma and negatively correlated with CTNNB1 mutational status.
a Stacked bar plot of number of patients in IMbrave150 phase III trial having either tertiary lymphoid structure (TLS), lymphoid aggregate (LA), diffuse infiltrate (DI), or none (n = 174). b Stacked bar plot of number of patients in IMbrave150 phase III trial having either TLS, LA, DI, or None stratified by treatment group and clinical response: atezolizumab + bevacizumab (AtezoBev; n = 116) versus sorafenib (Sor; n = 58). c (Top) Kaplan–Meier progression-free survival (PFS) and overall survival (OS) curves comparing patients with TLS/LA in atezolizumab + bevacizumab versus sorafenib arms. (Bottom) Kaplan–Meier PFS and OS curves comparing patients with DI/None in atezolizumab + bevacizumab versus sorafenib arms (n = 174; AtezoBev, n = 116; Sor, n = 58). d Expression of a “LA-like” gene signature stratified by whether patients in IMbrave150 phase III trial had TLS/LA or DI/None (n = 174; p = 0.025). e Expression of a “LA-like” gene signature stratified by whether patients in IMbrave150 phase III trial had TLS, LA, DI, or None (n = 174; p = 0.0095). f (Left) Kaplan–Meier PFS curve comparing patients with high LA-like gene signature in atezolizumab + bevacizumab versus sorafenib arms (n = 88; AtezoBev, n = 59; Sor, n = 29). (Right) Kaplan–Meier OS curve comparing patients with high LA-like gene signature in atezolizumab + bevacizumab versus sorafenib arms (AtezoBev, n = 59; Sor, n = 29). g Box plot depicting “LA-like” gene signature stratified by CTNNB1 mutational status in all patients and within each of the two treatment arms from IMbrave150 phase III trial (n = 129; p = 0.002). For (c, f), hazard ratios (HRs) and 95% confidence intervals (CIs) were determined using a univariate Cox model. Kaplan–Meier log-rank test was used to compare differences in PFS/OS outcomes. For the boxplots in (d, e, g), the center line shows the median, the box limits show the interquartile range (IQR; the range between the 25th and 75th percentile) and the whiskers show 1.58× IQR. For (d, g), P-values were calculated using two-tailed unpaired t-test. For (e), P-value was calculated using one-way analysis of variance (ANOVA).

Update of

References

    1. Sung, H. et al. Global Cancer Statistics 2020: GLOBOCAN Estimates of Incidence and Mortality Worldwide for 36 Cancers in 185 Countries. CA Cancer J. Clin.71, 209–249 (2021). - PubMed
    1. Cheng, A. L. et al. Updated efficacy and safety data from IMbrave150: Atezolizumab plus bevacizumab vs. sorafenib for unresectable hepatocellular carcinoma. J. Hepatol.76, 862–873 (2022). - PubMed
    1. Sangro, B. et al. Four-year overall survival update from the phase III HIMALAYA study of tremelimumab plus durvalumab in unresectable hepatocellular carcinoma. Ann. Oncol. 35, 448–457 (2024). - PubMed
    1. Rimassa, L., Finn, R. S. & Sangro, B. Combination immunotherapy for hepatocellular carcinoma. J. Hepatol.79, 506–515 (2023). - PubMed
    1. Sangro, B., Sarobe, P., Hervas-Stubbs, S. & Melero, I. Advances in immunotherapy for hepatocellular carcinoma. Nat. Rev. Gastroenterol. Hepatol.18, 525–543 (2021). - PMC - PubMed

MeSH terms

LinkOut - more resources