. 2025 May 29;11(1):91.
doi: 10.1038/s41522-025-00714-w.

Integrated multi-omics reveals different host crosstalk of atopic dermatitis-enriched Bifidobacterium longum Strains

Affiliations

Integrated multi-omics reveals different host crosstalk of atopic dermatitis-enriched Bifidobacterium longum Strains

Hoon Je Seong et al. NPJ Biofilms Microbiomes. .

Abstract

The infant gut microbiome is essential for long-term health and is linked to atopic dermatitis (AD), although the underlying mechanisms are not fully understood. This study investigated gut microbiome-host interactions in 31 infants with AD and 29 healthy controls using multi-omics approaches, including metagenomic, host transcriptomic, and metabolomic analyses. Microbial diversity was significantly altered in AD, with Bifidobacterium longum and Clostridium innocuum associated with these changes. At the strain-level, only B. longum differed significantly between groups, with pangenome analyses identifying genetic variations potentially affecting amino acid and lipid metabolites. Notably, B. longum subclade I, which was more prevalent in healthy controls, correlated with host transcriptomic pathways involved in phosphatidylinositol 3-kinase-AKT signaling and neuroactive ligand-receptor pathways, as well as specific metabolites, including tetrahydrocortisol and ornithine. These findings highlight the role of B. longum strain-level variation in infants, offering new insights into microbiome-host interactions related to AD.


Conflict of interest statement

Competing interests: The authors declare no competing interests.

Figures
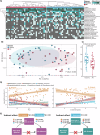
Fig. 1
Fig. 1. Gut microbial community composition and diversity.
A Heatmap showing the distribution of the top 25 enriched species between AD patients and healthy controls. B PCoA plot illustrating β-diversity (unweighted UniFrac distance) to compare microbial communities between patients with AD and healthy controls. C Comparison of α-diversity between AD patients and healthy controls. D Pearson correlation between microbial diversity and microbial species (FDR < 0.05). E Structural equation model to assess the mediating effect of microbial diversity on the causal role of B. longum in the AD development (*p < 0.05, **p < 0.01, ***p < 0.001). AD atopic dermatitis, PCoA Principal Coordinate Analysis, PC1 principal component 1.
Fig. 2
Fig. 2. Phylogenetic and functional gene characterization of Bifodobacterium longum strains between AD and healthy controls.
A Phylogenetic analysis based on StrainPhlan3, derived from marker genes of SNVs in B. longum, reveals two distinct subclades corresponding to AD and healthy controls, along with the pangenome distribution of KO via PanPhlan3. Feeding types are indicated with superscripts: b for breastfeeding, f for formula feeding, and no superscript for mixed formula. B Comparison of ANI values among B. longum MAGs, showing cluster patterns within and between subclades. C PCoA plot based on pangenome clusters generated using Panaroo, illustrating differences in genetic profiles between subclades and AD. AD atopic dermatitis, KO KEGG orthologs, ANI Average Nucleotide Identity.
Fig. 3
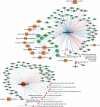
Fig. 3. Association between Bifodobacterium longum subclades and host-exfoliated transcriptome and gut metabolome profiles.
Correlation network showing the relationships between B. longum subsp. infantis subclades, host colonocyte transcripts, and gut metabolites. Octagonal, circular, rectangular, and triangular nodes represent B. longum subclades, colonocyte transcripts, pathway names, and metabolites, respectively. Nodes connected to subclades are highlighted with a thick outline. Edges indicate significant Spearman correlations (p < 0.01 and |r | > 0.5; positive: blue and negative: red) between the residuals of species, transcripts, and metabolites, adjusted by a generalized linear regression model using feeding type, delivery mode and family history as fixed effects.

References

    1. Langan S., Irvine A., Weidinger S. Atopic dermatitisLANCET. 396, 758–758 (2020). - PubMed
    1. Kim, J. P., Chao, L. X., Simpson, E. L. & Silverberg, J. I. Persistence of atopic dermatitis (AD): a systematic review and meta-analysis. J. Am. Acad. Dermatol.75, 681–687.e611 (2016). - PMC - PubMed
    1. Lee, S.-Y., Lee, E., Park, Y. M. & Hong, S.-J. Microbiome in the gut-skin axis in atopic dermatitis. Allergy, asthma Immunol. Res.10, 354–362 (2018). - PMC - PubMed
    1. Huang, Y. J. et al. The microbiome in allergic disease: Current understanding and future opportunities-2017 PRACTALL document of the American Academy of Allergy, Asthma & Immunology and the European Academy of Allergy and Clinical Immunology. J. Allergy Clin. Immunol.139, 1099–1110 (2017). - PMC - PubMed
    1. Ilves, L. et al. Metabolomic analysis of skin biopsies from patients with atopic dermatitis reveals hallmarks of inflammation, disrupted barrier function and oxidative stress. Acta Derm.-Venereologica101, adv00407–adv00407 (2021). - PMC - PubMed

LinkOut - more resources