. 2025 Jun;57(6):1362-1366.
doi: 10.1038/s41588-025-02209-y. Epub 2025 May 29.

Analysis of R-loop forming regions identifies RNU2-2 and RNU5B-1 as neurodevelopmental disorder genes

Affiliations

Analysis of R-loop forming regions identifies RNU2-2 and RNU5B-1 as neurodevelopmental disorder genes

Adam Jackson et al. Nat Genet. 2025 Jun.

Erratum in

Abstract

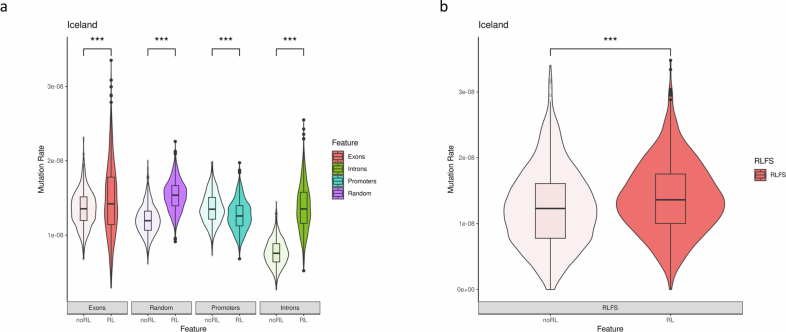
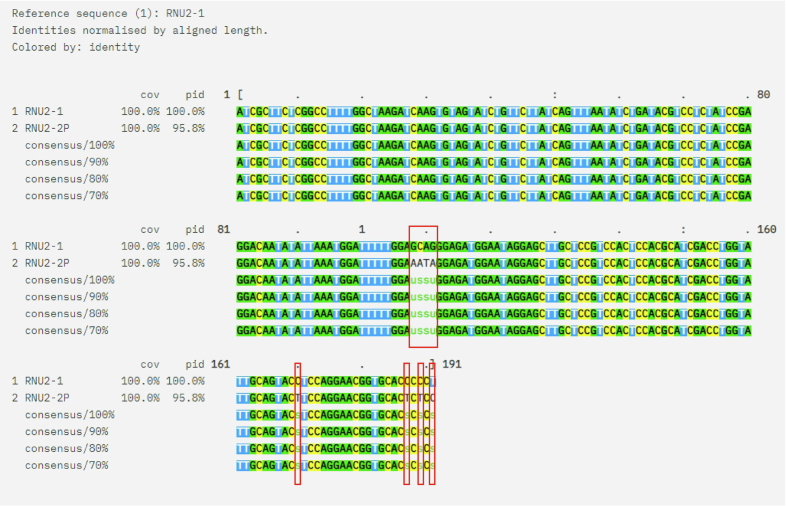
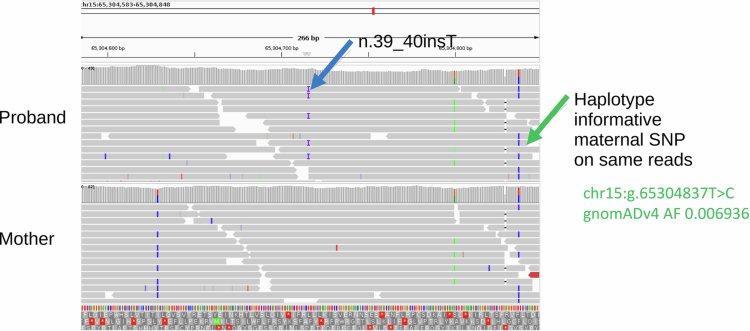
R-loops are DNA-RNA hybrid structures that may promote mutagenesis. However, their contribution to human Mendelian disorders is unexplored. Here we show excess de novo variants in genomic regions that form R-loops (henceforth, 'R-loop regions') and demonstrate enrichment of R-loop region variants (RRVs) in ribozyme, snoRNA and snRNA genes, specifically in rare disease cohorts. Using this insight, we report neurodevelopmental disorders (NDDs) caused by rare variants in two major spliceosomal RNA encoding genes, RNU2-2 and RNU5B-1. These, along with the recently described RNU4-2-related ReNU syndrome, provide a genetic explanation for a substantial proportion of individuals with NDDs.


Conflict of interest statement

Competing interests: The authors declare no competing interests.

Figures

Fig. 1
Fig. 1. Analysis of variants in R-loop regions.
a, Schematic of R-loops and the potential mutagenic processes that could result in increased mutagenesis in these regions. b, Violin plots showing mutation rate in 100KGP for genomic features that overlap (RL) or do not overlap (noRL) experimentally determined R-loop regions. We randomly selected 500 subset regions from each group for 1,000 iterations (***P < 2.22 × 10−16, two-sided Wilcoxon test). Violins extend from minimal to maximal data points. Box plots are centered on median with interquartile ranges as outer bounds, error bars as s.e.m and outliers as dots. c, DN RRV enrichment dot plot in GENCODE noncoding biotypes in 100KGP and Iceland control cohort. The red line marks the log2 fold enrichment threshold. d, Bubble plot of DN RRV enriched gene biotypes in 100KGP. e,f, Gene diagrams of RNU2-2 (e) and RNU5B-1 (f) with variant depletion as heatmap derived from gnomADv4. Variants are color coded by cohort of origin, with filled circles denoting DN variants and gradient-filled circles denoting unknown inheritance or parental transmission. Statistical data underlying the plots are provided as source data. Source data
Fig. 2
Fig. 2. Clinical phenotype of individuals with RNU2-2 and RNU5B-1 variants.
a,b, ORs for HPO terms in RNU2-2 (a) and RNU5B-1 (b) cases compared to all probands in the rare disease arm of 100KGP. Only HPO terms observed in at least three RNU2-2 cases (*P < 0.0045, two-sided Z test of the log OR) or at least two RNU5B-1 cases (*P < 0.0071, two-sided Z test of the log OR) are shown (exact P values are provided in Supplementary Table 10). c,d, Facial photographs and MRI images of affected individuals with RNU2-2 (a) and RNU5B-1 (b) variants. MRI brain of Individual 2 shows cerebral and cerebellar parenchymal volume loss. MRI brain of Individual 5 shows hypoplastic corpus callosum. Written informed consent for each individual was obtained from families for publication in this paper.
Fig. 3
Fig. 3. Characterization of RNU2-2 and RNU5B-1 variants.
a, Balloon plot of small RNA-seq expression data with stringent multimapping protocol for RNU2, RNU4 and RNU5 paralogs in human developing brain derived from ENCODE. Normalized expression is in primary alignments per million. b, Box plots of small RNA-seq expression data with stringent multimapping protocol for RNU2, RNU4 and RNU6 paralogs in the human choroid (n = 13), neurosensory retina (NSR, n = 4) and retinal pigment epithelium (RPE, n = 16). Data are represented in box plots and the median value is central. c, Schematic representation of RNU2-2 variants mapped to the U2–U6 structure in complex with the pre-mRNA branch point. d, Schematic representation of RNU5B-1 variants mapped to the U5 structure in complex with the acceptor and donor sites of adjacent exons, amended from ref. .
Extended Data Fig. 1
Extended Data Fig. 1. Genomic distribution of consensus experimentally determined R-loop regions.
Pie chart produced by CHIPSeeker showing the distribution of R-loop consensus regions genome-wide.
Extended Data Fig. 2
Extended Data Fig. 2. Rate of de novo variants in 100KGP rare disease cohort in predicted R-loop forming sequences.
The ‘noRL’ group denotes regions that are predicted to form R-loops based on sequence context but lack experimental evidence. The ‘RL’ group denotes regions that are predicted to form R-loops based on sequence context and are supported by experimental evidence. ***P < 0.001 (two-sided Wilcoxon test, n = 1,000). Violins extend from minimal to maximal data points. Box plots are centered on median with interquartile ranges as outer bounds, error bars as s.e.m. and outliers as dots. Mutation rate represents de novo variants per bp per generation. Data underlying this plot are provided as source data. Source data
Extended Data Fig. 3
Extended Data Fig. 3. Rate of de novo variants in Icelandic healthy trio cohort in predicted R-loop forming sequences.
a, Enrichment of de novo variants in RL regions in Icelandic cohort. ***P < 0.001 (two-sided Wilcoxon test, n = 1,000). Violins extend from minimal to maximal data points. Box plots are centered on median with interquartile ranges as outer bounds, error bars as s.e.m. and outliers as dots. Mutation rate represents de novo variants per bp per generation. b, Replication of enrichment for de novo variants in RLFS that overlap consensus R-loop regions. The ‘noRL’ group denotes regions that are predicted to form R-loops based on sequence context, but lack experimental evidence. The ‘RL’ group denotes regions that are predicted to form R-loops based on sequence context and are supported by experimental evidence. ***P < 0.001 (two-sided Wilcoxon test, n = 1,000). Violins extend from minimal to maximal data points. Box plots are centered on median with interquartile ranges as outer bounds, error bars as s.e.m. and outliers as dots. Mutation rate represents de novo variants per bp per generation. Data underlying these plots are provided as source data. Source data
Extended Data Fig. 4
Extended Data Fig. 4. Filter logic to identify new disease genes in this study.
Numbers of variants at each step are shown in lozenge shapes, number of genes in diamond shapes and individuals in parallelograms. For example, the last stage shows the identification of eight variants in two new dominant disorder genes (RNU2-2 and RNU5B-1) in 12 individuals.
Extended Data Fig. 5
Extended Data Fig. 5. De novo variants in R-loop regions affecting genes of interest with absence from gnomADv4.
a, All de novo variants in RNU2-2 identified in 100KGP. b, All de novo variants in RNU5B-1 identified in 100KGP. The bottom lollipops on each plot are variants that failed stringent de novo filtering. Lightly shaded circles indicate the presence of that variant in gnomADv4.
Extended Data Fig. 6
Extended Data Fig. 6. Sequence alignment of RNU2-1 and RNU2-2.
The eight nucleotide differences between RNU2-1 and RNU2-2 are highlighted by red boxes. Nucleotides are colored by identity.
Extended Data Fig. 7
Extended Data Fig. 7. IGV screenshot of mother–daughter sequencing duo for individual #3.
The RNU5B-1 n.39_40insT variant is highlighted with a blue arrow. The informative maternal variant is highlighted by a green arrow. Note that in all the informative reads in the proband, the two variants are present in cis, showing that the proband’s RNU5B-1 n.39_40insT variant is highly likely to have arisen on the maternal allele.
Extended Data Fig. 8
Extended Data Fig. 8. Multiple sequence alignment of U5 paralogs and their sequence identity.
a, Multiple sequence alignment of human U5 paralogs normalized to RNU5F-1, which is the longest sequence. Nucleotides are colored by identity. b, Heatmap of percent identity for U5 paralogs showing that RNU5A-1, RNU5B-1 and RNU5E-1 share highest identity with each other.

References

    1. Belotserkovskii, B. P., Tornaletti, S., D'Souza, A. D. & Hanawalt, P. C. R-loop generation during transcription: formation, processing and cellular outcomes. DNA Repair71, 69–81 (2018). - PMC - PubMed
    1. García-Muse, T. & Aguilera, A. R loops: from physiological to pathological roles. Cell179, 604–618 (2019). - PubMed
    1. McCann, J. L. et al. APOBEC3B regulates R-loops and promotes transcription-associated mutagenesis in cancer. Nat. Genet.55, 1721–1734 (2023). - PMC - PubMed
    1. Yan, Q. et al. Proximity labeling identifies a repertoire of site-specific R-loop modulators. Nat. Commun.13, 53 (2022). - PMC - PubMed
    1. Miller, H. E. et al. Quality-controlled R-loop meta-analysis reveals the characteristics of R-loop consensus regions. Nucleic Acids Res.50, 7260–7286 (2022). - PMC - PubMed

MeSH terms

Substances