. 2025 Aug;32(8):1470-1478.
doi: 10.1038/s41594-025-01575-9. Epub 2025 May 29.

Distinct tau filament folds in human MAPT mutants P301L and P301T

Affiliations

Distinct tau filament folds in human MAPT mutants P301L and P301T

Manuel Schweighauser et al. Nat Struct Mol Biol. 2025 Aug.

Abstract

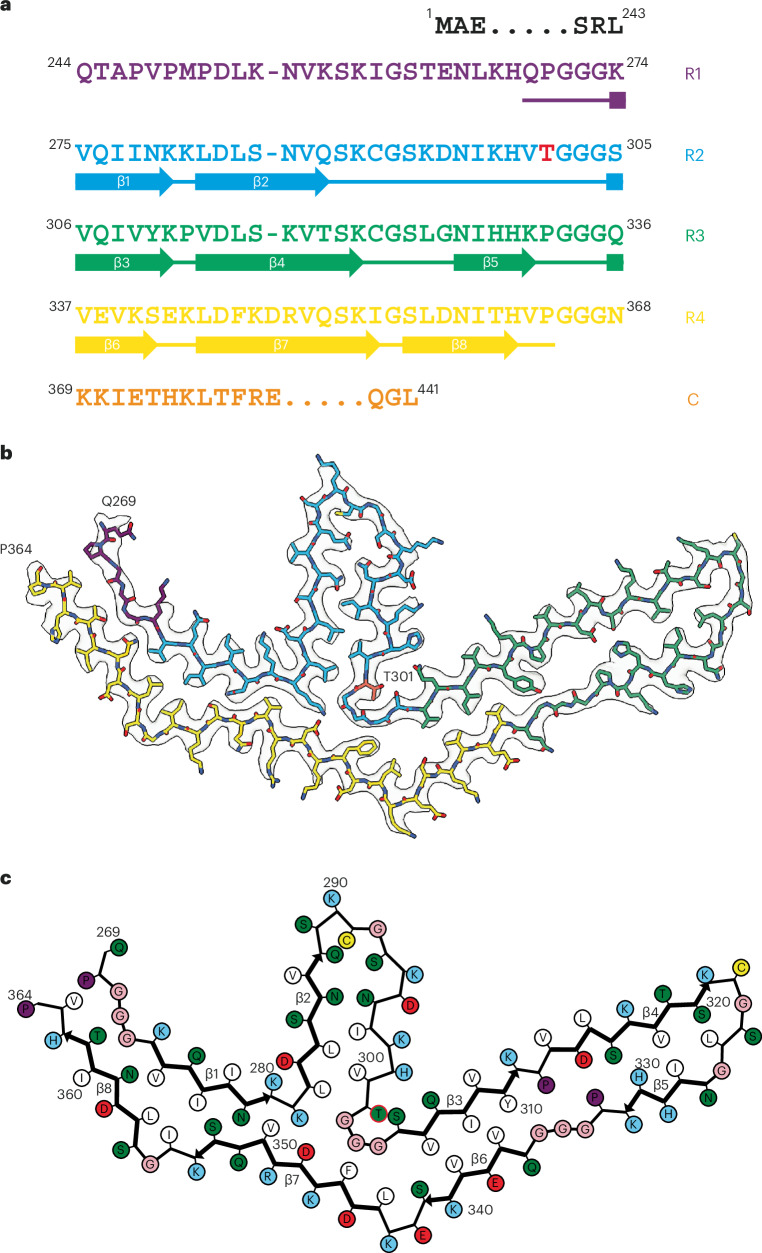
Mutations in MAPT, the tau gene, give rise to frontotemporal dementia and parkinsonism linked to chromosome 17 (FTDP-17), with abundant filamentous tau inclusions in brain cells. Mutations that encode missense variants of residue P301 are the most common and result in the formation of filamentous inclusions made of mutant four-repeat tau. Here we report the cryo-electron microscopy structures of tau filaments from five individuals belonging to three different families with mutation P301L and from one individual from a family with mutation P301T. A distinct three-lobed tau fold resembling the two-layered fold of Pick's disease was present in the individuals with P301L tau. Two different tau folds were found in the individual with mutation P301T, the less abundant of which was a variant of the three-lobed fold. The major P301T tau fold was V-shaped, with partial similarity to the four-layered tau folds of corticobasal degeneration and argyrophilic grain disease.


Conflict of interest statement

Competing interests: The authors declare no competing interests.

Figures

Fig. 1
Fig. 1. MAPT mutation encoding P301L tau: cryo-EM cross-sections of tau filaments and immunoblotting.
a, Cross-sections through the cryo-EM reconstructions, perpendicular to the helical axis and with a projected thickness of approximately one rung, are shown for the parietal cortex from patients 1 and 2 and the temporal cortex from patients 3–5. Resolutions (in Å) and percentages of filament types are indicated at the bottom left and top right, respectively. All filaments had the three-lobed fold of assembled P301L tau. Scale bars, 10 nm. b, Immunoblotting of sarkosyl-insoluble tau from the parietal cortex of patients 1 and 2 and the temporal cortex of patients 3–5. Phosphorylation-independent anti-tau antibodies BR133, RD3, anti-4R and BR134 as well as phosphorylation-dependent anti-tau antibodies AT8 and AT100 were used. Two major tau bands of 64 and 68 kDa were labeled by all antibodies, except RD3, indicating the presence of hyperphosphorylated 4R, but not 3R, tau. Source data
Fig. 2
Fig. 2. MAPT mutation encoding P301L tau: cryo-EM structure of tau filaments.
a, Sequence of repeats R1–R4 of tau (residues 244–368). The core structure of tau filaments extends from G271 to T377 and comprises ten β-strands (β1–β10, shown as thick arrows; loops are shown as thin lines). Residue L301 is highlighted in red. b, Sharpened cryo-EM map of tau filaments from the parietal cortex of patient 2, with the atomic model overlaid. Residues in R1–R4 and the sequence after R4 are colored purple, blue, green, gold and orange, respectively. Residue L301 is labeled, together with the N-terminal G271 and the C-terminal T377 of the ordered core, as well as K353 and K375, which coordinate a nonproteinaceous density. c, Schematic of the P301L tau filament fold. Negatively charged residues are shown in red, positively charged residues are in blue, polar residues are in green, nonpolar residues are in white, sulfur-containing residues are in yellow, prolines are in purple, and glycines are in pink. Thick arrows indicate β-strands (β1–β10). An internal additional density is shown in orange. Residue L301 is circled in red.
Fig. 3
Fig. 3. MAPT mutation encoding P301T tau: cryo-EM cross-sections of tau filaments and immunoblotting.
a, Cross-sections through the cryo-EM reconstructions, perpendicular to the helical axis and with a projected thickness of approximately one rung, are shown for the frontal cortex. Resolutions (in Å) and percentages of filament types are indicated at the bottom left and top right, respectively. Type I tau filaments comprised 66% of tau filaments, and type II comprised 34% of tau filaments. Scale bars, 10 nm. b, Immunoblotting of sarkosyl-insoluble tau from the frontal cortex. Phosphorylation-independent anti-tau antibodies BR133, RD3, anti-4R and BR134 as well as phosphorylation-dependent antibodies AT8 and AT100 were used. Two major tau bands of 64 and 68 kDa were labeled by all antibodies, except RD3, indicating the presence of hyperphosphorylated 4R, but not 3R, tau. Source data
Fig. 4
Fig. 4. MAPT mutation encoding P301T tau: cryo-EM structure of type II tau filaments.
a, Sequence of repeats R1–R4 of tau (residues 244–368). The core structure of tau filaments extends from N269 to P364 and comprises eight β-strands (β1–β8, shown as thick arrows; loops are shown as thin lines). Residue T301 is highlighted in red. b, Sharpened cryo-EM map of type II tau filaments from the frontal cortex, with the atomic model overlaid. Residues in R1–R4 and the sequence after R4 are colored purple, blue, green, gold and orange, respectively. Residue T301 is labeled and so are the N-terminal residue Q269 and the C-terminal residue P364 of the ordered core. c, Schematic of the type II P301T tau filament fold. Negatively charged residues are shown in red, positively charged residues are in blue, polar residues are in green, nonpolar residues are in white, sulfur-containing residues are in yellow, prolines are in purple, and glycines are in pink. Thick arrows indicate β-strands 1–8. Residue T301 is circled in red.
Fig. 5
Fig. 5. MAPT mutation encoding P301T tau: cryo-EM structure of type I tau filaments.
a, Sequence of repeats R1–R4 of tau (residues 244–368). The core structure of type I tau filaments extends from G273 to R379 and comprises 12 β-strands (β1–β12, shown as thick arrows; loops are shown as thin lines). Residue T301 is highlighted in red. b, Sharpened cryo-EM map of type I tau filaments from the frontal cortex, with the atomic model overlaid. Residues in R1–R4 and the sequence after R4 are colored purple, blue, green, gold and orange, respectively. c, Schematic of the type I P301T tau filament fold. Negatively charged residues are shown in red, positively charged residues are in blue, polar residues are in green, nonpolar residues are in white, sulfur-containing residues are in yellow, prolines are in purple, and glycines are in pink. Thick arrows indicate β-strands 1–12. Residue T301 is circled in red.
Extended Data Fig. 1
Extended Data Fig. 1. MAPT mutation encoding P301L tau: Tau inclusions in coronal brain sections from case 1.
a, Coronal section of frontal lobe stained with phosphorylation-dependent anti-tau antibody AT8. Note that all gyri are strongly stained. Scale bar, 10 mm. b, Coronal section of parietal and temporal lobes stained with phosphorylation-dependent anti-tau antibody AT8. Note that not all gyri are labelled in the parietal lobe (upper part of the section). In the temporal lobe, inferior gyri and the hippocampus (arrowed) are strongly stained (lower part of the section). Scale bar, 10 mm.
Extended Data Fig. 2
Extended Data Fig. 2. MAPT mutation encoding P301L tau: Tau inclusions in parietal cortex (postcentral gyrus) from case 1.
The following anti-tau antibodies were used: AT8 (a,b,c); RD3 (d); RD4 (e). Gallyas-Braak silver staining was used in (f,g). a, AT8-positive nerve cells (lower part of the image) and astrocytes (upper part of the image). Scale bar, 50 μm. b, AT8-positive nerve cell (arrow) and AT8-positive astrocyte (arrowhead). Cell bodies and processes are labelled. Scale bar, 25 μm. c, An astrocyte with AT8-positive cytoplasm and processes and AT8-negative nucleus. Scale bar, 5 μm. d, No labelling of neurons or astrocytes by RD3. Scale bar, 25 μm. e, Astrocytes are labelled by RD4 (this case had more tau-immunoreactive astrocytes than neurons). Scale bar, 25 μm. f, Nerve cells and their processes are Gallyas-Braak silver-positive. Scale bar, 25 μm. g, Astrocytic processes are Gallyas-Braak silver-positive. Scale bar, 25 μm.
Extended Data Fig. 3
Extended Data Fig. 3. MAPT mutation encoding P301L tau: Tau inclusions in parietal cortex (postcentral gyrus) from case 2.
The following anti-tau antibodies were used: AT8 (a,b); RD3 (c); RD4 (d). a, AT8-positive nerve cells (lower part of the image) and astrocytes (upper part of the image). Scale bar, 50 μm. b, AT8-positive nerve cell (arrow) and AT8-positive astrocyte (arrowhead). Some neuropil elements are also AT8-immunoreactive. Scale bar, 25 μm. c, No labelling of neurons or astrocytes by RD3. Scale bar, 25 μm. d, Nerve cells and neuropil threads are labelled by RD4 (this case had more tau-immunoreactive neurons than astrocytes). Scale bar, 25 μm.
Extended Data Fig. 4
Extended Data Fig. 4. MAPT mutation encoding P301L tau: Tau inclusions in temporal cortex from cases 3–5.
(a-f), Staining with phosphorylation-dependent anti-tau antibody AT8, showing numerous positive neuronal and glial cell inclusions in P301L tau cases 3 (a,b), 4 (c,d) and 5 (e,f). Scale bars: 200 μm (a,c,e); 50 μm (b,d,f).
Extended Data Fig. 5
Extended Data Fig. 5. Comparison of the three-lobed folds of P301L and P301T tau filaments with the Pick tau fold.
a, Side-by-side comparison of the three-lobed folds of P301L (left, orange) and type II P301T (middle, yellow) tau filaments with the Pick tau fold (right, blue) (PDB:8P34). b, Overlay of the long arm substructures (residues V306-S341) shown as sticks. Backbone root mean square deviation values Δ were calculated for each pair of substructures (colour coded as in panel a). The remainder of the three folds is shown as backbone.
Extended Data Fig. 6
Extended Data Fig. 6. Comparison of the type I P301T tau fold with structures of tau filaments from human brains and transgenic mouse brains.
a, Ribbon plot of the type I P301T fold. Shown as sticks and highlighted by different colours are substructures shared with other filaments. b-g, Overlays of the corresponding substructures are shown as sticks. Backbone root mean square deviation values Δ are shown for each overlay. b, P301S tau filament fold from mouse line Tg2541 (PDB:8Q96). c, P301S tau filament fold from mouse line PS19 (PDB:8Q92). d, P301L tau filament fold from mouse line rTg4510 (PDB:8WCP). e, Globular glial tauopathy-progressive supranuclear palsy tau (GPT) fold (PDB:7P6A). f, Corticobasal degeneration (CBD) fold (PDB:6TJO). g, Argyrophilic grain disease (AGD) fold (PDB:7P6D).
Extended Data Fig. 7
Extended Data Fig. 7. Cryo-EM 2D classification and resolution estimates.
a, Representative 2D classification images of tau filaments from cases with MAPT mutations P301L and P301T. Scale bars, 50 nm. b-d, Solvent-corrected Fourier shell correlation (FSC) curves of cryo-EM half-maps (left panels) and model-to-map validation (right panels) for P301L tau filaments (from case 2) (b), P301T tau filaments type I (c) and P301T tau filaments type II (d). FSC curves for the final refined atomic model against the final cryo-EM map are shown in red; for the atomic model refined in the first half map in brown (model 1 versus half map 1); and for the refined atomic model in the first half map against the other half map in green (model 1 versus half map 2).
Extended Data Fig. 8
Extended Data Fig. 8. Cryo-EM images of P301L and P301T filaments.
Representative motion-corrected micrographs of tau filaments from the sarkosyl-insoluble fractions of (a) cases 1–5 with MAPT mutation P301L and (b) the case with MAPT mutation P301T. Scale bar, 50 nm.

Update of

References

    1. Goedert, M., Spillantini, M. G., Jakes, R., Rutherford, D. & Crowther, R. A. Multiple isoforms of human microtubule-associated protein tau: sequences and localization in neurofibrillary tangles of Alzheimer’s disease. Neuron3, 519–524 (1989). - PubMed
    1. Scheres, S. H. W., Ryskeldi-Falcon, B. & Goedert, M. Molecular pathology of neurodegenerative diseases by cryo-EM of amyloids. Nature621, 701–710 (2023). - PubMed
    1. Schweighauser, M. et al. Mutation ΔK281 in MAPT causes Pick’s disease. Acta Neuropathol.146, 211–226 (2023). - PMC - PubMed
    1. Shi, Y. et al. Structure-based classification of tauopathies. Nature598, 359–363 (2021). - PMC - PubMed
    1. Qi, C. et al. Tau filaments with the Alzheimer fold in human MAPT mutants V337M and R406W. Nat. Struct. Mol. Biol.10.1038/s41594-025-01498-5 (2025). - PMC - PubMed

LinkOut - more resources