. 2025 May 29:10.1038/s41563-025-02240-8.
doi: 10.1038/s41563-025-02240-8. Online ahead of print.

Poly(carboxybetaine) lipids enhance mRNA therapeutics efficacy and reduce their immunogenicity

Affiliations

Poly(carboxybetaine) lipids enhance mRNA therapeutics efficacy and reduce their immunogenicity

Sijin Luozhong et al. Nat Mater. .

Abstract

Messenger RNA (mRNA) therapeutics are a promising strategy to combat diverse diseases. Traditional lipid nanoparticle (LNP) formulations for mRNA delivery contain poly(ethylene) glycol (PEG), a polymer widely used in drug delivery carriers but that recently has been associated with efficacy and immunogenicity concerns. Here we report poly(carboxybetaine) (PCB) lipids as surrogates for PEG-lipids used in mRNA formulations. In vitro studies with immortalized and primary cells show that PCB-containing LNPs have higher mRNA transfection efficiency than PEG-containing LNPs across different formulations. Moreover, primary cell engineering and in vivo immunization studies in mice further demonstrate greater therapeutic efficacy of PCB-containing LNPs over their PEG counterparts. Mechanistic assays show that this improvement is attributed to enhanced endosomal escape of PCB-containing LNPs. These formulations exhibit a safe immunotoxicity profile and effectively mitigate the accelerated blood clearance effect that has been observed for PEG-containing LNPs, enabling repeated administrations without efficacy loss. Overall, these findings highlight PCB-containing LNPs as a potent and safe mRNA delivery platform for clinical applications.


Conflict of interest statement

Competing interests: S. Luozhong, P.L., Z.Y. and S.J. are authors of a patent application related to this work (PCT/US2021/064639) filed by Cornell University in the United States. S. Luozhong, R. Li, P.L. and S.J. are authors of a patent related to this work (PCT/US2024/048135) filed by Cornell University in the United States. The other authors declare no competing interests.

Figures

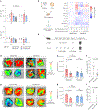
Fig. 1 |
Fig. 1 |. Synthesis and in vitro evaluations of PCB-containing LNPs.
a, Schematic of this work, where PEG-lipid was fully replaced by PCB-lipid in the LNP-containing ionizable cationic lipid, phospholipid, cholesterol and mRNA cargo. b, Reversible addition–fragmentation chain transfer polymerization (RAFT) was used to synthesize different variants of PCB-lipids with different average carboxybetaine repeat units (m = ~5, m = ~15 or m = ~27) and different acyl chain lengths (n = 12 or n = 16). c, Luciferase expression was measured to test the transfection efficiency of LNPs with different polymer lipids listed in b at different molar percentages. Transfections were performed in THP-1 and HeLa cell lines using MC3 and SM102 formulations, respectively. Transfection efficiency quantified as relative luminescence unit (RLU) is shown as the mean of three biological replicates in the heat map. d, Seven different cell lines were tested for the transfection efficiency of LNPs formulated with DMG-PEG 2K (PEG) or M2 containing FLuc-mRNA. Comparison between these two polymer lipids was conducted in three LNP systems including MC3, SM102 and ALC0315. Data from the CKKE12 system are shown in Supplementary Fig. 2. The relative luminescence signal from the transfection is shown in a facet grid plot, where the RLU has been normalized to the PEG group. In the box plot, the upper and lower box edges extend from the first to third quartile, the centre line represents the median and the whiskers are extended to the maxima and minima. Experiments were performed in three biological replicates. A two-tailed unpaired t-test was performed for statistical analysis (the exact P values are displayed in the facet grid). Panel a created with BioRender.com.
Fig. 2 |
Fig. 2 |. PCB-LNPs show higher transfection efficiency than PEG-LNPs across different formulations.
af, In vitro eGFP expression of PCB-LNP and PEG-LNP in THP-1 (ac) and Jurkat (df) cells. Comparison between these two polymer lipids was conducted in different LNP systems including MC3, SM102 and ALC0315. Transfection was performed in three biological replicates (n = 3) at a dosage of 25, 50 and 100 ng RNA per well. The expression of eGFP was analysed by a fluorescence microscope (Cytation 7) after 24-h transfection of the LNP to the indicated cell lines. Representative fluorescence images (a and d) and flow cytometric histograms (b and e) shown here were selected from one of the replicates at 100 ng RNA per well. The MFI of the eGFP was measured from transfection in THP-1 (c) and Jurkat (f) cells at the indicated dosages. Data are shown as mean ± s.e.m. For statistical analysis, a two-tailed unpaired t-test was performed (ns, not significant; **P < 0.01; ***P < 0.001; ****P < 0.0001).
Fig. 3 |
Fig. 3 |. PCB-LNPs outperform PEG-LNPs in various therapeutic applications.
al, Comparison of SM102-PEG and SM102-M2 in various applications, including the production of CAR-T (ad), ex vivo primary cell transfections (e and f) and gene editing on primary T cells (gi), as well as vaccines (jl). a, Anti-hCD19 CAR-mRNA was delivered to the Jurkat T cells to create CAR-T cells. Transfection was performed at 100-ng RNA per 2 × 10⁴ cells for 24 h. b, Transfection efficiency was analysed using flow cytometry to detect surface expression of CAR19. c,d, Percentage (c) and MFI (d) of CAR+ T cells were compared with SM102-M2 and SM102-PEG. Measurements were performed in biological replicates (n = 3). e, Representative fluorescence images of human primary T cells transfected with LNP to express tdTomato proteins. f, MFI of the tdTomato-expressing cells was obtained from the flow cytometric analysis to compare the transfection efficiency in primary cells with SM102-M2 and SM102-PEG. Measurements were performed in biological replicates (n = 3). g, Cas9-mRNA and sgRNA were co-delivered by LNPs to human primary T cells for 48 h to induce TCR knockout. h, A TIDE assay was used to evaluate the editing rate. The red dashed box highlights the altered chromatogram peaks, indicating successful editing events. i, Editing rate of TCR knockout was compared with SM102-M2 and SM102-PEG in three biological replicates (n = 3). j, LNPs encapsulating OVA-mRNA were injected intramuscularly (5 μg per mouse) on day 0 and day 5. Splenocytes were extracted on day 12 for intracellular stimulation cytokine assay. k,l, Representative flow cytometric images (k) and statistical analysis (l) demonstrate IFN-γ% from CD3+CD8a+ T cells on OVA257 peptide stimulation. Experiments were conducted in biological replicates (n = 5). Data are shown as mean ± s.e.m. Statistical analysis was performed using a two-tailed unpaired t-test (*P < 0.05, **P < 0.01, ****P < 0.0001). Panels a, g and j created with BioRender.com.
Fig. 4 |
Fig. 4 |. Mechanistic assays show an enhanced endosomal escape efficiency by PCB-LNPs.
a, BioSAXS spectra of SM102-PEG (red) and SM102-M2 (blue) encapsulating a Fluc-mRNA. Radius of gyration (Rg) was calculated from a low-q range, and the peak position in the higher-q range of each formulation was also listed. b, Representative cryo-EM images of SM102-PEG and SM102-M2 in PBS (pH 7.4). Scale bar, 100 nm. c, Haemolysis assay to evaluate membrane disruption by SM102-PEG and SM102-M2 at pH 5.5 and pH 7.4, respectively. Measurements were done in biological replicates (n = 5). d, A FRET assay was performed by the co-incubation of a fluorescence-labelled endosome-mimicking liposome (EndoLipo) with LNPs. Data in c and d are shown as mean ± s.e.m. Measurements were done in biological replicates (n = 3). For statistical analysis, a two-tailed unpaired t-test was performed (***P < 0.001, ****P < 0.0001). e, pKa values of SM102-PEG and SM102-M2 were measured by a TNS assay. The dashed line indicates half of the maximal fluorescence signal and defines the apparent pKa of the formulation. Data are shown as mean ± standard deviation. Panels c and d created with BioRender.com.
Fig. 5 |
Fig. 5 |. PCB-LNPs exhibit a safe immunogenicity profile.
a, Liver toxicity in C57BL6/J mice was assessed after three weekly systemic injections of PEG-LNPs or PCB-LNPs at an RNA dosage of 10 μg per mouse. Data are shown as mean ± s.e.m (biological replicates, n = 3). A two-way analysis of variance test with Dunnett’s post hoc analysis was performed to compare each group with the control (treated with PBS). b, Multiplex assay was used to assess the release of cytokines from hPBMC after incubating 24 h with SM102-PEG and SM102-M2 with or without mRNA cargo at various dosages as indicated. Data are shown as the mean of three biological replicates in a heat map. c, Schematic illustrating the injection schedule of repeated administration studies of PEG-LNPs and PCB-LNPs. C57BL/6J mice at the age of 6–8 weeks were intravenously injected with 5 μg (RNA) per mouse. di, Comparisons were performed in the SM102 formulation (biological replicates, n = 8; df) and ALC0315 formulation (biological replicates, n = 3; gi). d,g, Representative IVIS images of the extracted liver from each group are displayed. e,h, Total flux of the luminescence signal of the extracted liver was measured. f,i, Anti-polymer IgM was detected by incubating the serum with polymer-coated beads, followed by probing with fluorescently labelled secondary antibodies and analysis using flow cytometry. Serum was obtained on day 7 after the fourth injection. The level of anti-polymer IgM (IgM+) in the serum was quantified as a percentage of the fluorescence signal, with gating thresholds set using the serum from untreated mice. Data are shown as mean ± s.e.m. For statistical analysis, a two-tailed unpaired t-test was performed (*P < 0.05; ns, not significant). Panels b and c created with BioRender.com.

References

    1. Cullis PR & Hope MJ Lipid nanoparticle systems for enabling gene therapies. Mol. Ther 25, 1467–1475 (2017). - PMC - PubMed
    1. Mullard A COVID-19 vaccine success enables a bolder vision for mRNA cancer vaccines, says BioNTech CEO. Nat. Rev. Drug Discov 20, 500–501 (2021). - PubMed
    1. Hou X, Zaks T, Langer R & Dong Y Lipid nanoparticles for mRNA delivery. Nat. Rev. Mater 6, 1078–1094 (2021). - PMC - PubMed
    1. Akinc A et al. The Onpattro story and the clinical translation of nanomedicines containing nucleic acid-based drugs. Nat. Nanotechnol 14, 1084–1087 (2019). - PubMed
    1. Hassett KJ et al. Optimization of lipid nanoparticles for intramuscular administration of mRNA vaccines. Mol. Ther. Nucleic Acids 15, 1–11 (2019). - PMC - PubMed

LinkOut - more resources