. 2025 May 29;51(3):63.
doi: 10.1007/s10886-025-01609-y.

Aphid Colony Size in Tansy is Affected by Plant Chemical Composition but not by Belowground Herbivory

Affiliations

Aphid Colony Size in Tansy is Affected by Plant Chemical Composition but not by Belowground Herbivory

Annika Neuhaus-Harr et al. J Chem Ecol. .

Abstract

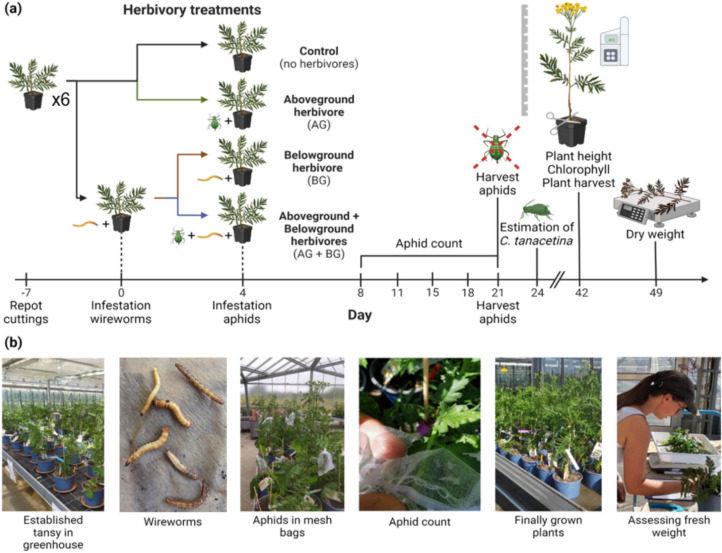
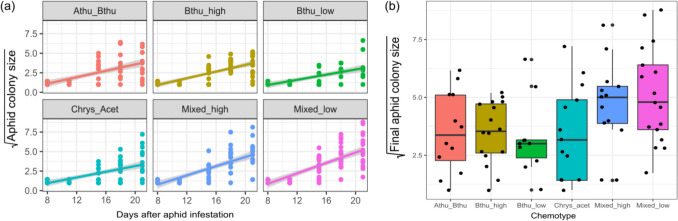
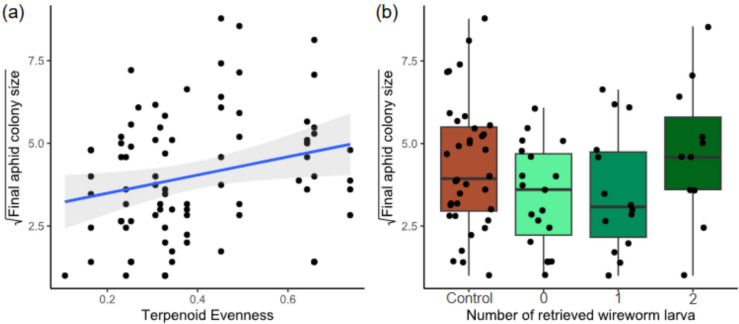
Plants are hosts for above- and belowground insect communities that can influence each other via above-belowground plant-physiological dynamics. To mediate interactions, plants produce secondary metabolites, including terpenoids, and mixtures can differ intraspecifically. While intraspecific variation in plant chemistry gained increased interest, the extent to which intraspecific differences in plant chemistry mediate above-belowground interactions of herbivores remains unclear. We used a full factorial design with six distinct terpenoid chemotypes, differing in their chemical diversity of tansy (Tanacetum vulgare). We exposed these to the aboveground herbivore Macrosiphoniella tanacetaria (Hemiptera: Aphididae), the belowground herbivore Agriotes sp. (Coleoptera: Elateridae), no herbivore or both herbivores, to determine if chemotypes or the chemical diversity of plant compounds affected aphid performance and if the interactions between herbivores were mediated by the chemical profile. We found that aphid colony size differed between chemotypes, with the strongest colony increase over time in a mixed chemotype, and the weakest in a β-thujone chemotype. Root herbivory had no effect on aphid colony size, regardless of the chemotype. Aphid colony size was positively correlated with terpenoid evenness, but not with terpenoid Shannon diversity, terpenoid richness, or relative terpenoid concentration. Tansy chemotypes differed in their morphological responses (final plant height and final plant dry weight) and average leaf chlorophyll content to aboveground herbivory, whereas belowground herbivory exerted minimal impacts. Overall, our results show that intraspecific variation in terpenoid profiles directly modify ecological interactions on a plant, with plant chemistry mediating aphid performance and chemotypes differing in their morphological responses to herbivory.

Keywords: Tanacetum vulgare; Herbivory; Intraspecific chemodiversity; Plant–insect interactions; Terpenoids.


Conflict of interest statement

Declarations. Competing interest: The authors declare no competing interests.

Figures

Fig. 1
Fig. 1
Experimental design and timeline of the above-belowground herbivore experiment (a) The experimental timeline, including the last repotting event, infestation with wireworms and M. tanacetaria aphids, aphid counts, assessment of incidental infestation levels by C. tanacetina and measurements of plant height, chlorophyll and dry weight. Created with Biorender®. (b) Pictures depicting parts of the experimental procedure; the established tansy plants growing in the vegetation hall; wireworms (image courtesy Wikimedia Commons— © Rasbak 2009); M. tanacetaria aphids in mesh bags; aphid counting inside the opened mesh bag; growing plants before harvesting; and the assessment of aboveground fresh weight
Fig. 2
Fig. 2
(a) Square root-transformed M. tanacetaria colony size over time in days after aphid infestation, across chemotypes. (b) Final aphid colony size at the time of the experimental harvest for different tansy chemotypes. Boxes represent the variation in data, where the lower hinge corresponds to the first quartile (25 th percentile) and the upper hinge depicts the third quartile (75 th percentile). Whiskers indicate the 5% and 95% percentiles; solid lines within boxes represent the medians. Black dots indicate individual sample values. The six chemotypes are depicted in different colours for convenience. Note that in both graphs plants with zero aphids were excluded. Graphs with zero aphids included can be found in the supplementary (Fig. 6)
Fig. 3
Fig. 3
(a) Square root-transformed M. tanacetaria colony size on plants differing in leaf terpenoid evenness. The quadratic trendline depicts average predicted values based on a linear model with quadratic term for evenness, and the shaded area depicts the 95% confidence interval. (b) Box plots visualizing square root-transformed M. tanacetaria colony size on plants with no added wireworms, compared to plants on which 0, 1 or 2 wireworm larvae were retrieved after the harvest. Boxes represent the variation in data, where the lower hinge corresponds to the first quartile (25 th percentile) and the upper hinge depicts the third quartile (75 th percentile). Whiskers indicate the 5% and 95% percentiles; solid lines within boxes represent the medians. Black dots indicate individual sample values. Note that in both graphs plants with zero aphids were excluded. Graphs with zero aphids included can be found in the supplementary (Fig. 7)
Fig. 4
Fig. 4
Effects of plant chemotype, aboveground (aphid) and belowground (wireworm) treatment on (a) plant dry weight, (b) plant height, (c, d) chlorophyll content. White boxes represent plants without aphids; grey boxes represent plants with aphids. Panel (c) represents an interactive effect between above- and belowground treatment on average leaf chlorophyll content (SPAD units), and (d) depicts differences in chlorophyll content across chemotypes. Boxes represent the variation in data, where the lower hinge corresponds to the first quartile (25 th percentile) and the upper hinge depicts the third quartile (75 th percentile). Whiskers indicate the 5% and 95% percentiles; solid lines within boxes represent the medians. Black dots indicate outliers. Letters depict statistical significance based on posthoc Tukey tests

References

    1. Adams RP (2017) Identification of essential oil components by gas chromatography/mass spectrometry (5, online. Texensis Publishing, Gruver, TX
    1. Agrawal AA, Weber MG (2015) On the study of plant defence and herbivory using comparative approaches: How important are secondary plant compounds. Ecol Lett 18(10):985–991. 10.1111/ele.12482 - PubMed
    1. Bączek K, Pióro-Jabrucka E, Kosakowska O, Węglarz Z (2019) Intraspecific variability of wild thyme (Thymus serpyllum L.) occurring in Poland. J Appl Res Med Aromatic Plants 12:30–35. 10.1016/j.jarmap.2018.11.001
    1. Bates D, Mächler M, Bolker B, Walker S (2014) Fitting Linear Mixed-Effects Models using lme4 (arXiv:1406.5823). arXiv. 10.48550/arXiv.1406.5823
    1. Benedek K, Bálint J, Salamon RV, Kovács E, Ábrahám B, Fazakas C, Loxdale HD, Balog A (2015) Chemotype of tansy (Tanacetum vulgare L.) determines aphid genotype and its associated predator system: plant chemotype and aphid genotype-predator interaction. Biol J Linnean Soc 114(3):709–719. 10.1111/bij.12445

LinkOut - more resources