. 2025 Aug;44(32):2797-2813.
doi: 10.1038/s41388-025-03434-9. Epub 2025 May 29.

Macrophage activation determines muscle wasting in pancreatic cancer

Affiliations

Macrophage activation determines muscle wasting in pancreatic cancer

Chia-Jung Chang et al. Oncogene. 2025 Aug.

Abstract

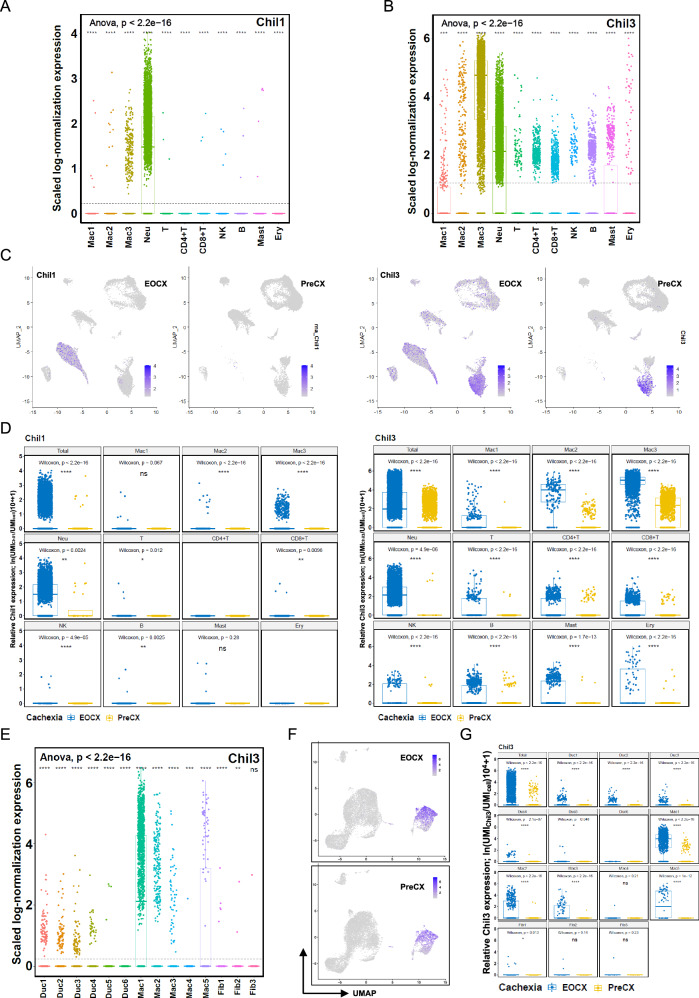
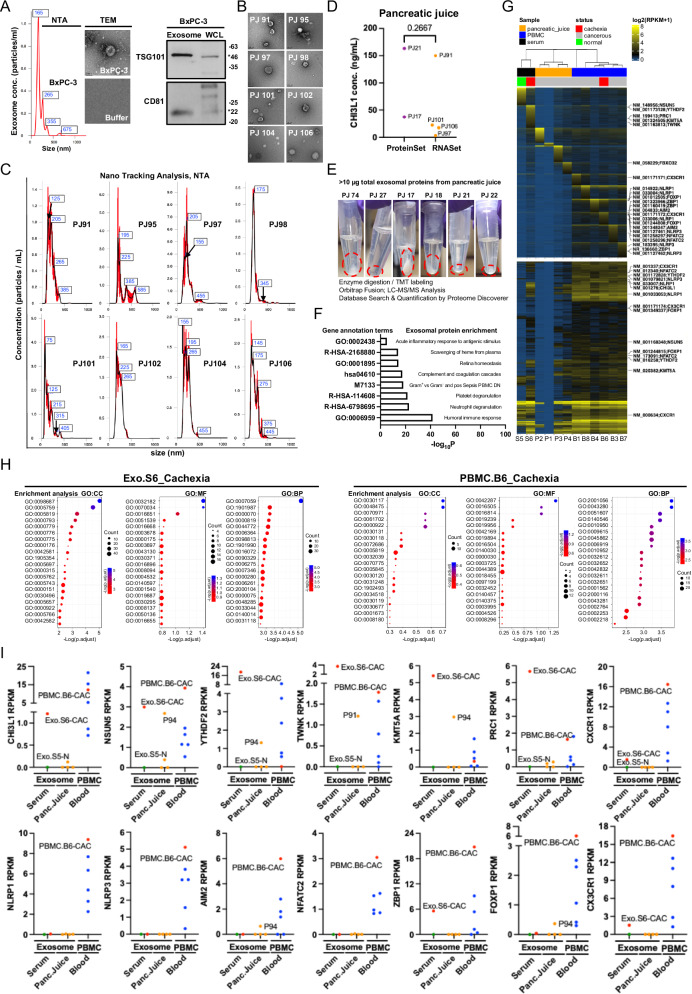
The contribution of non-cancer tumoral microenvironment to cachexia is vastly unclear. Despite advances in understanding the signals involved in cancer cachexia progression, the exact time point of cachexia onset remains unpredictable. The transgenic KrasLSL-G12D/+;Trp53flox/flox;Pdx1-Cre (KP2C) GEMM is a clinically relevant model, with the timing of cancer cachexia progression from the pre-cachectic, early-onset, to severe cachexia showed that the onset of cachexia was associated with differences in muscle wasting. The exact cell-of-origin in different types of non-cancer cells in the tumoral microenvironment and the circulating blood, which drives cachexia, remains unclear. Production of potent pro-cachectic substances that induce skeletal muscle wasting also requires mechanistic analysis. This study analyzed the PBMC and the mouse-derived syngeneic transplants (MDSTs) of KP2C GEMM in recipient mice and pinpoints the cell-type changes with the timing of cachexia (>10% weight loss) by conducting single-cell expression analysis of cell-type-specific gene expression determinants of cachexia. Single-cell RNA sequencing analysis identified signals in high-quality, specific cell types of PBMC (29,615 cells) and MDST (23,151 cells). The scRNA-seq data identified differentially expressed chitinase 3 like 1 (CHI3L1 encoded by mouse Chi3l1) and chitinase-like 3 (CHI3L3, encoded by Chil3) and that macrophages are significant mediators of early-onset muscle wasting in tumor-bearing mice. C2C12 myoblasts treated with the CHI3L1 recombinant protein suppressed myotube formation and upregulated mRNA expression of Hdac3, Tlr9, Irf3, Tbk1, and Nfkb1. Skeletal muscle-specific conditional Hdac3 knockout in tumor-bearing mice decreased muscle wasting via CHI3L1-HDAC3 signaling. An anti-CHI3L1 monoclonal antibody was administered to target these macrophage populations, and the treatment resulted in suppressed tumor growth, metastatic progression, and protected body weight. Our results support the role of pancreatic tumor-associated macrophages in mediating skeletal muscle wasting and provide a clinically relevant mechanism of progression from the pre-cachectic state to the cachexia onset.


Conflict of interest statement

Competing interests: The authors declare no competing interests. Ethics approval and consent to participate: All methods were performed in accordance with relevant guidelines and regulations. The study protocol was approved by the Institutional Review Board of National Cheng Kung University Hospital under the approval numbers A-ER-111-541 and --/B-ER-101-209. Informed consent was obtained from all participants. All animal experiments were performed in compliance with the guidelines and adhered to ethical standards of the National Cheng Kung University (NCKU) Institutional Animal Care and Use Committee under institutional-approved animal experiment procedures (IACUC Permit Numbers: #104092, #105244, #106149, and #109248). The ARRIVE guidelines [71] were consulted to ensure adequately reported animal studies. All mice used were maintained in the Laboratory Animal Center, National Cheng Kung University, ensuring humane treatment in accordance with vertebrate ethical regulations.

Figures

Fig. 1
Fig. 1. Workflow and cohort overview with cell-type identification, annotation, and cell-type counting.
A Diagram of fresh subcutaneous MDST allograft and PBMC samples from early-onset cachexia (EOCX) and age-matched pre-cachexia (PreCX) mice allotransplanted with late-onset cachexia tumors (n = 4 mice) were collected, dissociated, RBC-lysed, and sequenced by a 10x Genomics system. Overlap between gene lists in different cell types in B PBMCs and G subcutaneous MDST allografts, in which the purple curves link identical genes. The inner circle represents gene lists, where hits are arranged along the arc. Genes that hit multiple lists are colored in dark orange, and genes unique to a list are shown in light orange. Dot plots present the marker gene expression of identified cell types in C PBMCs and H subcutaneous MDST allografts. The size of the dots represents the relative gene expression as a percentage for each cluster. The color indicates the average gene expression level. UMAP dimensionality reduction plot showing the identified cell types in D PBMCs and I MDST allograft tumors. The percent cell counts of different cell types in E PBMCs and J MDST allograft tumors. The box plot indicates the percentage of cells in the early-onset (EOCX) and precachectic (PreCX) mice. UMAP dimensionality reduction plot presents the identified cell types in each EOCX.F, EOCX.M, PreCX.F, and PreCX.M sample in F PBMCs and K MDST allograft tumors. L Comprehensive integration analysis of macrophages using Seurat procedures indicates the resemblance of PBMCMac3 to MDST allograftMac1. (Left and center panels) UMAP plots showing the macrophage subtypes (left) and Seurat clusters of integrated cells from PBMCs and MDST allografts (center). (Right panel) Bar plot for macrophage subtypes in each Seurat cluster. M Expression levels of Grem1 in total MDST allograft single cells and ductal cells.
Fig. 2
Fig. 2. The combined violin and bubble plots of module scores in selected genesets from the PBMCs and MSDTs.
X-axis, the cell count distribution in each cell type, and the Y-axis, the entropy-based statistic, ROGUE value, representative of an accurately quantified purity of cell clusters in the PBMC (A) and MDST (B). C, D The horizontal axis represents different cell types, and the vertical axis indicates the Module Scores. The numbers adjacent to each violin distribution indicate the median expression values. The bubble plots above the violin plots depict the −log10 adjusted p-values proportional to the size of each bubble, in which the increased bubble sizes represent high significance. The color gradient of the bubbles reflects the average Module Scores, with higher scores displayed in red and lower scores in blue.
Fig. 3
Fig. 3. Differential expression of ligand-receptor genes in significant signaling pathways identified by CellChat.
Heatmaps depict the expression differences of ligand-receptor genes from all significant signaling pathways (p-value < 0.05) in EOCX and PreCX conditions in A PBMCs and B MDSTs. From top to bottom, the heatmaps represent ECM-Receptor, Cell-Cell Contact, and Non-protein Signaling pathways. The y-axis lists the gene names of ligands and receptors, while the heatmap is divided into four modules from left to right-- Module 1: Normalized gene expression levels, annotated at the top by Sample (EOCX.F for female EOCX, EOCX.M for male EOCX, PreCX.F for female PreCX, PreCX.M for male PreCX), Cachexia state (EOCX or PreCX), and cell type. Module 2: Differential gene expression between EOCX and PreCX, shown as LogFC values. Shades of pink (LogFC > 0) indicates higher expression in EOCX compared to PreCX, while shades of blue (LogFC < 0) indicate lower expression in EOCX. Top annotations represent different cell types. Open circles indicate |LogFC| ≥ 0.5, filled circles indicate |LogFC| ≥ 1, and primarily filled circles indicate |LogFC| ≥ 2. Thin black outlines represent FDR ≤ 0.01, and thick black outlines represent FDR ≤ 10–7. Module 3: Pathway membership of each gene, as annotated by the CellChat database. Top annotations correspond to pathway names, with dark green indicating that the gene belongs to the respective pathway and light green indicating that it does not. Module 4: Ligand or receptor classification of each gene. Top annotations represent ligand and receptor categories, with dark gray indicating that the gene belongs to the corresponding category and light gray indicating that it does not.
Fig. 4
Fig. 4. Differential expression of Chil1 and Chil3 between EOCX and PreCX in PBMCs and MDST allografts.
A, B The expression levels of Chil1 and Chil3 in PBMCs and E the Chil3 expression levels in MDST allografts in each cell type by ANOVA. UMAP visualization of EOCX and PreCX samples with expression labeling of C Chil1 (left) and Chil3 (right) in PBMCs and F Chil3 in MDST allografts. The Wilcoxon signed-rank test of D Chil1 and Chil3 in combined total cells and each cell type comparing the EOCX versus the PreCX cachexia states in PBMCs and G Chil3 in MDST allografts (ns: p > 0.05; *: p ≤ 0.05; **: p ≤ 0.01; ***: p ≤ 0.001; ****: p ≤ 0.0001).
Fig. 5
Fig. 5. Secreted soluble CHI3L1 suppresses myotube formation.
A Multiplex immunofluorescence staining of CHI3L1 and F4/80 in the mouse pancreatic tissue microarray. (Left panel) CHI3L1 (green) and F4/80 (red) staining showed co-expressed CHI3L1 in F4/80+ macrophage cells from (left to right) poor tissue infiltration, low CHI3L1 co-expression, to high CHI3L1 co-expression in the macrophages. (Right panel) quantification of the CHI3L1+; F4/80+ cells per region in each KP2C mouse during the progression time course in the tissue microarray. B Blood CHI3L1 protein level before MDST grafting (T0) and at the time of euthanization (Endpoint) in the pre-cachectic (PreCX) and the early-onset cachectic EOCX groups. C CHI3L1 protein quantities in the extracellular vesicles (EV) fraction and the EV-depleted supernatant fraction of the KP2C conditioned medium. D Images of C2C12 myotube formation under treatment of differentiation medium, exosomes, and KP2C conditioned medium. The workflow, the immunofluorescence staining, and the quantification of % myotube coverage of C2C12 myoblast myotube formation exposed to the indicated concentrations of E TGFβ, CHI3L1, and vehicle control (using an equal volume of the cell culture medium) and F differentiation medium supplemented with the KP2C conditioned medium, and the indicated concentrations of anti-CHI3L1 antibody (α-CHI3L1) neutralizing antibody—red, MyHC, myosin; blue, DAPI staining. A two-tailed Student’s t-test was used to compare the paired nonparametric t-test with the Mann–Whitney test. The expression levels of G Il4, H Il4ra, and I Il13ra1 of each cell type in PMBC. The Wilcoxon signed-rank test of total combined cells in each cell type compares the EOCX versus the PreCX cachexia states in PBMC. J and K the macrophage marker CD163 and Mrc1 expression in each cell type. ANOVA analysis was tested in the dataset; ns: p > 0.05; *p ≤ 0.05; **p ≤ 0.01; ***p ≤ 0.001; ****p ≤ 0.0001. L Normalized mRNA expression of Nfkb1, Tbk1, Irf3, Hdac3, and Tlr9 relative to the expression of β-actin in C2C12 myotubes exposed to vehicle control (green), IL-4/IL-13, 20 ng/mL (white), and IL-4/IL-13, 20 ng/mL stimulated M2 macrophage conditioned medium (red).
Fig. 6
Fig. 6. Conditional knockout of HDAC3 expression in tumor-bearing mice abolished atrogin-1 expression but did not restore the muscle fiber area.
HDAC3 was overexpressed in tumor-bearing wild-type mice, and samples were stained with H&E (A) and multiple fluorescence staining of HDAC3/Atrogin-1/Laminin (B). CE Effects of tumor-bearing on cachexia in HDAC3 conditional knockout mice exposed to orthotopic injection of KP2C cancer. C Diagram of Acta-CreER;Hdac3fl/fl. D, E Immunofluorescence histochemistry staining of Laminin/Atrogin-1 in cryosections of tumor-bearing muscle compared to tumor-free muscles. Individual mice of 9 weeks old were injected with KP2C cancer cells, and tamoxifen was administered via i.p. for 5 days when the mice reached 11 weeks old. The mice were euthanized at the age of 13 weeks.
Fig. 7
Fig. 7. A CHI3L1-neutralizing antibody may alleviate the progression of cancer-induced muscle wasting.
A The experimental timeline for the study. The effect of nCHI3L1 antibody treatment versus isotype IgG control on B body weight measurement, C antitumor progression, D mesentery cancer metastasis, and E intratumoral macrophage populations in the KP2C-luciferase+ orthotopic model in C57BL/6 mice. F Quantitative comparison of muscle fiber area (µm2) between the IgG control and nCHI3L1 antibody (10 mg/kg)-treated groups. G The mean frequency of the cross-sectional area (µm2) distribution of the IgG- and nCHI3L1 antibody (10 mg/kg)-treated groups was analyzed. Data are presented as the mean with SD. H The value of the cross-sectional cutoff area was set to 1800 µm2, representing severe muscle wasting. 46.2% and 28.6% of muscle fibers in the IgG control and nCHI3L1 antibody treatment groups were below the cutoff value, respectively. Fisher’s exact test showed a p-value of less than 0.0001 between the two treatments and a fiber size cutoff of 1800 µm2.
Fig. 8
Fig. 8. Differentially expressed genes in clinical cachexia specimens.
A Characterization of exosomes isolated from BxPC-3 pancreatic cancer cells by nano tracking analysis (NTA) (left), transmission electron microscopy (TEM) (center), and western blotting of the exosomal markers TSG101 and CD81 (right). Characterization of pancreatic juice exosomes by B TEM and C NTA. D CHI3L1 protein concentrations in aliquots of pancreatic juice specimens used for the LC–MS/MS and RNA-seq analyses. E Workflow of quantitative exosomal protein identification by LC–MS/MS. F Enriched pathways and gene ontology in the top 122 high-confidence exosomal proteins. G (upper panel) Heatmaps showing the expression levels of cachexia-associated genes, in which gene transcripts were expressed (>1 RPKM) in at least one sample, are organized by the disease status in which their expression signature is enriched in the individual sample. (lower panel) Consensus clustering of expressed genes in which genes (like CHI3L1) can be expressed in more than one clinical sample. The heatmap for RNA-seq data expression levels in clinical samples, which are labeled in the “Sample” track for serum exosome (black), pancreatic juice exosome (orange), and blood PBMC (blue), with their disease status labeled in the “status” track for cachexia (red), cancer (gray), and normal (green). The RNA expression log2(RPKM + 1) for each RNA transcript was plotted as a gradient color intensity from blue (low expression) and black (moderate expression) to yellow (high expression). H Enriched pathways of Cachexia-associated genes in the PBMC.B6-CAC and Exo.B6-CAC in a cohort of clinical specimens. I Expression level of selected genes in clinical specimens, including serum exosome, pancreatic juice exosome, and blood PBMC.

References

    1. Baracos VE, Martin L, Korc M, Guttridge DC, Fearon KCH. Cancer-associated cachexia. Nature Rev Dis Prim. 2018;4:17105. - PubMed
    1. Argiles JM, Busquets S, Stemmler B, Lopez-Soriano FJ. Cancer cachexia: understanding the molecular basis. Nat Rev Cancer. 2014;14:754–62. - PubMed
    1. Fearon KC. Cancer cachexia: developing multimodal therapy for a multidimensional problem. Eur J Cancer. 2008;44:1124–32. - PubMed
    1. Fearon K, Strasser F, Anker SD, Bosaeus I, Bruera E, Fainsinger RL, et al. Definition and classification of cancer cachexia: an international consensus. Lancet Oncol. 2011;12:489–95. - PubMed
    1. Sadeghi M, Keshavarz-Fathi M, Baracos V, Arends J, Mahmoudi M, Rezaei N. Cancer cachexia: Diagnosis, assessment, and treatment. Crit Rev Oncol Hematol. 2018;127:91–104. - PubMed