. 2025 Jun;28(6):1146-1159.
doi: 10.1038/s41593-025-01962-x. Epub 2025 May 29.

The transcriptomes, connections and development of submucosal neuron classes in the mouse small intestine

Affiliations

The transcriptomes, connections and development of submucosal neuron classes in the mouse small intestine

Wei Li et al. Nat Neurosci. 2025 Jun.

Abstract

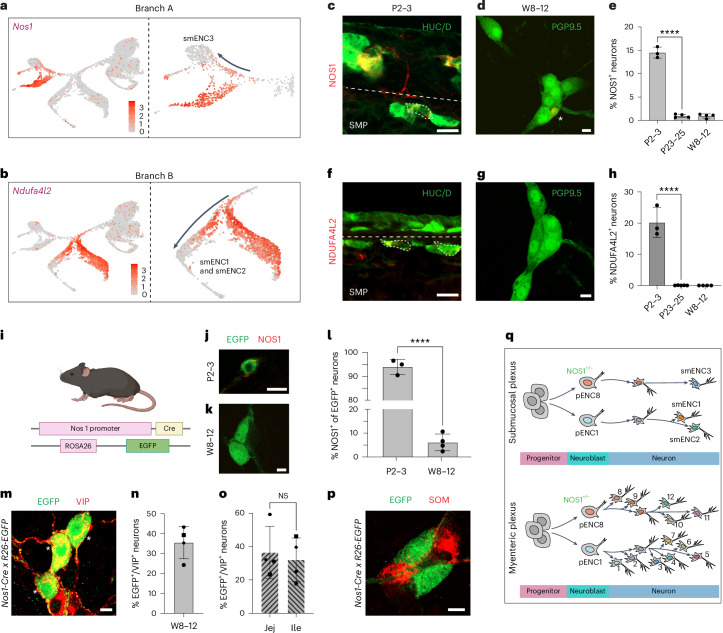
The enteric submucosal plexus regulates essential digestive functions, yet its neuronal composition remains incompletely understood. We identified two putative secretomotor neuron classes and a previously unrecognized submucosal intrinsic primary afferent neuron class through single-cell RNA sequencing in the mouse small intestine. Using viral-mediated labeling of each class, we uncovered their morphologies and neural projections in the submucosa-mucosa context, finding connections among all classes and an unexpected close association with enterochromaffin cells. Further transcriptome analysis at the postnatal stage and lineage tracing revealed that neuron identities in the submucosal plexus emerge through an initial binary fate split at neurogenesis, followed by phenotypic diversification, akin to the developmental process of the myenteric plexus. We propose a unified developmental framework for neuronal diversification across the gut wall. Our study offers comprehensive molecular, developmental and morphological insights into submucosal neurons, opening new avenues for exploring physiological functions, circuit dynamics and formation of the submucosal plexus.


Conflict of interest statement

Competing interests: The authors declare no competing interests.

Figures

Fig. 1
Fig. 1. A molecular definition of neuron classes of the mouse small intestine submucosal plexus.
a, Schematic representations of the experimental procedure indicating the dissection plane and dissociation procedure to obtain single submucosal neurons from the juvenile mouse small intestine. Part of a is created with BioRender.com. b, Uniform manifold approximation and projection (UMAP) of RNA-sequenced neurons, indicating three cardinal clusters. cg, Dot plots and feature plots showing DE genes categorized as miscellaneous (c,d), ion channels, adhesion molecules, transcription factors (e) and cell–cell signaling genes (f,g). See Supplementary Fig. 2 for more comprehensive dot plots of genes with potential functional relevance. The color scale represents the z score, and the dot size represents the percentage of cells with nonzero expression within a given class. h, Proposed functional annotation of the submucosal neuron classes and selected marker genes. i, UMAP depicting refined clustering of smENC1–smENC3. j, Dot plot of cardinal and catecholaminergic gene expression in smENC subclusters, indicating no clear Th expression specificity. k, Feature plots depicting catecholaminergic marker genes in smENC3.
Fig. 2
Fig. 2. Submucosal neuron classes show transcriptional equivalence to three myenteric neuron classes.
a, UMAP of Harmony-integrated myenteric and submucosal juvenile cells, labeled with their cluster identities defined in ref. and in this study (Fig. 1i). b, Sankey plot indicating molecular similarity between transcriptionally similar pairs of smENCs and myENCs. c, Feature plot showing robust Adgrg6 expression in both smENC1 and myENC6. d, Feature plot assembly displaying genes with more definitive expression in myENC6 than smENC1. e, Feature plot assembly displaying genes with more definitive expression in smENC1 than myENC6. f,g, Representative transverse sections (f) and graph statistical analysis (g) showing correlation between Adgrg6 and Nmu expression identified by RNAscope. Number of cells analyzed—195 submucosal Adgrg6+ neurons; 239 myenteric Adgrg6+ neurons (n = 3 mice). h,i, Representative transverse section (h) and graph statistical analysis (i) showing Galr1 in myENC6 but not smENC1 (P < 0.0001). Number of cells analyzed—239 tdTom+ submucosal neurons and 222 tdTom+ myenteric neurons (n = 3 mice). j, Immunohistochemistry showing expression of NF-M in myENC6 (indicated by star) but not smENC1 (0 of 1485 tdTom+ neurons, n = 3 mice). k,l, Representative transverse section (k) and graph statistical analysis (l) showing expression of Pkp1 preferentially in smENC1 over myENC6 (P = 0.0004). Number of cells analyzed—220 tdTom+ submucosal neurons and 182 tdTom+ myenteric neurons (n = 3 mice). Two-tailed Student’s t test was performed to determine statistical significance. Data in g, i and l are presented as mean ± s.d. Each dot (n) represents one animal. ***P < 0.001 and ****P < 0.0001. Scale bars, 20 µm (f,h,j,k). Mice age = 8–12 weeks. SMP, submucosal plexus; MP, myenteric plexus. Source data
Fig. 3
Fig. 3. Submucosal neuron class morphologies and distribution across the small intestine.
a, Representative confocal images of the three cardinal smENCs in small intestine regions. TOM, SOM, VIP and PGP9.5 were used to identify smENC1, smENC2, smENC3 and all neurons, respectively, in adult Nmu-Cre x R26RtdTom mice. See Supplementary Fig. 4a–c for representative pictures of all regions. b, Graphs showing the proportion of smENCs in small intestine regions (n = 3 mice). Data are presented as mean ± s.d. Each dot (n) represents one animal (NMU—duo versus jej, P = 0.9917; duo versus ile, P < 0.0001; jej versus ile, P < 0.0001; SOM—duo versus, P = 0.7934; duo versus ile, P = 0.0008). c, Stacked bar graph showing the mean proportion of the smENCs in the duodenum, jejunum and ileum. d, Schematic drawing of viral-mediated labeling of submucosal classes. Panel d is created with BioRender.com. e,f, Representative pictures displaying the similar morphologies of smENC1 (e) and myENC6 (f). g, Graph showing soma size comparison between smENC1 and myENC6. Number of cells analyzed in five mice—125 smENC1 neurons (length/width—26.37 ± 6.35/15.26 ± 3.50), 115 myENC6 neurons (length/width—28.54 ± 4.83/15.99 ± 3.94; length—P = 0.0034; width—P = 0.1274). h,i, Representative pictures displaying the morphologies of smENC2 (h) and myENC5 (i). j, Graph showing the soma size comparison between smENC2 and myENC5. Number of cells analyzed in five mice—143 smENC2 (length/width—27.64 ± 5.80/12.98 ± 3.08), 127 myENC5 (length/width—21.67 ± 3.83/11.48 ± 2.60; length—P < 0.0001; width—P < 0.0001). k, Representative pictures showing the morphology of smENC3. l, Picture showing one VIP/TH+ myENC11 neuron. TH expression excluded other VIP+ myenteric neurons, including myENC8–myENC10. m, Graph summarizing the smENC morphological types. Number of cells analyzed—62 smENC1 neurons in three mice; 102 smENC2 neurons in three mice; 73 smENC3 neurons in three mice. n, Graph depicting the size comparison between the three smENCs. Number of cells analyzed as indicated above and in four mice—99 smENC3TH neurons (length/width—34.68 ± 7.13/17.95 ± 3.09), 64 smENC3TH+ neurons (length/width—38.35 ± 9.24/18.02 ± 3.81; length, smENC1 versus smENC2—P = 0.4422; smENC1 versus smENC3—P < 0.0001; smENC2 versus smENC3—P < 0.0001; width, smENC1 versus smENC2—P < 0.0001; smENC1 versus smENC3—P < 0.0001; smENC2 versus smENC3—P < 0.0001). Graphical data in g, j and n are presented as mean ± s.d. Each circle represents one cell. Two-tailed Student’s t test (g,j) and one-way ANOVA with Tukey’s multiple-comparison test (b,n) were used to determine the statistical significance; **P < 0.01; ***P < 0.001 and ****P < 0.0001. All images show submucosal or myenteric peels. Arrowheads indicate two axons emanating from one soma. Stars (h,k) indicate irregular axonal start. Scale bars, (a) 30 µm and (e,f,h,i,k,l) 20 µm. Mice age = 8–12 weeks. Duo, duodenum; Jej, jejunum; Ile, ileum; ANOVA, analysis of variance; NS, not significant. Source data
Fig. 4
Fig. 4. Neuronal projections of submucosal classes in the submucosal plane.
ac, Representative images of nerve processes between neurons belonging to the same submucosal class indicating potential homotypic connections. d, Schematic drawing indicating putative homotypic and heterotypic interactions between smENCs. em, Representative pictures of potential heterotypic connections indicated by the bouton-like structure of one neuron class close to the soma of another neuron class. White arrowheads (e,j)—TH+ VIP target cells; yellow arrowheads (f,i)—TH VIP target cells. n, Table summarizing possible ligand–receptor signaling interactions between smENC1–smENC3 based on manual screening (Supplementary Fig. 2) and CellChat analysis. o, CellChat dot plot of various cell-adhesion molecules that could mediate interactions between smENC1–smENC3. The dot color and size indicate the probability score of each interaction and the corresponding P values, respectively. The Benjamini–Hochberg correction is applied to adjust P values to control the false discovery rate. See also Extended Data Fig. 6 for the entire CellChat plot. All images show submucosal peels. Representative images in ac, em were based on observations in five fields of view from each mouse (n = 3), Scale bars, 20 µm (ac, em). Mice age = 8–12 weeks.
Fig. 5
Fig. 5. Neuronal projections of submucosal classes within the mucosa.
a, Schematic drawing depicting non-ENS cell types/structures and their corresponding markers used in the study. Panel a is created with BioRender.com. b,c, Representative pictures showing TOM+ projections from the three smENCs around intestinal crypts (b) and inside villi (c). Arrowheads in insets in c indicate nerve fibers passing the basolateral side of goblet cells. d,e, Three-dimensional reconstructed Imaris images showing the spatial relation between the nerve fibers from smENCs and 5-HT+ EC cells (d) or DCLK+ tuft cells (e). See Supplementary Fig. 6 for original confocal pictures and for examples of long cell–cell distances. fi, Analysis of the shortest distance between TOM+ nerve varicosity and EC cells or tuft cells using Imaris. f,h, Box-and-whisker plots showing individual shortest distances measured. Whiskers indicate the maximum and minimum values, boxes indicate the 25th–75th percentiles and the center line indicates the median. Number of cells analyzed from three mice of each line—51 (Nmu), 43 (Sst) and 60 (Vip) 5-HT+ EC cells; 44 (Nmu), 37 (Sst) and 64 (Vip) DCLK+ tuft cells. Each dot represents one cell. g,i, Density plots showing the distribution of the shortest distance measured. j, Aggregated circle plot showing number of interactions in CellChat analysis between smENCs and 15 epithelial cell types. k, Table showing examples of identified ligand–receptor pairs with epithelial cell types as senders and smENC1–smENC3 as receivers. l, Table showing examples of identified ligand–receptor pairs with smENC1–smENC3 as senders and epithelial cell types as receivers. Neurovascular spatial relation shown at three planes—submucosa (m), crypt (n) and villi (o). TOM+ fibers in all three Cre lines were most closely distributed to capillaries in the crypt and villi (Supplementary Videos 2–4). Representative images in b,c,mo were based on observations in five fields of view from each mouse (n = 3). Scale bars, 20 µm (b,c,mo). Mice age = 8–12 weeks. L, lymphatic vessel; A, arteriole; V, venule; EC, enterochromaffin; TA, transit amplifying. Source data
Fig. 6
Fig. 6. scRNA sequencing at P7 identifies submucosal development within branches A and B.
a, Schematic drawing indicating the dissociated region from postnatal Wnt1-Cre x R26RtdTom pups and subsequent single-cell preparation. Panel a is created with BioRender.com. b, UMAP displaying generic differentiation states in the developing ENS. cf, Feature plots showing expression of generic markers for glia/progenitors, neuroblasts and neurons (c), cell cycle phases (d), SCPs (e) and enteric glia (f). See Extended Data Figs. 8 and 9 for more marker expression used to delineate (b). g,h, Feature plots displaying branches A (g) and B (h) gene markers in postnatal ENS development (P7) and in juvenile smENCs (P24). i, UMAP with identity transfer and predicted.id for smENC1–smENC3; myENC1–myENC4, myENC7–myENC10, myENC12 and ‘enteric glia’. j, Feature plots displaying cardinal smENC marker expression validating the predicted ENC identities in the corresponding predicted.id areas in i (jagged boxes).
Fig. 7
Fig. 7. smENC identities are formed through neuronal phenotypic transitions.
a,b, Feature plots displaying Nos1 or Ndufa4l2 in branch A (a) or B (b) at P7, indicating their expression in smENC1–smENC3 trajectories. c,d, Immunohistochemistry of NOS1 in submucosal neurons showing a decreased expression from early postnatal (c) to adult stages (d) in wild-type mice. e, Graph showing quantification of NOS1+ submucosal neurons exemplified in c and d. P2–3—14.51 ± 1.18% (n = 3 mice); P23–25—0.97 ± 0.37% (n = 4 mice); W8–W12—0.96 ± 0.44% (n = 4 mice; P2–3 versus P23–23—P < 0.0001). f,g, Immunohistochemistry of NDUFA4L2 in submucosal neurons showing a decreased expression from early postnatal (f) to adult stages (g) in wild-type mice. h, Graph showing quantification of NDUFA4L2+ submucosal neurons exemplified in f and g. P2–3, 20.19 ± 4.86% (n = 3 mice); P23–25, 2 NDUFA4L2+ of 7,615 submucosal neurons (n = 5 mice) and W8–W12, 0 NDUFA4L2+ of 8,087 submucosal neurons (n = 4; P2–3 versus P23–23, P < 0.0001). i, Schematic drawing of alleles in Nos1-Cre x R26EGFP mice. Panel i is created with BioRender.com. jl, Immunostaining (j,k) and quantification (l) showing gradual loss of NOS1 expression in EGFP+ cells in submucosal peels of Nos1-Cre x R26EGFP mice. P2–3, 94.01 ± 3.16% (n = 3 mice); W8–W12, 6.12 ± 3.50% (n = 4 mice; P2–3 versus P23–23—P < 0.0001). m, Immunohistochemistry showing EGFP expression in VIP+ smENC3 submucosal cells (NOS1) indicated with stars in adult Nos1-Cre x R26EGFP mice. n,o, Quantification of VIP+ EGFP+ cells exemplified in m (n) and with regard to ileum or jejunum (o; no difference between regions) in Nos1-Cre x R26EGFP mice. 35.53 ± 8.17% (n = 4 mice). Each animal was assigned a unique symbol. p, Representative immunostaining showing no overlap between EGFP and the smENC2 marker SOM. A total of 0 SOM+ of 815 EGFP+ neurons (n = 4 mice). q, Schematic drawing contrasting and comparing myenteric and submucosal neuron diversification. Both submucosal and myenteric neurons are generated through binary branching and phenotypic conversions of immature neurons. The later generation of submucosal neurons may lead to the generation of fewer classes of neurons. Two-tailed Student’s t test was performed to determine statistical significance. Data are presented as mean ± s.d. Each dot represents one animal. ****P < 0.0001 and NS, P > 0.05. Scale bars, 10 μm (c,d,f,g,j,k,m,p). Source data
Extended Data Fig. 1
Extended Data Fig. 1. Identification of non-ENS cells, glial and plausible myenteric cells in the P24 submucosal scRNA-seq dataset.
a, Uniform manifold approximation and projection (UMAP) of level 1 clustering of P24 submucosal cells. See Supplementary Table 1 for differentially expressed genes of the clusters. Jagged boxes are further analyzed in bf. b, Feature plots indicating epithelial cells based on Cdh1 and various subclass markers and immune-related cells (H2-Aa). c, Analysis of Baf53b-Cre x R26RtdTom mice revealed TOM+/5-HT+ double-positive cells, showing transgene expression in serotonergic enterochromaffin cells. Image represents observations from 10 fields of view from 2 mice. Feature plots displaying marker genes of clusters representing mesenchymal-derived lineages, including smooth muscle cells (d) and lymphatic epithelial cells (LECs; e). f, Feature plot of Sox10 indicating an enteric glia cell cluster. g, UMAP of cluster level 2, displaying putative contaminating glial and myenteric classes as indicated in feature plots. h,i, Representative submucosa peels showing lack or little ENK (h) and NDUFA4L2 (i) expression in PGP9.5+ neurons. 0/2583 neurons expressed ENK; n = 3 mice. 2/7615 neurons expressed NDUFA4L2; n = 5 mice. j, CCK expression was investigated in Cck-IRES-Cre mice injected with AAV-DIO-EYFP or AAV-DIO-tdTOM. Only 1 of 2353 submucosal neurons expressed a fluorescent reporter; n = 4 mice (age, 8–12 weeks). Scale bars, 20 µm.
Extended Data Fig. 2
Extended Data Fig. 2. Quality control of final submucosal neuron scRNA-seq dataset.
a, Box plots showing number of UMIs, detected genes and percentage of mitochondrial genes per cell for each of the cardinal smENCs. Box-and-whisker plots indicate max–min (whiskers), 25–75 percentile (boxes) with median as a center line. smENC1, 503 cells; smENC2, 3770 cells; smENC3, 4068 cells. b, Feature plot depicting cells from the three libraries distributed evenly over the clusters. Note, the same single-cell suspension was used for all libraries. c, Pie chart depicting the number of cells of each sex, and a bar graph verifying presence of female and male cells in all clusters, and their similar ratios between clusters. UMI, unique molecular identifier; smENC, submucosal enteric neuron class.
Extended Data Fig. 3
Extended Data Fig. 3. Differential gene expression in submucosal neuron subclusters.
Supportive data related to Fig. 1i-k. a, Dot plot displaying examples of most differentially expressed genes in submucosal neuron subclusters. b, Feature plot showing preferential expression of PAIP2B in smENC3d. c, Validation of PAIP2B protein expression in a submucosal PGP9.5+ neuron (indicated with a star) in duodenum at P28. Image represents observations from 9 fields of view from 5 mice. Scale bar, 20 µm.
Extended Data Fig. 4
Extended Data Fig. 4. Morphological and functional interrogation of smENC1 suggests an IPAN identity.
a, 3D reconstructed image showing one smENC1 neuron from a male mouse (32 weeks), with color-coded fibers within the submucosal plane (endings and fibers), the pericryptal and cryptal spaces and villi. Video representation is available in Supplementary Video 1. b, Schematic drawing of mucosal deformation experimental set-up enabling optical recording of neuronal Ca2+ responses in full-thickness tissue collected from ileum of Nmu-Cre;LSL-GCaMP6f adult mice (18–22 weeks). Part of panel b is created with BioRender.com. c, Bar graph indicating the response type of myenteric (n = 42 neurons) and submucosal (n = 34 neurons) NMU+ cells (p = 0.2838; chi-square). d, Representative traces of individual epochs from quiescent responding cells demonstrating immediate, delayed and poststimulus responses. e, Bar graph indicating the number of epochs in quiescent responding cells with either type of response pattern in each plexus (p = 0.2503; chi-square). Immediate response myENC6:47/93 epochs; smENC1:40/66 epochs. f, Scatter plot showing the response latency for each epoch and mean (±s.e.m.) in quiescent responding cells of each plexus (p = 0.1235, two-tailed Student’s unpaired t test). g,h, Heat map visualizations of the percentage of quiescent responding cells responding during deformation at each of the 24 stimulated spots in the submucosal (g; n = 23 cells) or myenteric plexus (h; n = 23 cells), which can be used as an estimate of the average mucosal receptive field. i, Distribution histogram indicating the percentage of cells responding to different numbers of epochs in each plexus (p = 0.1984; chi-square). j, Distribution histogram indicating percentage of epochs with different numbers of spikes, showing more spikes in responding smENC1 neurons than myENC6 neurons per epoch (p = 0.0387; chi-square). Source data
Extended Data Fig. 5
Extended Data Fig. 5. Close proximity of presynaptic and postsynaptic sites indicates synaptic homotypic and heterotypic connections of smENC1–3.
a, Representative picture showing correlation between bouton-like structure (green puncta) and pre-synaptic marker SYN1 (white arrowhead: SYN1+, yellow arrowhead: SYN1). b, Schematic drawing showing the viral-mediated strategy to label pre-synaptic sites in submucosal neuron classes. See Supplementary Fig. 5 for validation of strategy. Panel b is created with BioRender.com. c,f,i, Representative pictures addressing potential homotypic communication showing Syp-EGFP puncta surrounding TOM+ neuron somas in animals co-injected with AAV-DIO-Syp_EGFP and AAV-DIO-tdTOM (f,i) or AAV-DIO-Syp_EGFP (c). d,e,g,h,j,k, Representative pictures addressing potential heterotypic communication showing Syp-EGFP puncta in close proximity to somas of different neuron classes. lq, Representative pictures showing proximity of presynaptic (Syp-EGFP) and postsynaptic (PSD95) sites indicating homotypic (n,p) or heterotypic communication (l,m,o,q). White arrowheads—colocalization between Syp-EGFP puncta and PSD95. Asterisk indicates identified potential target cell. Representative images were based on observations in 5 fields of view from each mouse (n = 3 in a,d,e,g,h,j and k; n = 2 in c,f,i,lq). Scale bars, 20 µm, except for in the enlarged pictures, 5 µm. Mice age, 8–12 weeks.
Extended Data Fig. 6
Extended Data Fig. 6. CellChat analysis addressing ligand–receptor communication between smENC1–3.
Dotplots of CellChat analysis displaying possible ligand–receptor interactions between pairs of smENC1–3. The dot color shows the relative score of communication probability value of each interaction pair. The dot size indicates the level of significance of the interaction. The Benjamini–Hochberg (BH) correction is applied to adjust p-values to control the false discovery rate (FDR).
Extended Data Fig. 7
Extended Data Fig. 7. CellChat analysis addressing ligand–receptor communication between epithelial cell types and smENC1–3.
Related to Fig. 5. a, Reconstructed UMAP of scRNA-seq of epithelial cell types. b, Dot plots of enteroendocrine cells as senders to smENC1–3. c, Dot plots of smENC1–3 as senders to the epithelial cell types. The dot’s color and size indicate the probability score of each ligand–receptor pair interaction and the corresponding p-values, respectively. The Benjamini–Hochberg (BH) correction is applied to adjust p-values to control the false discovery rate (FDR). Note, dot plots for remaining epithelial cells as senders can be viewed in Supplementary Fig 7.
Extended Data Fig. 8
Extended Data Fig. 8. ENS clusters in scRNA-seq dataset at P7 and their differentiation state.
Supportive data related to Fig. 6. a, Inferred male and female cell distribution shown on a pie chart and feature plot. b, UMAP of postnatal day 7 ENS clusters. Legend indicates proposed differentiation state of each cluster as determined based on differentially expressed genes (Supplementary Table 4 and analysis in c). c, Box plots indicating defining genes used to determine the differentiation states of clusters. Box-and-whisker plots indicate max–min (whiskers), 25–75 percentile (boxes) with median as a center line.
Extended Data Fig. 9
Extended Data Fig. 9. Expression of marker genes of different maturity stages or cell types at P7.
Supportive data related to Fig. 6. Feature plots displaying marker genes of different maturity stages or cell types in the developing ENS at P7—a, progenitors; b, neuroblasts; c, neurons; d, early branch markers; e, myenteric neuron class markers (myENCs).
Extended Data Fig. 10
Extended Data Fig. 10. myENC12 is formed through phenotypic transition of NOS1+ branch A neurons.
Supportive data related to Fig. 7. Representative images (a) and quantification (b,c) of EGFP+ myenteric neurons not maintaining NOS1 expression in Nos1-Cre x R26EGFP mice at W8–12. 12.84 ± 2.50% (n = 3 mice). No difference was detected between intestinal regions. Each animal was assigned a unique symbol in c. Representative images (d,e) and quantification (f,g) of EGFP+ myenteric neurons expressing NTNG1/CALB (44.84 ± 5.62%; n = 5 mice) or 5-HT (45%; 20 cells in 5 mice) in Nos1-Cre x R26EGFP mice at W8–12. No difference was detected between intestinal regions. Each animal was assigned a unique symbol in g. h, Representative image showing no overlap between EGFP and the branch B neuron marker CALR. 0 EGFP+ of 1903 CALR+ cells (n = 3 mice). i, Schematic drawing indicating observed and suggested EGFP expression, suggesting transient NOS1 expression within branch A in both myenteric and submucosal development. Two-tailed Student’s t test was performed to determine statistical significance. Each dot (n) represents one animal. Data are presented as mean ± s.d. NS, P > 0.05. Scale bars, 10 μm. jej, jejunum; ile, ileum. Source data

References

    1. Sharkey, K. A. & Mawe, G. M. The enteric nervous system. Physiol. Rev.103, 1487–1564 (2023). - PMC - PubMed
    1. Furness, J. B. The enteric nervous system and neurogastroenterology. Nat. Rev. Gastroenterol. Hepatol.9, 286–294 (2012). - PubMed
    1. Furness, J. B. The Enteric Nervous System, Second Edition (Blackwell Publishing, 2006).
    1. Vanner, S. & Macnaughton, W. K. Submucosal secretomotor and vasodilator reflexes. Neurogastroenterol. Motil.16, 39–43 (2004). - PubMed
    1. Neckel, P. H. Annotated translation of Georg Meissner’s first description of the submucosal plexus. Neurogastroenterol. Motil.35, e14480 (2023). - PubMed

LinkOut - more resources