. 2025 Jun;10(6):1484-1500.
doi: 10.1038/s41564-025-02016-5. Epub 2025 May 29.

Structural insights into light harvesting by antenna-containing rhodopsins in marine Asgard archaea

Affiliations

Structural insights into light harvesting by antenna-containing rhodopsins in marine Asgard archaea

Gali Tzlil et al. Nat Microbiol. 2025 Jun.

Abstract

Aquatic bacterial rhodopsin proton pumps harvest light energy for photoheterotrophic growth and are known to contain hydroxylated carotenoids that expand the wavelengths of light utilized, but these have not been characterized in marine archaea. Here, by combining a marine chromophore extract with purified archaeal rhodopsins identified in marine metagenomes, we show light energy transfer from diverse hydroxylated carotenoids to heimdallarchaeial rhodopsins (HeimdallRs) from uncultured marine planktonic members of 'Candidatus Kariarchaeaceae' ('Candidatus Asgardarchaeota'). These light-harvesting antennas absorb in the blue-light range and transfer energy to the green-light-absorbing retinal chromophore within HeimdallRs, enabling the use of light that is otherwise unavailable to the rhodopsin. Furthermore, we show elevated proton pumping by the antennas in HeimdallRs under white-light illumination, which better simulates the light conditions encountered by these archaea in their natural habitats. Our results indicate that light-harvesting antennas in microbial rhodopsins exist in families beyond xanthorhodopsins and proteorhodopsins and are present in both marine bacteria and archaea.


Conflict of interest statement

Competing interests: The authors declare no competing interests.

Figures
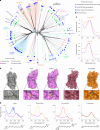
Fig. 1
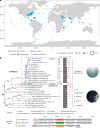
Fig. 1. Phylogenetic relationships and xanthophyll binding potential in fenestrated archaeal rhodopsin proton pumps.
a, NeighborNet network of proteorhodopsins (PRs), xanthorhodopsins (XRs), Archaea clade B (ACB) rhodopsins, HeimdallRs and related rhodopsin families. The three clades of outward proton pumps appearing in marine archaea are highlighted: Archaea clade A proteorhodopsins (ACA) among marine group II and marine group III (Thermoplasmatota: ‘Ca. Poseidoniia’), the ACB family among marine group II and the family of HeimdallRs among the ‘Ca. Kariarchaeaceae’ (‘Ca. Asgardarchaeota’: ‘Ca. Heimdallarchaeia’). Indicated are (from inside out): activity, transmembrane helix 3 motif, presence and type of fenestration, alias and type of carotenoid antenna (-OH for xanthophylls with hydroxyl at carbon C3 and =O for xanthophylls with keto group at carbon C4). Abbreviated family names are as follows: ESR, E. sibiricum rhodopsin; MACR, marine actinobacterial clade rhodopsins; P1, clade P1 (actinobacterial DSE and related DTE rhodopsins); P4, clade P4; Proteo-SR, proteorhodopsin-related sensory rhodopsins; TwRs, twin-peaked rhodopsins. b, Structural comparison of fenestrated rhodopsins: S. ruber xanthorhodopsin with salinixanthin (PDB: 3DDL), Kin4B8-xanthorhodopsin with zeaxanthin (PDB: 7YTB), ACB-G35 rhodopsin (AlphaFold 3 model) and HeimdallR1 (PDB: 9JTQ, this study) versus a non-fenestrated rhodopsin, bacteriorhodopsin (BR; PDB: 1IW6). The structures are aligned on the basis of the retinal β-ionone ring position, and the fenestration zone is highlighted. For clarity, salinixanthin and zeaxanthin are not shown in the enlarged fenestration zone of S. ruber xanthorhodopsin and Kin4B8-xanthorhodopsin structures, respectively. c, Absorbance spectra of ACB-G35 rhodopsin and HeimdallR1 before (purple) and after (brown) incubation, and wash, with a marine chromophore extract. d, Absorbance changes of HeimdallR1 before (purple) and after (orange) incubation, and wash, with pure lutein, diatoxanthin, fucoxanthin and β-carotene. The carotenoid structures are shown at the bottom. Source data
Fig. 2
Fig. 2. Distribution of HeimdallR genes and phylogenetic relationships between members of ‘Ca. Kariarchaeaceae’.
a, Global distribution of heimdallarchaeial rhodopsins. Samples in which HeimdallRs were detected are indicated with squares, with their size proportional to their percentage among all regular microbial rhodopsins. Samples lacking HeimdallRs (but containing other archaeal proton pumps) are indicated with crosses. b, Top: phylogenetic relationships between members of the family ‘Ca. Kariarchaeaceae’ based on concatenated alignment of 153 markers present in at least 60% of the genomes. The position of the root is indicated with a triangle. Rapid bootstrap support values are indicated for branches with support >90. The scaffold Kari_Gs0128817 was placed on the phylogenetic tree and its position is highlighted in red and supplied with the corresponding likelihood weight ratio. Genomes with HeimdallR genes are indicated with stars coloured by the corresponding rhodopsin subclade (Extended Data Fig. 3). Histograms reflect the incidence of phylogenetic markers in the final alignment for each genome, and pink squares mark the presence of the two genes used for phylogenetic placement of Kari_Gs0128817. Bottom: genomic context of the HeimdallR genes from the three clades. Genes used to place Kari_Gs0128817 on the tree are highlighted. Source data
Fig. 3
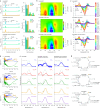
Fig. 3. Spectroscopic characterics of HeimdallR1 bound to different xanthophylls.
a, Fluorescence excitation spectra of HeimdallR1 upon incubation with (orange) or without (purple) lutein (top), diatoxanthin (middle) or fucoxanthin (bottom); emission was recorded at 720 nm. b, The ratios of transient absorption (TA) change in HeimdallR1 with and without lutein (top) and with and without fucoxanthin (bottom) at different excitation wavelengths (425, 450, 465, 480, 545 and 590 nm for lutein and 440, 465, 580, 490, 530, 540, 550 and 600 nm for fucoxanthin) (bars coloured according to the colour of excitation light). The absorption spectra of HeimdallR1 without (purple line) and with (orange line for lutein and coral for fucoxanthin) xanthophylls are overlaid. The red dashed lines indicate no difference between with and without xanthophyll. Tables with the quantum yield (QY) percentages and the pictures of the purified proteins are shown next to the corresponding results. c, Light-minus-dark difference FTIR spectra at 77 K upon illumination of HeimdallR1 with (red) or without (black) fucoxanthin, HeimdallR1 with (red) or without (black) lutein, HeimdallR1 with lutein in H2O (red) or D2O (blue), and Kin4B8-xanthorhodopsin with (green) or without (black) lutein. Hydrated films of lipid-reconstituted protein with H2O are illuminated at 540 nm light (solid lines), which forms the red-shifted K intermediate. Each peak originates from a hydrogen out-of-plane (HOOP) vibration of the retinal chromophore, which shifts upon xanthophyll binding to HeimdallR1, but not to Kin4B8-xanthorhodopsin. One division of the y axis corresponds to 0.0006 absorbance units. LUT, lutein; DIATO, diatoxanthin; FUCO, fucoxanthin. Source data
Fig. 4
Fig. 4. The photocycle of HeimdallR1.
a, Chromatogram of HPLC analyses (left) and the compositions of the retinal isomers (right) (n = 3, mean ± s.d.) under the dark (DA, blue), light (green) and light-adapted (LA, orange) conditions, where AT, 13C, 11C, syn and anti indicate all-trans, 13-cis, 11-cis, syn and anti configurations, respectively. b, Two-dimensional plot of transient absorption change. The labels of positive peaks indicate the absorption increase derived from the absorptions of K, M, O intermediates, and β-band. The negative peaks labelled in HeimdallR1 represent the bleaching of the initial state. c, Transient absorption spectra at different time points of HeimdallR1 without (top), with lutein (middle) and with fucoxanthin (bottom). * indicates the absorption change of xanthophylls in c and d. d, Time course of the transient absorption change of HeimdallR1 without (top), with lutein (middle) and with fucoxanthin (bottom). e, Absorption spectra of photointermediates of HeimdallR1 without (left), with lutein (middle) and with fucoxanthin (right). * indicates the peaks derived from the absorption change of xanthophylls. f, Photocycle models of HeimdallR1 without (top), with lutein (middle) and with fucoxanthin (bottom). Source data
Fig. 5
Fig. 5. Proton-pumping activity of HeimdallR1 under white-light illumination.
a, Light-driven proton-pumping rates in HeimdallR1 and HeimdallR1-G141F E. coli spheroplasts with and without lutein, diatoxanthin or fucoxanthin (depicted in orange, mustard and red, respectively) under white-light illumination (400–700 nm, at 860 µmol m−2 s−1). Each dot represents the proton-pumping rate of HeimdallR1 and HeimdallR1-G141F with a xanthophyll over without the xanthophyll. A total of 26 ratios were used. b, Light-driven proton-pumping rates in HeimdallR1 (depicted in orange circles) and HeimdallR1-G141F (depicted in grey circles) E. coli spheroplasts with and without lutein under various white-light intensities (400–700 nm, at 2,000, 860, 590 and 515 µmol m−2 s−1). Each dot represents the proton-pumping rate of HeimdallR1 and HeimdallR1-G141F with lutein over without lutein. A total of 37 ratios were used. In both panels, boxplots represent the lower quartile, median and the upper quartile, and the whiskers depict 1.5× the interquartile range. The red dashed lines correspond to no differences in proton-pumping activity relative to HeimdallR1 or HeimdallR1-G141F without a xanthophyll. Highly significant effects were found only for the factor of fenestration (wild type vs G141F mutation) in both cases (Supplementary Table 1). Source data
Fig. 6
Fig. 6. Crystal structure of HeimdallR1 and the docking of lutein and fucoxanthin using QM/MM simulations.
a,b, Overall structure of HeimdallR1 with the retinal chromophore, viewed from the membrane plane (a) and the intracellular side (b). c,d, Fenestrations in HeimdallR1 (c) and Kin4B8-xanthorhodopsin (PDB ID: 8I2Z) (d). e, Conservation of the residues surrounding the fenestrations in HeimdallRs and Kin4B8-xanthorhodopsin. Glycine (G) and tyrosine (Y) are coloured orange and cyan, respectively, while polar [threonine (T), serine (S)] and hydrophobic [valine (V), isoleucine (I), leucine (L), alanine (A)] residues are coloured green and blue, respectively. fh, HeimdallR1 structure, energy minimized using the hybrid QM/MM method (f), and the docking of lutein (g) and fucoxanthin (h) along the outer surface of TM6. Black dashed lines indicate hydrogen bonds. i, Zeaxanthin-bound Kin4B8-xanthorhodopsin (PDB ID: 8I2Z). See Extended Data Fig. 9 for zoom-in on the fenestration area. Source data
Extended Data Fig. 1
Extended Data Fig. 1. Environmental marine xanthophylls bind to HeimdallR1.
HPLC profile of Mediterranean Sea chromophore extract (blue) and HeimdallR1 bound chromophores (red). Main peaks correspond to fucoxanthin (2), diatoxanthin (3), lutein (5), β-carotene (8), and uncharacterized (1,4,6,7,9). Chromophores were registered at 450 nm. Source data
Extended Data Fig. 2
Extended Data Fig. 2. Spectroscopic characterization of Kin4B8-xanthorhodopsin and HeimdallR1-G141F with hydroxylated carotenoids.
a, Absorbance change (up) and fluorescence excitation spectra (bottom) of Kin4B8-xanthorhodopsin upon incubation with (orange) or without (purple) diatoxanthin. b, Absorbance change (up) and fluorescence excitation spectra (bottom) of Kin4B8-xanthorhodopsin upon incubation with (orange) or without (purple) fucoxanthin. c, Absorbance change (up) and fluorescence excitation spectra (bottom) of HeimdallR1-G141F upon incubation with (orange) or without (purple) lutein; emissions were recorded at 720 nm. Source data
Extended Data Fig. 3
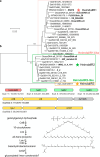
Extended Data Fig. 3. Rhodopsin genes and genes involved in biosynthesis of carotenoids in “Ca. Kariarchaeum”.
a, Neighbour-joining tree of (near-)complete HeimdallR amino-acid sequences. The three clades are highlighted with color and proteins used for expression are indicated with asterisks. For proteins coming from MAGs, the corresponding scaffold names are provided. Numbers next to edges refer to bootstrap support values > 50. b, Rhodopsins and enzymes with putative roles in carotenoid biosynthesis in the “Ca. K. pelagium” core pan-genome. Top: genomic locations of the rhodopsin genes, heimdallarchaeial rhodopsin (heimdallR) and heliorhodopsin (heR1-3) genes. Middle: genomic locations of genes involved in carotenoid biosynthesis – phytoene synthase (crtB), phytoene desaturase (crtI) and two additional genes of unknown function located in the same putative operon; a putative lycopene elongase (lyeJ, prenyltransferase cl00337), carotenoid desaturase (crtD, phytoene dehydrogenase-related protein COG1233), and a putative carotenoid glycosyltransferase (crtQ?). Coordinates are provided for the corresponding genomic regions with respect to the pan-genome scaffolds. Bottom: reactions that might be catalyzed by the corresponding enzymes. Source data
Extended Data Fig. 4
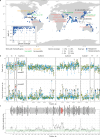
Extended Data Fig. 4. Global distribution of “Ca. Kariarchaeum pelagium” and patterns of variation across its genome.
a, Distribution of “Ca. K. pelagium” based on Logan contigs from marine metagenomes and metatranscriptomes recruited to the “Ca. K. pelagium” core pan-genome. Abundances are expressed as fractions of the pan-genome covered by the mapped contigs with a minimum coverage of 0.5%. Locations of “Ca. K. pelagium” MAGs are indicated with labels coloured according to the heimdallR allele type. Locations of the other “Ca. Kariarchaeum” are indicated for reference: MAG FT_008 (sp016839545) and scaffold Kari_Gs0128817 (sp. nov.). b, Per-nucleotide depth of coverage of Logan metagenomic contigs along the core pan-genome of “Ca. K. pelagium” (upper) and number of variable positions per nucleotide for genes across the pan-genome. Only genes with ORF longer than 300 bp were analyzed. Asterisks indicate outlier genes with values exceeding upper quartile + 1.5×interquartile range. c, Number of variable positions per nucleotide for sliding windows of 200 bp across the pan-genomic scaffold containing the heimdallR gene (scaffold 11). In panels b and c, upper and lower quartiles (dashed lines) and median (solid lines) are indicated. Source data
Extended Data Fig. 5
Extended Data Fig. 5. Biophysical characterization of diverse marine HeimdallRs with lutein, diatoxanthin or fucoxanthin.
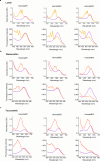
Absorbance change (up) and fluorescence excitation spectra (bottom) of HeimdallR1, 2 and 3 upon incubation with (orange) or without (purple) lutein (a), diatoxanthin (b), and fucoxanthin (c); emissions were recorded at 720 nm. The results for HeimdallR1 (also shown in Figs. 1 and 3) are shown for reference. Source data
Extended Data Fig. 6
Extended Data Fig. 6. Absorption spectra of purified HeimdallR1 with and without lutein or fucoxanthin and pH dependence of the absorption.
a, UV–vis absorption spectra: HeimdallR1 alone (left, purple), HeimdallR1 complexed with lutein (middle, yellow), and HeimdallR1 complexed with fucoxanthin (right, red). To estimate the λamax of the retinal in HeimdallR1, the absorption spectra of pure xanthophylls (blue) were subtracted from those of HeimdallR1 complexed with each xanthophyll (green). Since the peak positions of pure xanthophylls slightly differ from those complexed with HeimdallR1, the spectra of pure xanthophylls were manually shifted so that the peak positions coincides between the spectra of pure xanthophylls and HeimdalR1-xanthophyll complexes. Pictures of purified proteins are shown next to the corresponding results. b, Absorption spectra (top) and the different absorption spectra (bottom), and c, pH titration curves for the calculation of pKa were measured depending on acidic (left) and alkaline (right) pH changes. The red-shifted (red arrow) and blue-shifted (blue arrow) absorption spectra at each pH are indicated by arrows. The pH titration curves were analyzed using the Henderson–Hasselbalch equation. d, Color protein changes upon acid-basic titration. Source data
Extended Data Fig. 7
Extended Data Fig. 7. Influence of lutein or fucoxanthin on the retinal photoisomerization in HeimdallR1 at 77 K.
UV-visible (a, b) and FTIR (c-h) spectra obtained for lipid-reconstituted HeimdallR1 with (red; H(F)) or without (black; H(-)) fucoxanthin (top) and HeimdallR1 with (red; H(L)) or without (black; H(-)) lutein (middle) are compared to those for lipid-reconstituted Kin4B8-xanthorhodopsin with (green; K(L)) or without (black; K(-)) lutein (bottom) previously published. a, UV-visible absorption spectra of H(F) (red) or H(-) (black) (top), H(L) (red) or H(-) (middle), and K(L) (green) or K(-) (black) (bottom) at 77 K. One division of the y-axis corresponds to 1.0 absorbance units. b, Difference UV-visible spectra upon illumination of H(F) (red) or H(-) (black) (top), H(L) (red) or H(-) (black) (middle), and K(L) (green) or K(-) (black) (bottom) at 77 K. Hydrated films of lipid-reconstituted protein were illuminated at 540 nm light, which forms the red-shifted K intermediate. One division of the y-axis corresponds to 0.08 absorbance units. c, Light-minus-dark difference FTIR spectra upon illumination of H(F) (red) or H(-) (black) (top), H(L) (red) or H(-) (black) (middle), and K(L) (green) or K(-) (black) (bottom) at 77 K. Hydrated films of lipid-reconstituted protein with H2O were first illuminated at 540 nm light (solid lines), which forms the K intermediate, and the K intermediate was then reverted by illumination at >590 nm light (dotted lines). Spectral acquisition was repeated to improve signal-to-noise ratio. Positive and negative signals originate from the K intermediate and unphotolyzed state, respectively. One division of the y-axis corresponds to 0.0032 absorbance units. d, Enlarged spectra of the C = C stretching frequency region of the retinal chromophore (1600-1450 cm−1) from (c). Negative peaks are different between H(F) (1534 cm−1) and H(-) (1532 cm−1) (top) or between H(L) (1534 cm−1) and H(-) (1532 cm−1) (middle), but not for K(L) and K(-). One division of the y-axis corresponds to 0.003 absorbance units. e, Enlarged spectra of the C-C stretching frequency region of the retinal chromophore (1250-1150 cm−1) from (c). Spectra are identical with and without xanthophylls. One division of the y-axis corresponds to 0.002 absorbance units. f, Enlarged spectra of the hydrogen out-of-plane (HOOP) vibrational region of the retinal chromophore (1020-945 cm−1) from (c). Positive peaks are different between H(F) (986 cm−1) and H(-) (985 cm−1) (top) or between H(L) (986 cm−1) and H(-) (985 cm−1) (middle), but not for the 960-cm−1 band (bottom). One division of the y-axis corresponds to 0.0015 absorbance units. g, Spectral comparison of the HOOP bands between H2O (red or green) and D2O (blue) hydrations. Down-shifts of the positive peaks at 986 cm−1 (top, middle) and 960 cm−1 (bottom) show that these HOOP bands originate from the Schiff base region. One division of the y-axis corresponds to 0.0015 absorbance units. h, Enlarged spectra of the amide-I region of the peptide backbone (1680-1575 cm−1) from (c). Spectra are identical with and without xanthophylls. One division of the y-axis corresponds to 0.001 absorbance units. Source data
Extended Data Fig. 8
Extended Data Fig. 8. Structural features of HeimdallR1.
a, Size-exclusion chromatography profile of the HeimdallR1 bound to fucoxanthin. The relative absorbance at 280 nm, 460 nm and 550 nm is shown in the chromatogram (left panel). The peak fraction (indicated by a black bar) was analyzed by SDS-PAGE (right panel). b, HeimdallR1 crystals in lipidic mesophase. c, Crystal packing of HeimdallR1. d, Key rhodopsin proton pump motifs in HeimdallR1. Black dashed lines indicate hydrogen-bonding interactions. Red spheres indicate water molecules. eg, Structural comparison of HeimdallR1 with Kin4B8-xanthorhodopsin (PDB ID: 8I2Z) and green proteorhodopsin (GPR; PDB ID: 7B03), from the membrane plane (e), the extracellular side (f) and the intracellular side (g). Notably, ICL3 of HeimdallR1 forms a membrane-extending α-helix. h, Interaction between ICL3 and TM6 in HeimdallR1. Black dashed lines indicate hydrogen-bonding interactions. Red spheres indicate water molecules. i, Sequence alignment of HeimdallRs around ICL3. The sequence alignment was created using ClustalW and ESPript 3.0 servers. Boxes indicate α-helices. Source data
Extended Data Fig. 9
Extended Data Fig. 9. Simulation features of HeimdallR1 bound to lutein and fucoxanthin.
a, HeimdallR1. b, HeimdallR1 with lutein. c, HeimdallR1 with fucoxanthin. d, Kin4B8-xanthorhodopsin with zeaxanthin. ATR — all-trans-retinal. Black dashed lines indicate hydrogen bonds.
Extended Data Fig. 10
Extended Data Fig. 10. Electronic transitions in HeimdallR1/xanthophyll complexes.
Energy level diagram along with the nature of the excited states (LE: local excitation; CT: charge transfer), and natural transition orbitals (isovalue = 0.01 a.u.) displaying the dominant orbitals involved in the electronic transitions of the first three excited states in HeimdallR1/xanthophyll with lutein (a) and fucoxanthin (b). The subscript denotes excitation in retinal (R), lutein (L), fucoxanthin (F) or transition from retinal to the respective xanthophyll. The transition orbitals are shown only for those with contribution greater than 5% towards the excited state (transition contribution between each pair of orbitals is marked in the figure).

Similar articles

References

    1. Rozenberg, A., Inoue, K., Kandori, H. & Béjà, O. Microbial rhodopsins: the last two decades. Annu. Rev. Microbiol.75, 427–447 (2021). - PubMed
    1. Finkel, O. M., Béjà, O. & Belkin, S. Global abundance of microbial rhodopsins. ISME J.7, 448–451 (2013). - PMC - PubMed
    1. DeLong, E. F. & Béjà, O. The light-driven proton pump proteorhodopsin enhances bacterial survival during tough times. PLoS Biol.8, e1000359 (2010). - PMC - PubMed
    1. Munson-McGee, J. H. et al. Decoupling of respiration rates and abundance in marine prokaryoplankton. Nature612, 764–770 (2022). - PMC - PubMed
    1. Balashov, S. P. et al. Xanthorhodopsin: a proton pump with a light-harvesting carotenoid antenna. Science309, 2061–2064 (2005). - PMC - PubMed

MeSH terms

LinkOut - more resources