

Increased weight-load improves body composition by reducing fat mass and waist circumference, and by increasing lean mass in participants with obesity: a single-centre randomised controlled trial
- PMID: 40442671
- PMCID: PMC12123769
- DOI: 10.1186/s12916-025-04143-6
Increased weight-load improves body composition by reducing fat mass and waist circumference, and by increasing lean mass in participants with obesity: a single-centre randomised controlled trial
Abstract
Background: To investigate the effects of increased weight-loading on body weight, body composition, fat mass distribution, physical activity and energy balance in individuals with obesity.
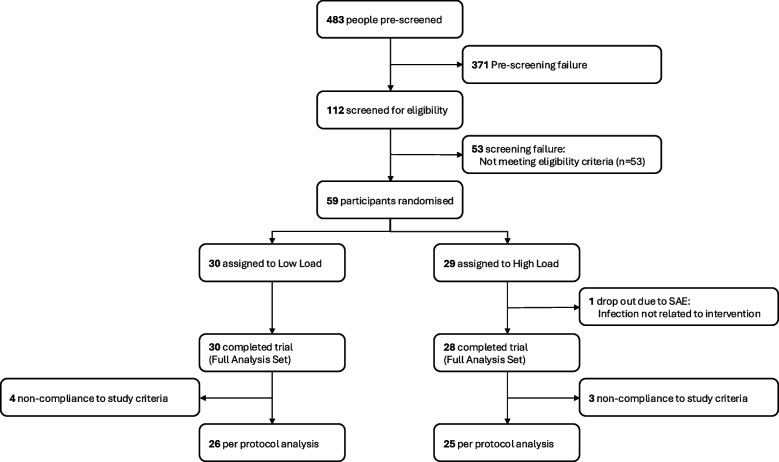
Methods: This single-centre non-blinded randomised controlled trial was conducted from August 1, 2021, through February 28, 2022. Adults with obesity class 1 (body mass index, BMI 30-35 kg/m2) were assigned to wear either a heavy (high load; 11% of body weight, n = 28) or light (low load; 1% of body weight, n = 30) weight vest for 8 h per day over 5 weeks.
Results: High-load treatment reduced fat mass (mean difference - 2.60%; 95% CI - 3.79, - 1.41) and increased lean mass (mean difference 1.40%; 95% CI 0.37, 2.42), with no significant effect on body weight. Fat mass reductions were primarily observed in weight-loaded regions but not in the non-weight-bearing regions such as the arms. Waist circumference decreased (mean difference - 2.26%; 95% CI - 3.81, - 0.71) in the high-load group compared to the low-load group. Despite these beneficial changes, sedentary time was higher in the high-load group (mean difference 4.69%; 95% CI 0.98, 8.39) compared to the low-load group, while energy expenditure and energy intake remained unchanged.
Conclusions: Increased weight-loading reduced fat mass and increased lean mass, resulting in a healthier body composition. These effects were achieved despite no increase in physical activity. The fat mass-reducing effect was primarily seen in weight-loaded regions, implying local adaptation to the increased loading.
Trial registration: Registered at ClinicalTrials.gov (NCT04697238) in 2021.
Keywords: Body composition; Energy balance; Fat mass distribution; Obesity; Standing position; Weight-bearing; Weight-loading.
© 2025. The Author(s).
Conflict of interest statement
Declarations. Ethics approval and consent to participate: The trial was approved by the Swedish Ethical Review Authority (registration number 2021–00095) and was conducted in accordance with the Declaration of Helsinki and the International Conference on Harmonization Guidelines (ICH) for Good Clinical Practice (GCP). All participants provided written informed consent before undertaking any study procedures. Competing interests: The authors declare no competing interests.
Figures


References
-
- World Health Organization. Obesity and overweight. Obesity and overweight. 2024. https://www.who.int/news-room/fact-sheets/detail/obesity-and-overweight.
-
- Phelps NH, Singleton RK, Zhou B, Heap RA, Mishra A, Bennett JE, et al. Worldwide trends in underweight and obesity from 1990 to 2022: a pooled analysis of 3663 population-representative studies with 222 million children, adolescents, and adults. Lancet. 2024. 10.1016/S0140-6736(23)02750-2. - PMC - PubMed
Publication types
MeSH terms
Associated data
Grants and funding
LinkOut - more resources
Full Text Sources
Medical
