. 2025 May 30;24(1):157.
doi: 10.1186/s12943-025-02351-5.

Targeting BATF2-RGS2 axis reduces T-cell exhaustion and restores anti-tumor immunity

Affiliations

Targeting BATF2-RGS2 axis reduces T-cell exhaustion and restores anti-tumor immunity

Xuyu Gu et al. Mol Cancer. .

Erratum in

Abstract

Objective: This study aims to investigate the role of RGS2 in immune regulation in lung cancer (LC) and explore the regulatory relationship between RGS2 and BATF2 in modulating T cell exhaustion and tumor immune evasion.

Methods: Single-cell transcriptome-based analysis was performed to identify CD8+ T-cell profiles and regulatory factors in six LC patients receiving neoadjuvant PD-1 blockade therapy. Mouse 3LL cells or murine tumor organoid models were transplanted into wild-type, RGS2 knock-out (RGS2-/-), or BATF2 knock-out (BATF2-/-) mice to analyze the effects of RGS2 and BATF2 on tumor growth, metastasis, and immune cell infiltration. CD8+ from these mice were isolated and co-cultured with cancer cells to analyze T cell cytotoxicity in vitro. The transcriptional regulation of RGS2 by BATF2 was analyzed using luciferase reporter assays.

Results: RGS2 was highly expressed in CD8+ T-exhausted (Tex) cells and was associated with pro-inflammatory pathways. High RGS2 expression predicted poor clinical outcomes and limited response to PD-1/PD-L1 blockade therapy. In RGS2-/- mice, tumor metastasis and angiogenesis were suppressed, CD8+ effector T cells were enhanced, and T cell exhaustion markers were reduced. BATF2 was identified as a key transcriptional regulator of RGS2, promoting T cell exhaustion through inhibition of CXCL13 secretion. Knockdown of BATF2 or RGS2 impaired lung cancer cell proliferation and enhanced sensitivity to NK cell-mediated cytotoxicity in vitro. In BATF2-/- mice, the populations of immune active CD8+ T cells were increased, while exhausted T cells were reduced, leading to improved anti-tumor immune responses.

Conclusions: RGS2, regulated by BATF2, plays a critical role in driving T cell exhaustion and tumor immune evasion in LC. Targeting the BATF2-RGS2 axis may enhance the effectiveness of immunotherapy by reversing T cell exhaustion and improving anti-tumor immunity.

Keywords: BATF; CXCL13; Immunosuppression; Lung cancer; RGS2; T-cell exhaustion.


Conflict of interest statement

Declarations. Ethics approval and consent to participate: This study and included experimental procedures were approved by the institutional animal care and use committee of Zhongda Hospital, School of Medicine, Southeast University (approval NO.20210301085). All animal housing and experiments were conducted in strict accordance with the institutional guidelines for the care and use of laboratory animals. Competing interests: The authors declare no competing interests.

Figures
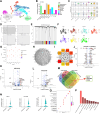
Fig. 1
Fig. 1
RGS2 plays a crucial role in CD8+ Tex cells. A T cell clustering and subgrouping; cells are assigned into 9 subgroups. B Proportion of T cell subgroups. C Expression of marker genes in T cell subgroups. D Choosing the optimal soft threshold parameter for transforming the co-expression similarity matrix into an adjacency matrix. E Single-cell WGCNA gene expression hierarchical clustering. F UMAP dimensionality reduction plot showing the gene expression levels in co-expression modules in CD8+ T cell subgroups. G The blue module has the strongest connection with Tex in the Bubble Chart, depicting the correlation between each co-expression module and T cell subsets. H Co-expression network of gene sets within the blue module. I MCC algorithm selects the top 10 genes from the blue module. J A volcano plot is showing the genes that CD8+ Tex and naïve CD8+ cells express differently in GSE176021. K The GSE218258 dataset’s volcano plot displays the genes that exhibit differential expression. L The GSE229353 dataset’s volcano plot of differentially expressed genes. M Intersection of 3 datasets, GSE218258, GSE229353, and GSE176021, with the top 10 genes from the blue module, resulting in three genes, NEU1, CACYBP, and RGS2. N Expression of NEU1, CACYBP, and RGS2 genes in CD8+ Tex vs naïve CD8+ T cells. O GO enrichment analysis of genes with variable expression. P KEGG enrichment analysis of genes that exhibit differential expression
Fig. 2
Fig. 2
High RGS2 levels predict poor outcomes and less benefit from PD-1/PD-L1 blockade therapy. A Differential expression of NEU1, CACYBP, and RGS2 between MPR and Non-MPR patients. B The TCGA database was used to analyze the expression of NEU1, CACYBP, and RGS2 in tumor and surrounding non-tumor tissues. C Gene survival analysis of NEU1, CACYBP, and RGS2. D A volcano plot showing the genes that differ in expression between the RGS2 high and low expression groups. E GO enrichment analysis of DEGs. F KEGG enrichment analysis of of DEGs. G Genes with differential expression: GSEA enrichment analysis. H Expression of the TNFA SIGNALING VIA NFKB pathway in MPR patients after anti-PD-1 treatment analyzed using the AUCell algorithm. I Correlation of RGS2 expression levels with ESTIMATE score, Immune score, and Stromal score studied using the ESTIMATE algorithm. J Relationship between the high and low expression levels of RGS2 and immunotherapy response
Fig. 3
Fig. 3
Inhibition of RGS2 suppresses inflammation and immunosurveillance in aggressive murine LC. A Schematic diagram for animal treatment: mouse 3LL cells were injected into WT or RGS2−/− mice through the tail vein. B-C The number of metastatic foci that 3LL formed metastatic nodules in the mice’s lung and liver tissues determined using HE staining. D-E IHC was used to determine the staining intensities of VIM and SDF1 in the metastatic nodules in the lung and liver tissues. F-G Immunofluorescence staining to measure the staining intensity of VEGFA and CD31 in mouse lung and liver tissues. H IHC to measure the positive staining intensity for PD-1, CTLA4, and TIM-3 in lung and liver tissues; I, FACS to analyze the populations of CD8+PD-1+, CD8+CTLA4+, and CD8+TIM3+ cells in the mouse lung and liver tissues. J Schematic diagram of the isolation of spleen lymphocytes from WT or RGS2−/− mice and stimulation of CD3/CD28 antibodies to induce T cells. K RT-qPCR and WB to detect the levels of CTLA4, TCF7, PD-1, and CD8 in T cells. L ELISA to measure the quantities of cytokines released by T cells. Each dot represents one independent experiment or data from one animal. ****P < 0.0001
Fig. 4
Fig. 4
RGS2 facilitates the progression of lung cancer through immunosuppression in the tumor microenvironment. A Schematic representation of MTO injection into WT or RGS2−/− mice. B Gross images of the lung tissues and WT or RGS2−/− mice RGS2 with or without MTO burden. C tumor burden in lung tissues determined using HE staining. D number of lymph node metastasis, liver metastasis, and lung metastasis in mice. E–F WB analysis to detect the levels of phosphorylation of IκBα, p65 JUN, and p38, IKKBKB and p65 in primary and liver metastatic nodules of mice. G-H FACS to detect the number of CD206+Ly6 C+ cells infiltrated in primary and liver metastatic nodules. I-J IHC to detect the staining intensity of PD-1, PD-L1, CTLA4, Galectin-9 in primary and liver metastatic nodules. K-L Immunofluorescence staining to confirm the number and distribution of CD8+GZMB+ or CD8+VISTA+ in metastatic primary and liver metastatic nodules. M Kaplan–Meier analysis of the mouse survival cycle. Each dot represents one independent experiment or data from one animal. *P < 0.05, **P < 0.01, and ****P < 0.0001
Fig. 5
Fig. 5
RGS2 is regulated by BATF. A Schematic diagram of the pGL3 luciferase reporter vectors that include the wild-type (wt) RGS2 promoter sequence, as well as the mutant vector. B The luciferase reporter assay validates the influence of BATF2 on the transcriptional activity of the luciferase vectors. C-D HEK293 T cells were transfected with BATF2 overexpression plasmids at different concentrations, followed by detection of RGS2 mRNA and protein levels. E Schematic diagram of the isolation of spleen lymphocytes from WT, RGS2−/−, or BALF−/− mice and stimulation of CD3/CD28 antibodies to induce CD8+ T cells. These stimulated CD8+ T cells were co-cultured with mouse LC cell lines 3LL and KLN205 in Transwell systems. F-G mRNA and protein levels of RGS2 in CD8+ T cells isolated from WT, RGS2−/−, or BALF−/− mice. H–K CD8+ T cells were co-cultured with 3LL and KLN205 at an E:T = 10:1, and the tumor cell killing rates in 1 st-4 th expansion were analyzed. L ELISA to measure the contents of cytokines (IL-2, IFN-γ, GZMB, and TNFA) released by T cells. Each dot represents one independent experiment or data from one animal. *P < 0.05, **P < 0.01, ***P < 0.001, ****P < 0.0001
Fig. 6
Fig. 6
BATF2 inhibits CXCL13 secretion through transcriptional activation of RGS2. A-B mRNA and protein levels of CXCL13 in CD8+ T cells isolated from the spleens of WT, RGS2−/−, and BATF2−/− mice. T cells were stimulated with anti-CD3 (2 μg/mL) and anti-CD28 (2 μg/mL) for 48 h before RNA extraction. C ELISA to measure the CXCL13 contents in the serum of WT and RGS2−/− or BATF2−/− mice. D FACS to measure the populations of CD8+ T cells (CD3+CD8+), DCs (CD11c+CD86+MHCII+), and polymorphonuclear MDSCs (CD11b+Ly6G+) in the lung tissues. E–F IHC to measure the staining intensity for CXCL13 in 3LL-derived metastatic lung nodules or MTO LC tissues. G Administration to 3LL-innoculated RGS2−/− mice using an anti-mCXCL13 antibody (Am) or IgG as control. H The number of 3LL-formed metastatic nodules in the mice's lung tissues. I IHC to measure the staining intensity of VEGFA and CD31 in mouse lung tissues. J Immunofluorescence staining to confirm the positive expression and distribution of CD8+GZMB+ or CD8+VISTA+ in metastatic nodules in mouse lung tissues. K FACS to analyze the proportions of CD8+GZMB+ or CD8+VISTA+ T cells in mouse lung tissues. L IHC to measure the staining intensity for PD-1, CTLA4, and Galectin-9 in lung tissues. M Schematic diagram of the addition of the anti-CXCL13 antibody to the co-culture system of CD3/CD28-stimulated CD8+ T cells from WT, RGS2−/−, or BALF−/− mice and mouse 3LL and KLN205 cells. N–O the tumor cell killing rates in 1 st-4 th expansion were analyzed. Each dot represents one independent experiment or data from one animal. *P < 0.05, **P < 0.01, ***P < 0.001, ****P < 0.0001
Fig. 7
Fig. 7
Higher anti-tumor immune activity in BATF2−/− mice. A Schematic representation of MTO inoculation and subsequent treatment with anti-CD8 antibodies in WT and BATF2−/− mice. B Gross images of the lung tissues bearing tumor burdens in each group, and number of lymph node metastasis, liver metastasis, and lung metastasis in mice. C Positive staining of the apoptosis marker C-Cas-3 in MTO-formed tumor tissues. D-F FACS to detect the populations of MDSCs (CD11b+Ly6G+), CD8+ T cells (CD3+CD8+), and Treg (CD3+CD4+CD25+Foxp3+) in MTO-formed tumor tissues. G Fluorescence co-localization assay to detect the number of DESMIN+EpCAM+ cells in MTO-formed tumor tissues. H-I RT-qPCR and WB to detect the mRNA and protein levels of CD8+ T dysfunction markers (TIM-3, LAG-3, CD38, 2B4, and TBX21) and function markers (TCF7, CD122, CD127, CD45RA, and CCR7). J IHC to detect the positive staining of CD31 and VEGFA staining in the MTO-formed tumor tissues. K FACS to measure the populations of DCs (CD11c+CD86+MHCII+), CD8+TIM3+ T cells, and CD8+PD-1+ T cells in the MTO-formed tumor tissues. Each dot represents one independent experiment or data from one animal. *P < 0.05, **P < 0.01, ***P < 0.001, ****P < 0.0001
Fig. 8
Fig. 8
Loss of BATF2 blocks T cell exhaustion and increases CD8+ T cell function in primary and metastatic tissues. A-B Immunofluorescence staining to confirm the positive expression and distribution of CD8+GZMB+ or CD8+VISTA+ in mouse primary lung tumors and liver metastatic tumors. C-D RT-qPCR and WB to detect the mRNA and protein levels of CD8+ T dysfunction markers (TIM-3, LAG-3, CD38, 2B4, and TBX21) and function markers (TCF7, CD122, CD127, CD45RA, and CCR7). E FACS to identify the populations of CD8+CD69+, CD8+IFNγ+, CD8+TCF7+, CD8+CTLA4+, CD8+PD1+, and CD8+TIM3+ cells in the primary lung tumors and liver metastatic tumors. F Schematic diagram of the isolation of spleen lymphocytes from WT, BATF2−/−, and RGS2−/− mice and stimulation of CD3/CD28 antibodies to induce T cells. G-H FACS to identify the populations of CD8+CD69+, CD8+IFNγ+, CD8+TCF7+, CD8+CTLA4+, CD8+PD1+, and CD8+TIM3+ subsets in the extracted cells. Each dot represents one independent experiment or data from one animal. *P < 0.05, **P < 0.01, ***P < 0.001, ****P < 0.0001
Fig. 9
Fig. 9
Graphical abstract. A schema showing BATF2 binds to the RGS2 promoter and activates its transcription. Knockout of BATF2 or RGS2 reduces exhaustion and improves anti-tumor immunity of CD8+ T cells in LC through CXCL13 activation

References

    1. Thai AA, et al. Lung cancer. Lancet. 2021;398(10299):535–54. - PubMed
    1. Schabath MB, Cote ML. Cancer progress and priorities: lung cancer. Cancer Epidemiol Biomarkers Prev. 2019;28(10):1563–79. - PMC - PubMed
    1. Bade BC, Dela Cruz CS. Lung cancer 2020: epidemiology, etiology, and prevention. Clin Chest Med. 2020;41(1):1–24. - PubMed
    1. Wadowska K, et al. Genetic markers in lung cancer diagnosis: a review. Int J Mol Sci. 2020;21(13):4569. - PMC - PubMed
    1. Lahiri A, et al. Lung cancer immunotherapy: progress, pitfalls, and promises. Mol Cancer. 2023;22(1):40. - PMC - PubMed

MeSH terms