. 2025 May 29;23(1):251.
doi: 10.1186/s12964-025-02267-z.

GPR56/ADGRG1 induces biased Rho-ROCK-MLC and JAK-STAT3 signaling to promote amoeboid-like morphology and IL-6 upregulation in melanoma cells

Affiliations

GPR56/ADGRG1 induces biased Rho-ROCK-MLC and JAK-STAT3 signaling to promote amoeboid-like morphology and IL-6 upregulation in melanoma cells

Kuan-Yeh Huang et al. Cell Commun Signal. .

Abstract

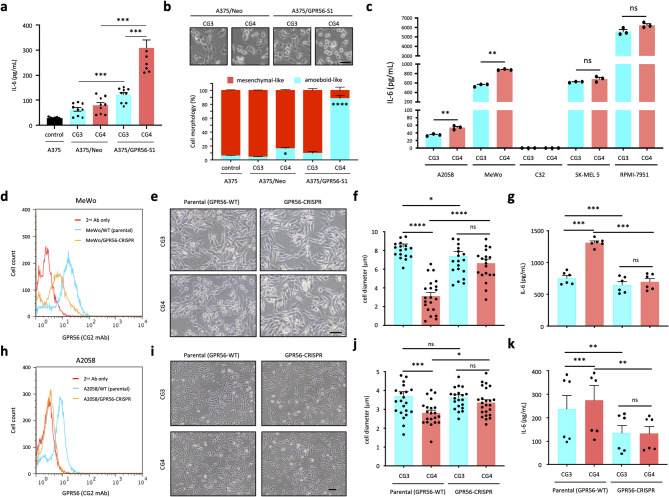
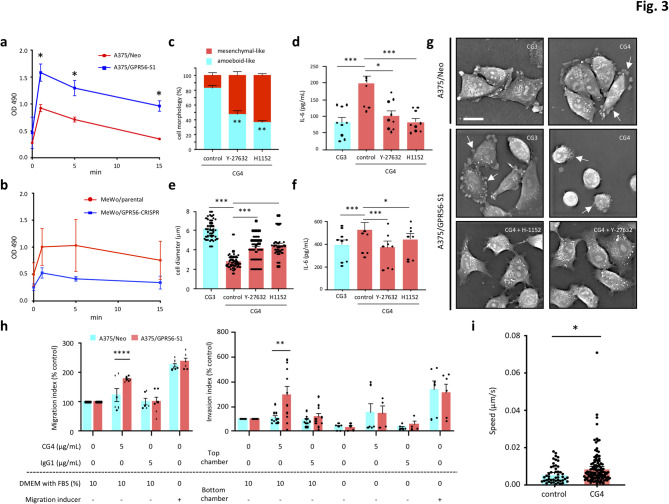
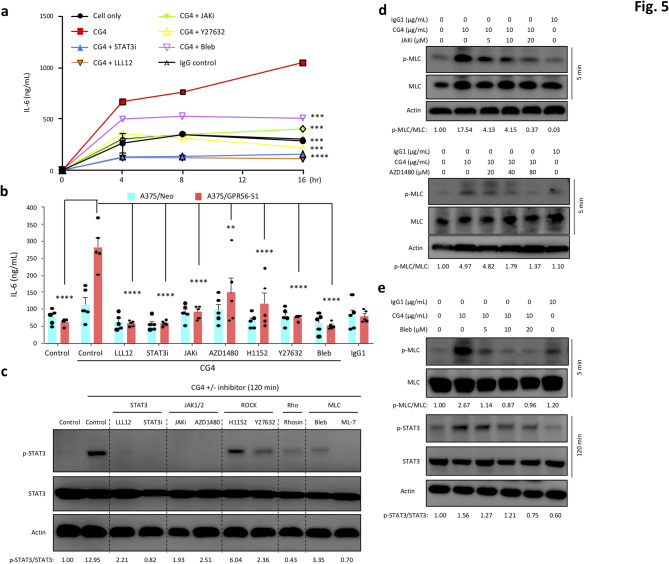
Background: GPR56/ADGRG1 is an adhesion G protein-coupled receptor involved in cell-matrix interactions and metastasis of human melanoma cells. Previously, we demonstrated that GPR56 activation in melanoma cells triggers Gα12/13-RhoA signaling, leading to increased IL-6 production and enhanced cell migration. Yet little is known of the downstream signaling effectors and their specific roles in regulating melanoma cellular phenotypes.

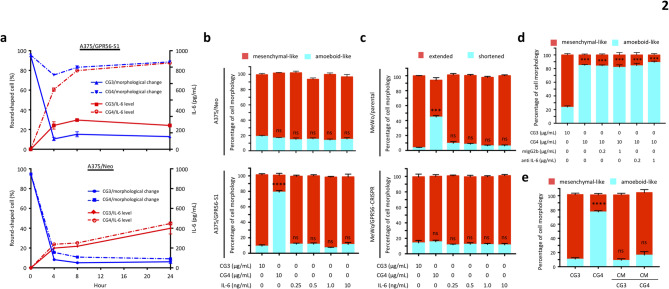
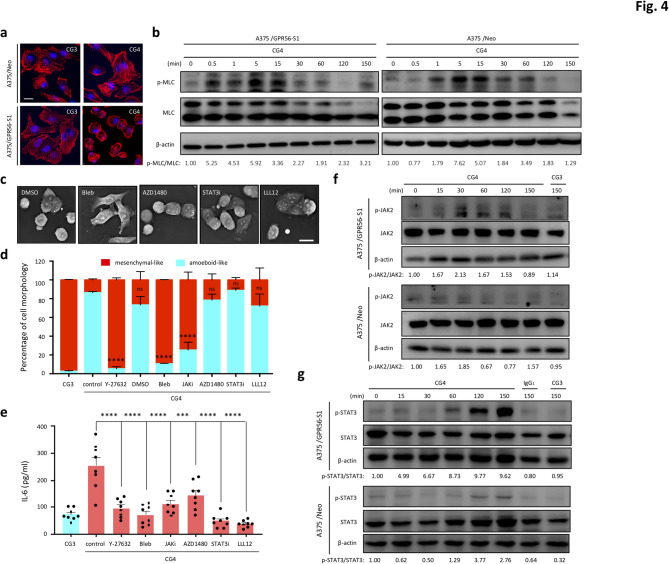
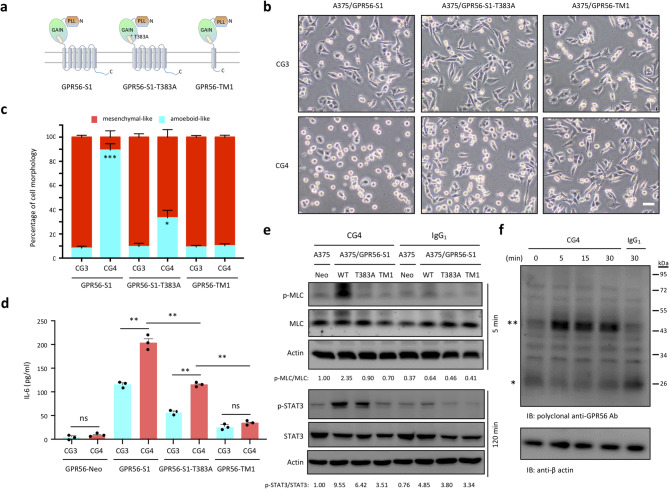
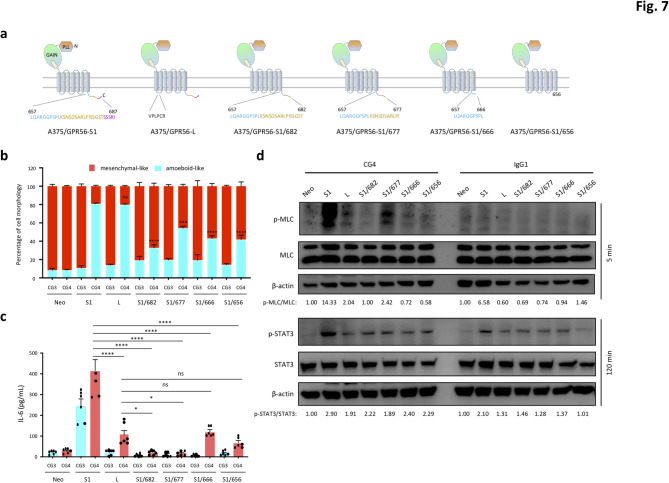
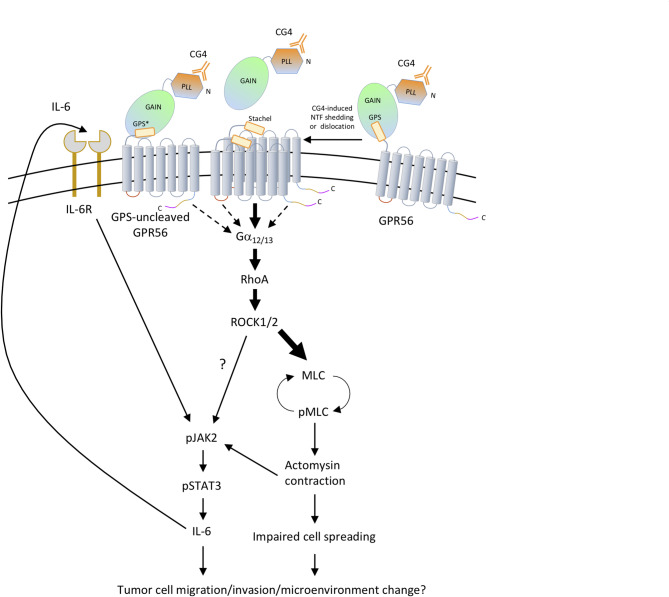
Results: In this study, we show that GPR56 activation induces Rho-ROCK-MLC and JAK-STAT3 signaling, which temporally and differentially drive amoeboid-like morphology and IL-6 upregulation. Interestingly, GPR56-induced JAK-STAT3 activation is partially regulated by Rho-ROCK-MLC signaling but not vice versa. Moreover, receptor auto-proteolysis modulates the magnitude of GPR56-mediated signaling, and its unique intracellular regions contribute to the selective regulation of unique signaling pathways and associated cellular phenotypes.

Conclusion: Our findings reveal complex GPR56-mediated biased signaling through the Rho-ROCK-MLC and JAK-STAT3 pathways, highlighting these networks as potential therapeutic targets for modulating distinct tumorigenic phenotypes in human melanoma cells.

Keywords: Adhesion GPCR; Cytoskeletal remodelling; GPR56; IL-6; Melanoma; Signalling.


Conflict of interest statement

Declarations. Ethics approval and consent to participate: Not applicable. Consent for publication: Not applicable. Competing interests: The authors declare no competing interests. Competing financial interests: The authors declare no competing financial interests.

Figures

Fig. 1
Fig. 1
GPR56 activation induces IL-6 up-regulation and morphological change in human melanoma cell lines. (a) Analysis of IL-6 levels in the supernatants of A375/Neo and A375/GPR56-S1 cells incubated with immobilized CG3 and CG4 mAbs for 24 h. Untreated parental A375 cells were included as a negative control (n = 9). (b) Analysis of cell morphologies of A375/Neo and A375/GPR56-S1 cells cultured for 24 h on plates coated with CG3 and CG4 mAbs. Images in the top panel showed morphologies of mAb-treated cells, while the plot in the lower panel represented the percentage of elongated mesenchymal-like vs. round-shaped amoeboid-like cells from 3 random fields per group (n = 3). (c) Analysis of IL-6 levels in the supernatants of A2058, MeWo, C32, SK-MEL5, and RPMI-7951 melanoma cell lines incubated with immobilized CG3 and CG4 mAbs for 24 h (n = 3). (d, h) FACS analysis of surface GPR56 expression levels in parental and GPR56-CRISPR MeWo (d) and A2058 (h) cells as indicated. (e, f, I, j) Morphological changes of parental and GPR56-CRISPR MeWo (e, f) and A2058 (i, j) cells incubated with immobilized CG3 and CG4 mAbs were shown as microscopy images (e, i) and size changes in cell diameter (f, j) at 24 h of culture (f, n = 21; j, n = 24). Analysis of IL-6 levels in the supernatants of parental and GPR56-CRISPR MeWo (g) and A2058 (k) cells incubated with immobilized CG3 and CG4 mAbs for 24 h (g, n = 6; k, n = 6). Scale bar, 50 μm. Data are presented as means ± SEM from independent experiments performed in triplicate. ns, non-significant
Fig. 2
Fig. 2
Amoeboid-like morphology and IL-6 up-regulation are two independent melanoma cell phenotypes induced by GPR56 activation. (a) Time course analyses of indicated phenotypical changes of A375/Neo and A375/GPR56-S1 cells stimulated with the immobilized CG4 mAb. CG3 was used as a negative control (n = 3). (b, c) Analysis of the effect of exogenous IL-6 on cell morphologies of A375 (b) and MeWo (c) cells as indicated. Cells incubated with immobilized CG3 and CG4 mAbs were included as controls (n = 4). (d) Analysis of the effect of a functional blocking anti IL-6 mAb on CG4-induced amoeboid-like morphology of A375/GPR56-S1 cells. A mouse IgG2b isotype was included as a negative control (n = 3). (e) Analysis of the effect of conditioned medium (CM) of CG3-/CG4-treated A375/GPR56-S1 cells on cell morphology of A375/GPR56-S1 cells (n = 3). Data are presented as means ± SEM from independent experiments performed in triplicate. ns, non-significant
Fig. 3
Fig. 3
GPR56-elicited RHO-ROCK-MLC signalling pathway promotes amoeboid-like morphology, IL-6 up-regulation, and cell migration and invasion in melanoma cells. (a, b) Analyses of active RhoA-GTP levels in A375 (a) and MeWo (b) cells incubated with immobilized CG4 mAb at indicated time points (n = 3). (c-f) Analyses of the effect of two ROCK inhibitors, Y-27,632 and H1152, on CG4-induced amoeboid-like morphology and IL-6 up-regulation of A375/GPR56-S1 cells (c, d) and MeWo cells (e, f) (c, n = 3; d, n = 9; e, n = 50; f, n = 9). (g) High-resolution image analyses of cell morphologies of CG4-treated A375/GPR56-S1 cells in the absence or presence of ROCK inhibitors at 6 h of culture. A375/Neo cells and CG3 mAb treatment were included as negative controls. Scale bar, 20 μm. White arrows indicate cell blebbing. (h) Cell migration and invasion assays of A375/Neo and A375/GPR56-S1 cells under different treatment conditions. Migrated cells were stained and measured by Ext.530/Emi.590 (n = 3). Data were analysed using two-way ANOVA Tukey’s multiple comparisons test. Data are presented as means ± SEM from independent experiments performed in triplicate. (i) Time-lapse cell migration assay of A375/GPR56-S1 cells treated without or with CG4 (5 µg/mL). In total, 48 control cell movements and 120 CG4-treated cell movements were analysed. Data were analysed using the Kolmogorov–Smirnov test. *p < 0.05
Fig. 4
Fig. 4
Differential regulation of amoeboid-like morphology and IL-6 up-regulation by biased RHO-ROCK-MLC and JAK-STAT3 signalling pathways. (a) Confocal fluorescence analysis of F-actin (red) staining patterns in A375/Neo and A375/GPR56-S1 cells incubated with immobilized CG3 and CG4 mAb at 6 h of culture. Cell nucleus was marked by Hoechst staining (blue). Scale bar, 10 μm. (b) Western blotting analysis of p-MLC and total MLC levels of A375/Neo and A375/GPR56-S1 cells incubated with CG4 mAb at indicated time points. (c) High-resolution image analyses of cell morphologies of CG4-treated A375/GPR56-S1 cells at 6 h of culture in the absence or presence of signalling inhibitors as indicated. DMSO was used as a negative control. Scale bar, 20 μm. (d, e) Morphological analysis (d, n = 3) and ELISA analysis of IL-6 levels (e, n = 8) of CG4-treated A375/GPR56-S1 cells in the absence or presence of signalling inhibitors as indicated. Data are presented as means ± SEM from independent experiments performed in triplicate. ns, non-significant. (f, g) Western blotting analyses of p-JAK2 and total JAK levels (f) and p-STAT3 and total STAT3 levels (g) of A375/Neo and A375/GPR56-S1 cells incubated with CG4 mAb at indicated time points. CG3 and an IgG1 isotype were used as negative controls. Probing with the anti β-actin Ab was used to show the equal loading of lysate samples
Fig. 5
Fig. 5
Involvement of the RHO-ROCK-MLC and JAK-STAT3 signalling pathways in GPR56-induced IL-6 up-regulation in melanoma cells. (a) Time course analyses of CG4-induced IL-6 up-regulation of A375/GPR56-S1 cells cultured in the absence or presence of signalling inhibitors as indicated. (b) Analyses of CG4-induced IL-6 up-regulation of A375/Neo and A375/GPR56-S1 cells cultured for 20 h in the absence or presence of signalling inhibitors as indicated (n = 5). Data are presented as means ± SEM from independent experiments performed in triplicate. (c-e) Western blotting analysis of p-MLC and total MLC, p-STAT3 and total STAT3 levels of CG4-stimulated A375/GPR56-S1 cells in the absence or presence of signalling inhibitors as indicated. Cells alone and cells incubated with an immobilized IgG1 were included as negative controls
Fig. 6
Fig. 6
The role of GPS auto-proteolysis and 7TM in regulating GPR56-mediated signalling. (a) Schematic diagrams depict the various recombinant GPR56 receptors analyzed in the study, including the wild-type (S1), GPS cleavage-deficient (S1-T383A), and the first TM only-containing variant (GPR56-TM1). (b, c) Analysis of morphological changes of A375/GPR56-S1, A375/GPR56-S1-T383A and A375/GPR56-TM1 cells incubated with immobilized CG3 and CG4 mAbs at 24 h of culture. Scale bar, 20 μm. The data in (c) represented the percentage of elongated mesenchymal-like cells and round-shaped amoeboid-like cells from 3 different fields (100 total cells per field) of images shown in (b). (d) Analysis of IL-6 levels in the supernatants of A375/Neo, A375/GPR56-S1, A375/GPR56-S1-T383A, and A375/GPR56-TM1 cells incubated with immobilized CG3 and CG4 mAbs for 24 h (n = 3). Data are presented as means ± SEM from independent experiments performed in triplicate. ns, non-significant. (e) Western blotting analysis of p-MLC and total MLC, p-STAT3 and total STAT3 levels of indicated stable A375 cell lines incubated with CG4 or IgG1 at 5 and 120 min, respectively. A375/Neo cells were included as a negative control. (f) Western blotting analysis of the GPR56-CTF subunit in lysates of A375/GPR56-S1 cells following the binding of CG4 mAb at different time points. Blots were probed by a rabbit polyclonal Ab against a GPR56 cytoplasmic peptide sequence. * and ** denote the monomeric and dimeric forms of GPR56-CTF, respectively
Fig. 7
Fig. 7
Differential regulation of GPR56-elicited signalling by unique regions/residues of the 7TM moiety. (a) Schematic diagrams depict the various GPR56 receptor variants analyzed in the study, including the wild-type short form 1 (S1), long form (L), and C-terminally truncated GPR56-S1/682, S1/677, S1/666, and S1/656 receptors. (b, c) Analysis of morphological changes (b) and secreted IL-6 levels (c) of stable A375 cells expressing indicated GPR56 receptor variants incubated with immobilized CG3 and CG4 mAbs at 24 h (n = 5). Data are presented as means ± SEM from independent experiments performed in triplicate. ns, non-significant. (d) Western blotting analysis of p-MLC and total MLC, p-STAT3 and total STAT3 levels of indicated stable A375 cell lines incubated with CG4 or IgG1 at 5 and 120 min, respectively
Fig. 8
Fig. 8
The proposed model of GPR56-mediated signaling in human melanoma cell. The binding of the CG4 mAb to the PLL domain of GPR56 induces GPR56-NTF shedding and formation of dimeric GPR56-CTF, which triggers Gα12/13 coupling and RhoA/ROCK activation. MLC phosphorylation is induced immediately downstream of ROCK and leads to cytoskeletal rearrangement, actomyosin contraction, and amoeboid-like morphology. Additionally, JAK2/STAT3 signaling is activated either directly by ROCK or pMLC-mediated actomyosin contraction to induce IL-6 production, which acts via an autocrine mechanism through the IL-6 receptor (IL-6R) to activate the baseline JAK2/STAT3 signaling activity. GPS cleavage-deficient GPR56 induces a lower signaling output than the fully-cleaved WT receptor, while differential signaling activities are elicited by GPR56 variants with different ICL or cytoplasmic tail sequences

References

    1. Wu V, Yeerna H, Nohata N, Chiou J, Harismendy O, Raimondi F, Inoue A, Russell RB, Tamayo P, Gutkind JS. Illuminating the Onco-GPCRome: novel G protein-coupled receptor-driven oncocrine networks and targets for cancer immunotherapy. J Biol Chem. 2019;294:11062–86. - PMC - PubMed
    1. Dorsam RT, Gutkind JS. G-protein-coupled receptors and cancer. Nat Rev Cancer. 2007;7:79–94. - PubMed
    1. Aust G. Adhesion-GPCRS in tumorigenesis. Adv Exp Med Biol. 2010;706:109–20. - PubMed
    1. Lin HH. Adhesion family of G protein-coupled receptors and cancer. Chang Gung Med J. 2012;35:15–27. - PubMed
    1. Lala T, Hall RA. Adhesion G protein-coupled receptors: structure, signaling, physiology, and pathophysiology. Physiol Rev. 2022;102:1587–624. - PMC - PubMed