

Integrated bioinformatics and network pharmacology to identify and validate macrophage polarization related hub genes in the treatment of osteoarthritis with Astragalus membranaceus
- PMID: 40442788
- PMCID: PMC12124071
- DOI: 10.1186/s13018-025-05799-9
Integrated bioinformatics and network pharmacology to identify and validate macrophage polarization related hub genes in the treatment of osteoarthritis with Astragalus membranaceus
Abstract
Background: Macrophage polarization exacerbates the pathological processes of osteoarthritis (OA). Astragalus membranaceus (AM) can repair chondrocytes and serve as a protective agent for OA. Therefore, the study intended to identify macrophage polarization-related genes (MPRGs) in the treatment of OA with AM.
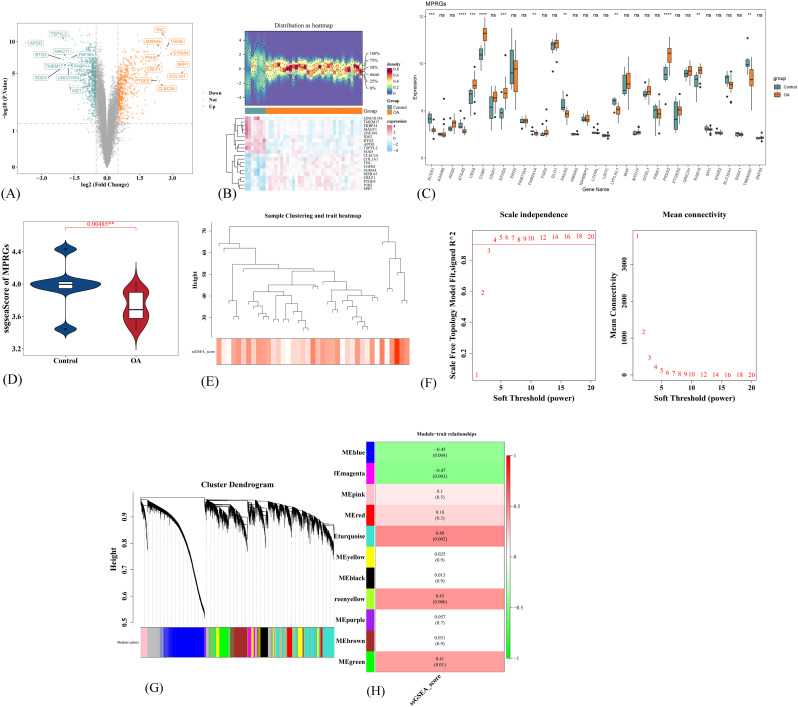
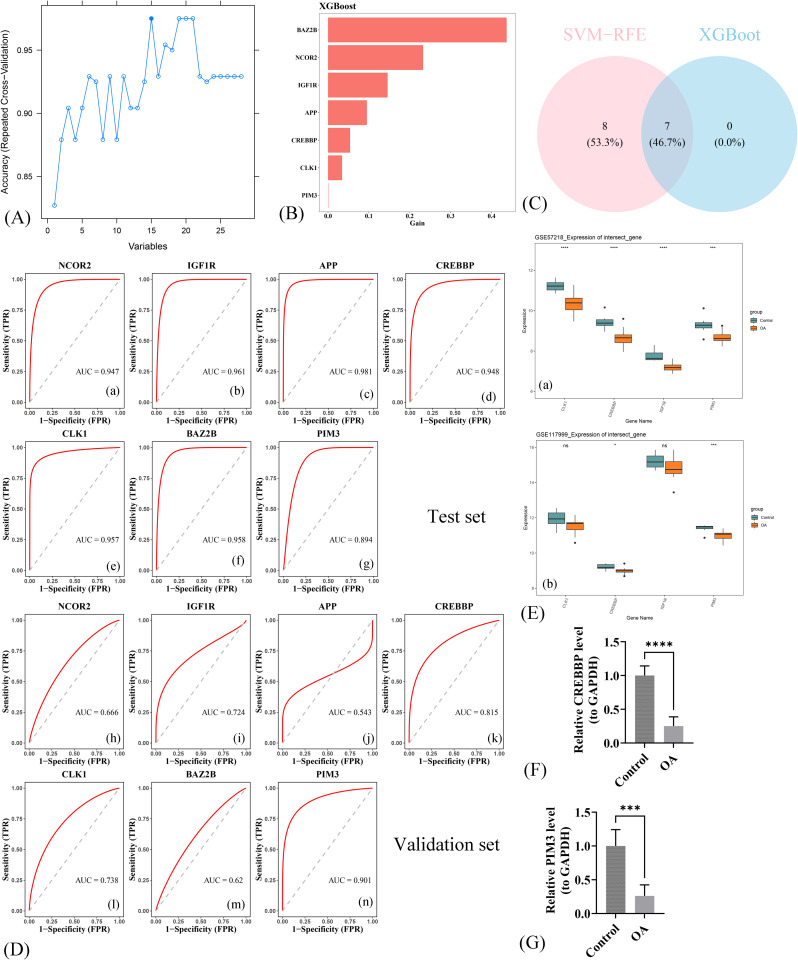
Methods: We utilized data from GSE57218 as training set, while GSE117999 serves as a validation set, all obtained from Gene Expression Omnibus(GEO). The MPRGs were exported from the Molecular Signatures Database. Target genes of AM were obtained by network pharmacology. Differentially expressed genes (DEGs) were identified in OA vs. control groups. Then key module genes were acquired through weighted gene co-expression network analysis (WGCNA) and intersected with DEGs and target genes of AM to obtain candidate genes. Subsequently, the candidate genes were further screened for hub genes by machine learning, receiver operating characteristic (ROC) curve analysis, and expression validation. Further, reverse transcription-quantitative real-time polymerase chain reaction (RT-qPCR) was applied to verify the mRNA expression levels of hub genes. In addition, the mechanism of these hub genes was investigated through enrichment analysis, immune microenvironment analysis, regulatory network construction, and molecular docking.
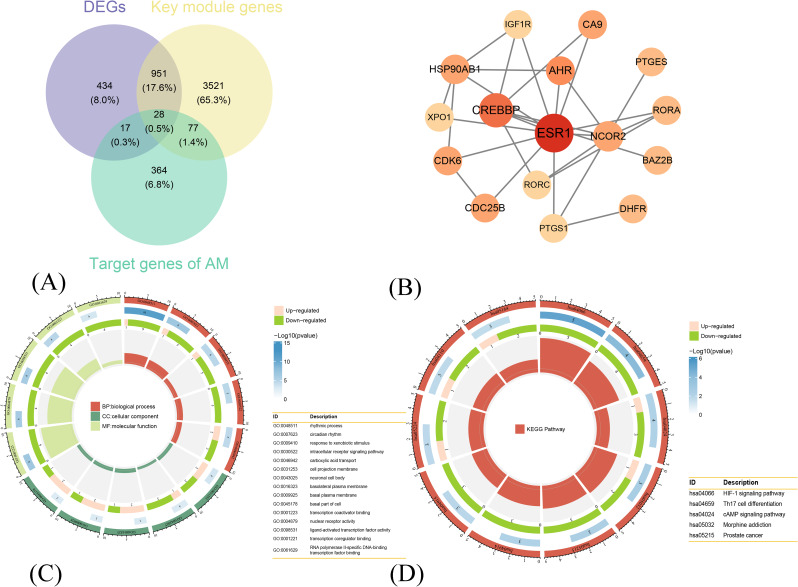
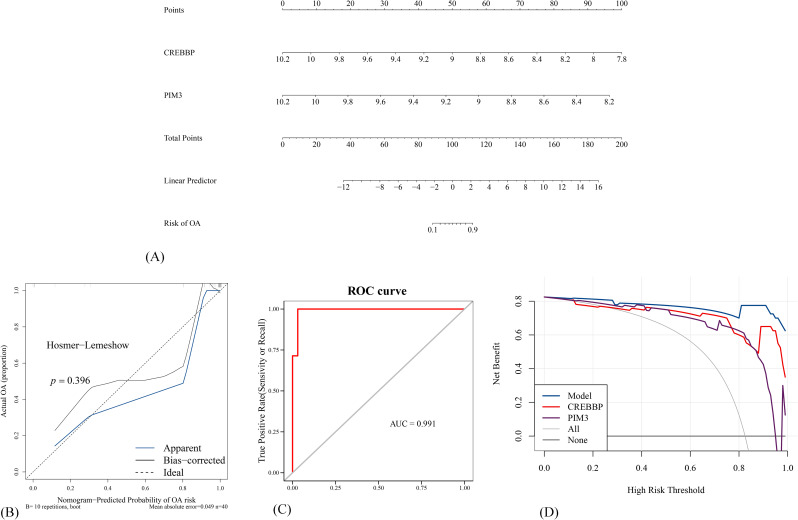
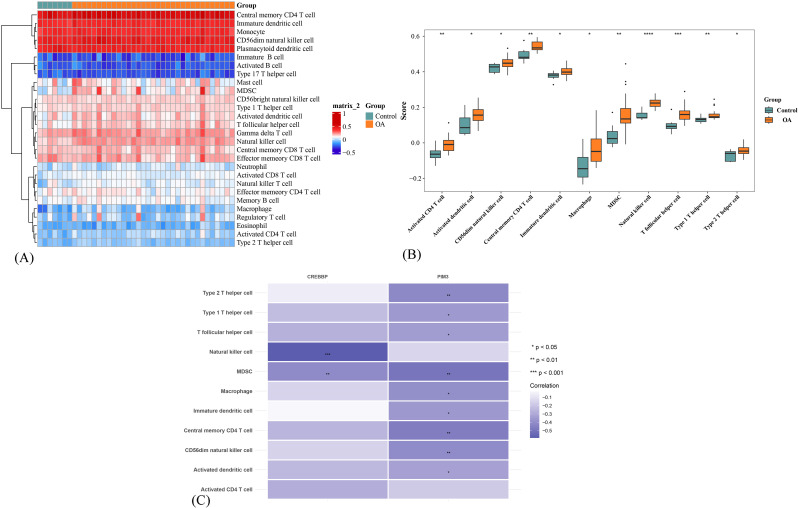
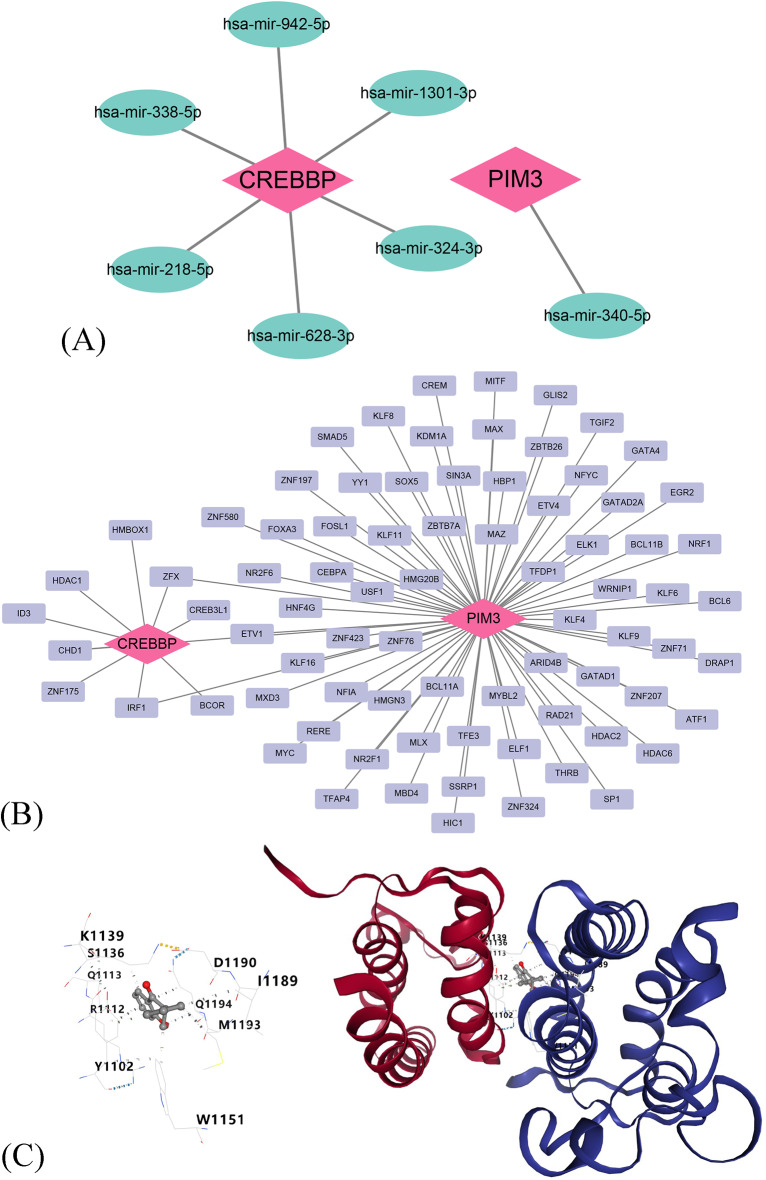
Results: Ultimately, 1,430 DEGs, 4,577 key module genes, and 486 target genes of AM were intersected to derive 28 candidate genes. After machine learning, ROC curve analysis and expression validation, CREBBP and PIM3 were identified. The mRNA expression of tissue CREBBP and PIM3 was significantly decreased in OA compared with the control group. Furthermore, the enrichment analysis indicated that eight pathways, including oxidative phosphorylation, were simultaneously enriched by two hub genes. Microenvironment analysis revealed negative correlations between both hub genes and 11 differential immune cells. We identified that CREBBP and PIM3 were regulated by 6 miRNAs (e.g., hsa-mir-942-5p) and 79 transcription factors (TFs) (e.g., IRF1). Molecular docking experiments indicated that isoflavone strongly bound to CREBBP, while (3R)-3-(2-hydroxy-3,4-dimethoxyphenyl) chroman-7-ol exhibited significant binding affinity for PIM3, suggesting that these two active ingredients were core components of AM in treating OA via hub genes.
Conclusion: This study identified CREBBP and PIM3 as potential focal points for the treatment of OA with AM, providing valuable clues to help treat and predict OA.
Clinical trial number: Not applicable.
Keywords: Astragalus membranaceus; Bioinformatics; Macrophage polarization; Network pharmacology; Osteoarthritis.
© 2025. The Author(s).
Conflict of interest statement
Declarations. Ethics approval: This study was performed in line with the principles of the Declaration of Helsinki. Approval was granted by the Ethics Committee of Shanghai Sixth People’s Hospital. (Approval Number:2021-001). Consent to participate: Informed consent was obtained from all individual participants included in the study. Consent for publication: Not applicable. Competing interests: The authors declare no competing interests.
Figures

Similar articles
-
Identification of shared key genes and pathways in osteoarthritis and sarcopenia patients based on bioinformatics analysis.Zhong Nan Da Xue Xue Bao Yi Xue Ban. 2025 Mar 28;50(3):430-446. doi: 10.11817/j.issn.1672-7347.2025.240669. Zhong Nan Da Xue Xue Bao Yi Xue Ban. 2025. PMID: 40628511 Chinese, English.
-
Integrated multi-omics and machine learning reveals immune-metabolic signatures in osteoarthritis: from bulk RNA-seq to single-cell resolution.Front Immunol. 2025 Jun 16;16:1599930. doi: 10.3389/fimmu.2025.1599930. eCollection 2025. Front Immunol. 2025. PMID: 40589764 Free PMC article.
-
Deciphering Shared Gene Signatures and Immune Infiltration Characteristics Between Gestational Diabetes Mellitus and Preeclampsia by Integrated Bioinformatics Analysis and Machine Learning.Reprod Sci. 2025 Jun;32(6):1886-1904. doi: 10.1007/s43032-025-01847-1. Epub 2025 May 15. Reprod Sci. 2025. PMID: 40374866
-
Medicine for chronic atrophic gastritis: a systematic review, meta- and network pharmacology analysis.Ann Med. 2023;55(2):2299352. doi: 10.1080/07853890.2023.2299352. Epub 2024 Jan 3. Ann Med. 2023. PMID: 38170849 Free PMC article.
-
Exploring the mechanism of ShenGui capsule in treating heart failure based on network pharmacology and molecular docking: A review.Medicine (Baltimore). 2024 Apr 5;103(14):e37512. doi: 10.1097/MD.0000000000037512. Medicine (Baltimore). 2024. PMID: 38579077 Free PMC article. Review.
References
-
- Kloppenburg M, Berenbaum F. Osteoarthritis year in review 2019: epidemiology and therapy. Osteoarthr Cartil. 2020;28(3):242–8. - PubMed
MeSH terms
Grants and funding
LinkOut - more resources
Full Text Sources
Medical
