Application of machine learning algorithms in osteoporosis analysis based on cardiovascular health assessed by life's essential 8: a cross-sectional study
- PMID: 40442859
- PMCID: PMC12123827
- DOI: 10.1186/s41043-025-00941-z
Application of machine learning algorithms in osteoporosis analysis based on cardiovascular health assessed by life's essential 8: a cross-sectional study
Abstract
Background: Life's Essential 8 (LE8) for assessing cardiovascular health (CVH) has been demonstrated to be inversely associated with osteoporosis (OP). This study aims to create a machine learning (ML) model to assess the clinical association value of lifestyle and behavioral factors, assessed by LE8, on OP risk in the United States.
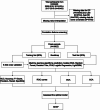
Methods: This cross-sectional analysis utilized data from the National Health and Nutrition Examination Survey (NHANES), encompassing participants aged ≧ 50 with comprehensive LE8 and OP information. Initially, the study compared the characteristics of participants with OP against those with normal bone health. Linear and nonlinear associations of LE8 and OP were analyzed by multifactor logistic regression and restricted cubic spline (RCS). Subsequently, LE8 features were integrated into six distinct ML models for OP analysis. Evaluate model performance using relevant metrics and curves. The best-performing model was further analyzed using SHapley Additive exPlanations (SHAP) to rank and clarify the positives and negatives of the contribution of individual LE8 components.
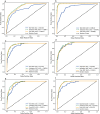
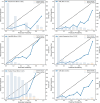
Results: Among 3,902 participants, 364 (9.33%) were identified as having OP. Conventional regression showed that health behaviors (HB) and health factors (HF) in LE8 were negatively and positively correlated with OP, respectively, and that total LE8 was nonlinearly associated with OP. Through comparison of the Area Under the Curve (AUC), Accuracy, F1-Score, Precision, Recall, Specificity, Receiver Operating Characteristic (ROC), Decision Curve Analysis (DCA), and Calibration Curve Analysis (CCA), the optimal performance achieved by the Light Gradient Boosting Machine (LightGBM) model incorporating the 20 features. SHAP analysis revealed that the contributions of LE8 components were ranked as follows: Body Mass Index (BMI) > sleep health > blood glucose > nicotine exposure > blood lipids > blood pressure > Healthy Eating Index-2015 (HEI-2015) > physical activity. Where sleep health, blood lipids, and HEI-2015 were the main negative contributors to OP, BMI was the main positive contributor.
Conclusions: The integration of LE8 with a LightGBM model offers a promising strategy for analysing OP in the American population, underscoring the potential of ML approaches in enhancing clinical assessments.
Keywords: Cardiovascular health; Life’s essential 8; Machine learning; Osteoporosis.
© 2025. The Author(s).
Conflict of interest statement
Declarations. Ethics approval and consent to participate: The National Center for Health Statistics reviewed and approved the study for human participants (Protocol #2005-06, Protocol #2011-17, Protocol #2018-01). All participants signed informed written consent. Research data were open to the public and allowed for further analysis without additional ethical approval. Consent for publication: Not applicable. Competing interests: The authors declare no competing interests.
Figures


References
MeSH terms
LinkOut - more resources
Full Text Sources
Medical
Research Materials
Miscellaneous

