. 2025 Dec;47(1):2508297.
doi: 10.1080/0886022X.2025.2508297. Epub 2025 May 29.

Protective effect of phosphoenolpyruvate carboxykinase 1 on inflammation and fibrotic progression of IgA nephropathy

Affiliations

Protective effect of phosphoenolpyruvate carboxykinase 1 on inflammation and fibrotic progression of IgA nephropathy

Ya-Yin Tan et al. Ren Fail. 2025 Dec.

Abstract

Introduction: Phosphoenolpyruvate carboxykinase 1 (PCK1) is an essential enzyme of the gluconeogenic pathway, which can affect kidney physiology in various ways. Nevertheless, its role in the progression of IgA nephropathy (IgAN) remains to be elucidated.

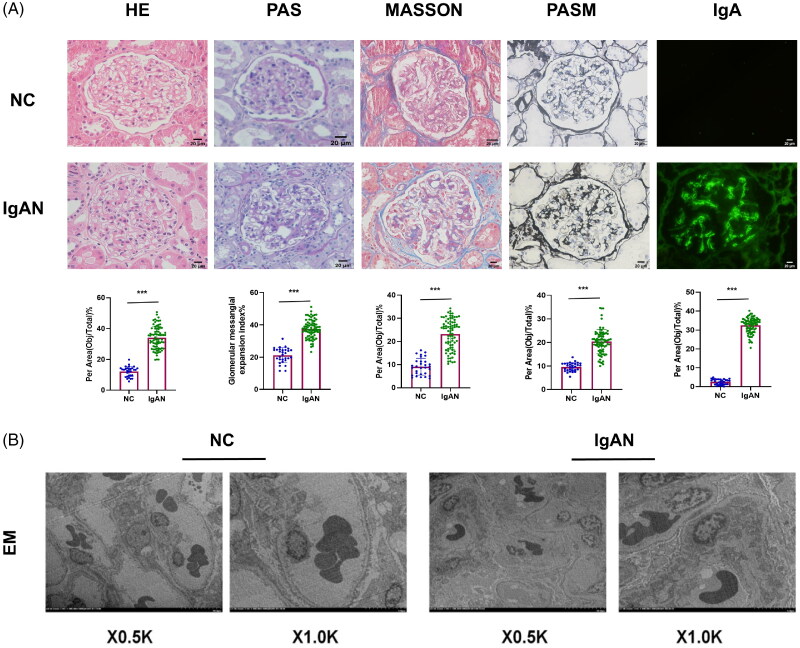
Methods: We identified the differentially expressed genes in the glomeruli of IgAN patients through weighted gene co-expression network analysis across three datasets. Through clinical renal pathological tissue and cellular experiments, we further validated the gene and investigated its relationship with the inflammatory markers and fibrosis indicators in IgAN.

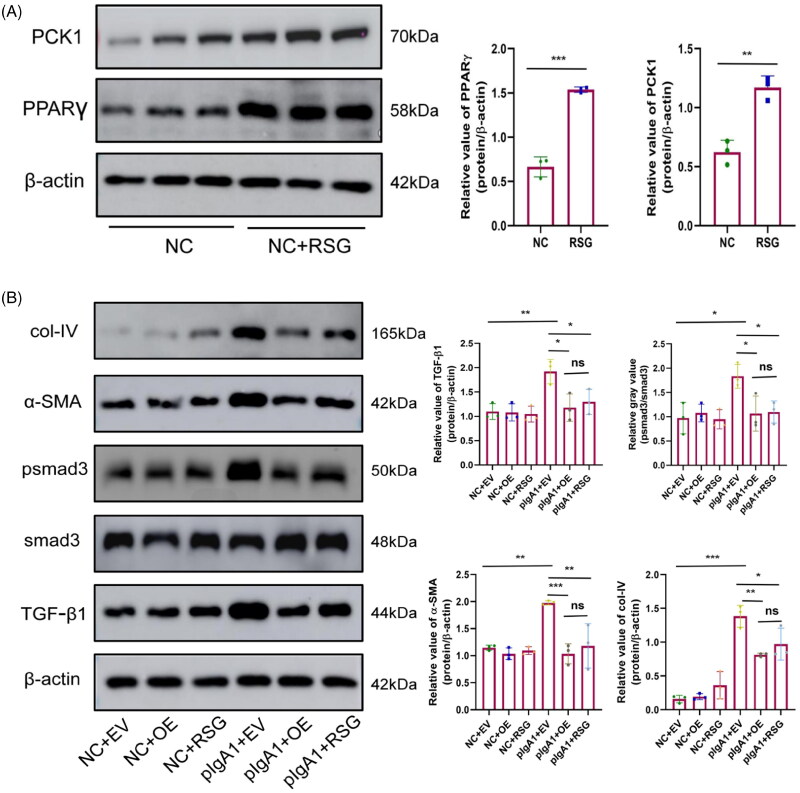
Results: Compared to peritumoral normal tissues, the peroxisome proliferator-activated receptor γ (PPARγ) signaling pathway have been identified as key elements in IgAN pathogenesis from two GEO databases and a validation dataset. PCK1 was identified and validated as one of the most promising candidate genes. The expression of PCK1 in clinically collected kidney specimens was significantly downregulated in patients with IgAN compared to healthy controls. The expression of PCK1 was inversely correlated with clinical indicators such as urinary albumin-to-creatinine ratio, 24-hour proteinuria. In experiments with SV40-transformed mouse glomerular mesangial cells (MCs), PCK1 and PPARγ protein expression levels were significantly decreased in polymeric IgA1 (pIgA1)-stimulated MCs, which contrasts with the increased expression of inflammatory and fibrotic factors. Overexpression of PCK1 inhibited cellular inflammation and fibrotic changes induced by pIgA1, demonstrating protective effects against cellular fibrosis similar to rosiglitazone.

Conclusion: PCK1 exerted a pronounced inhibitory effect on mesangial cell inflammatory markers and fibrosis indicators in IgAN, potentially offering a novel therapeutic target for its treatment.

Keywords: IgA nephropathy; PCK1; PPARγ; fibrosis; inflammation.


Conflict of interest statement

No potential conflicts of interest was reported by the authors.

Figures

Figure 1.
Figure 1.
Flow diagram illustrating the study design and workflow.
Figure 2.
Figure 2.
Screening of hub genes in bioinformatics analysis. (A) Screening DEGs from two datasets: Volcano plots of DEGs from GSE37460 (n = 54) and GSE104948 (n = 48). Blue points represent upregulated genes, red points represent downregulated genes, and gray points represent genes with no significant difference in expression (threshold, |fold-change|≥1.2 and adjusted p < 0.05); (B) Hierarchical cluster heatmaps of the DEGs from GSE37460 and GSE104948 (threshold, |fold-change|≥1.2 and adjusted p < 0.05); (C) Venn diagrams showing DEGs common to the two datasets; (D) KEGG pathways significantly enriched for the DEGs, including PPARγ signaling, are shown. PCK1 was identified as the most differentially expressed gene in the PPARγ pathway (|fold-change|=-1.619 and adjusted p < 0.05); (E) Box plot of initial expression for PCK1, demonstrating that the gene was significantly decreased in patients with IgAN relative to healthy controls in the GSE37460 and GSE104948 datasets (p < 0.001); (F) Verification of PCK1 by ROC curve analysis in the GSE37460 and GSE104948 datasets, comparing healthy control vs IgAN. (G) Box plot of initial expression for PCK1, demonstrating that the gene was significantly decreased in patients with IgAN relative to healthy controls in the GSE93798 dataset (p = 2.7e-11, p < 0.01); Verification of PCK1 by ROC curve analysis in the GSE93798 dataset, comparing healthy control vs IgAN. (H) PPI network of PCK1-related proteins retrieved from the STRING database (version 12.0). KEGG and GO enrichment analyses were performed based on the interacting proteins. PCK1 was mainly related to energy metabolism, AMPK and PPAR signaling pathways. Abbreviations: DEGs, differential genes.
Figure 2.
Figure 2.
Screening of hub genes in bioinformatics analysis. (A) Screening DEGs from two datasets: Volcano plots of DEGs from GSE37460 (n = 54) and GSE104948 (n = 48). Blue points represent upregulated genes, red points represent downregulated genes, and gray points represent genes with no significant difference in expression (threshold, |fold-change|≥1.2 and adjusted p < 0.05); (B) Hierarchical cluster heatmaps of the DEGs from GSE37460 and GSE104948 (threshold, |fold-change|≥1.2 and adjusted p < 0.05); (C) Venn diagrams showing DEGs common to the two datasets; (D) KEGG pathways significantly enriched for the DEGs, including PPARγ signaling, are shown. PCK1 was identified as the most differentially expressed gene in the PPARγ pathway (|fold-change|=-1.619 and adjusted p < 0.05); (E) Box plot of initial expression for PCK1, demonstrating that the gene was significantly decreased in patients with IgAN relative to healthy controls in the GSE37460 and GSE104948 datasets (p < 0.001); (F) Verification of PCK1 by ROC curve analysis in the GSE37460 and GSE104948 datasets, comparing healthy control vs IgAN. (G) Box plot of initial expression for PCK1, demonstrating that the gene was significantly decreased in patients with IgAN relative to healthy controls in the GSE93798 dataset (p = 2.7e-11, p < 0.01); Verification of PCK1 by ROC curve analysis in the GSE93798 dataset, comparing healthy control vs IgAN. (H) PPI network of PCK1-related proteins retrieved from the STRING database (version 12.0). KEGG and GO enrichment analyses were performed based on the interacting proteins. PCK1 was mainly related to energy metabolism, AMPK and PPAR signaling pathways. Abbreviations: DEGs, differential genes.
Figure 3.
Figure 3.
Clinical patient kidney pathology staining. (A) Pathological staining of clinical kidney specimens. Scale bar =20μm. (patients with IgAN, n = 79 and NC, n = 30). (B) Transmission electron microscopy of NC and IgAN specimens. Abbreviations: NC, normal control; H&E, hematoxylin and eosin staining; PAS, periodic acid-Schiff staining; PASM, periodic acid-silver methenamine; EM, electron microscopy. ***p < 0.001.
Figure 4.
Figure 4.
Immunofluorescence localization and immunohistochemical staining of PCK1. (A) Immunofluorescence double staining of PCK1 and the specific glomerular mesangial cells marker in renal biopsy tissues from patients with IgAN. PCK1 was labeled with a Cy3-conjugated secondary antibody, and glomerular mesangial cells were marked as PDGFR-β with a Cy3-conjugated secondary antibody; scale bar = 50μm. DAPI was used to stain cell nuclei. Merge images combine three colors. White arrows indicate characteristic staining parts, and these areas are enlarged and displayed in the upper left corner for better observation of glomerular staining results. (patients with IgAN, n = 6 and NC, n = 6). (B) Immunohistochemistry and quantification of PCK1 and PPARγ in human renal tissue (patients with IgAN, n = 79 and NC, n = 30). (C) Pearson correlation analysis of the relationship between PCK1 and PPARγ expression. PCK1 expression was linearly positively correlated with PPARγ expression (r = 0.734, p < 0.001). Abbreviations: NC, normal control; PDGFR-β, platelet-derived growth factor receptors beta. **p < 0.01; ***p < 0.001.
Figure 5.
Figure 5.
The correlation between the expression levels of PCK1 in glomeruli and glomerular pathological alterations as well as clinical parameters. (A) Immunohistochemistry and quantification of PCK1 in human renal tissue according to the Oxford classification (MEST-C). PCK1 expression in M1, E1, S1, and C1-2 categories was significantly decreased compared to M0, E0, S0, and C0 categories, respectively; (B) Spearman rank correlation analysis of the relationship between PCK1 and Katafuchi glomeruli scores. PCK1 expression was linearly negatively correlated with Katafuchi glomeruli scores (r = -0.396, p < 0.01); (C) Correlation scatter plot between PCK1 and clinical indicators in patients with IgAN; (D) Verification of PCK1 by ROC curve analysis. Abbreviations: AUC, area under curve; CI, confidence interval; NC, normal control; ROC, receiver operating characteristic. **p < 0.01; ***p < 0.001.
Figure 6.
Figure 6.
The expression of PCK1 in renal tissue exhibited a negative correlation with the expression of inflammatory chemokines and fibrosis-related markers. Immunohistochemistry and quantification of TNF-α and IL-1β in human renal tissue (patients with IgAN, n = 79 and NC, n = 30). (B) Pearson correlation analysis of the relationship between PCK1 and TNF-α/IL-1β expression. Decreased PCK1 expression was linearly negatively correlated with TNF-α/IL-1β levels (r = -0.625/r = -0.607, p < 0.001); (C) Immunohistochemistry and quantification of TGF-β1, psmad3, α-SMA, FN, and col-IV in human renal tissue (patients with IgAN, n = 79 and NC, n = 30). (D) Pearson correlation analysis of the relationship between PCK1 and TGF-β1/psmad3/α-SMA/FN/col-IV expression. Decreased PCK1 expression was linearly negatively correlated with TGF-β1/psmad3/α-SMA/FN/col-IV levels (r = -0.505/r = -0.720/r = -0.613/r = -0.731/r = -0.668). Abbreviations: NC, normal control; TNF-α, tumor necrosis factor α; IL-1β, interleukin 1β; TGF-β1, transforming growth factor-β1; psmad3, Phosphorylated-smad3; α-SMA, α-smooth muscle actin; FN, fibronectin; col-IV, collagen-IV. ***p < 0.001.
Figure 7.
Figure 7.
PCK1, inflammatory chemokines, and fibrotic markers expression levels differ significantly between NC and pIgA groups in MCs. (A) Determination of the optimal pIgA1 stimulation concentration in MCs using the MTT assay (24 h); (B) Western blotting analysis of PCK1 protein expression at various time points in MCs induced by pIgA1 (25μg/ml); (C) Western blotting and densitometry analysis of PCK1, PPARγ, TGFβ1, psmad3, α-SMA, FN, and col-IV proteins in NC and pIgA1 groups (n = 3); (D) qRT-PCR analysis of MCP-1 and TNF-α mRNA levels in NC and pIgA1 groups (n = 3). Abbreviations: MCs, mesangial cells; MCP-1, monocyte chemoattractant protein-1; ns, no significant, *p < 0.05, **p < 0.01, ***p < 0.001.
Figure 8.
Figure 8.
Impact of PCK1 gene overexpression on inflammatory and fibrotic factors in MCs in the pIgA group. Western blotting and densitometry analyses of PCK1 protein in MCs transfected with either empty vector or PCK1 overexpression plasmids (n = 3). (B) qRT-PCR analysis of PCK1 mRNA in SV40 cells transfected with either empty vector or PCK1 overexpression plasmids (n = 3). (C) Western blotting and densitometry analyses of PCK1, PPARγ, TGFβ1, psmad3, α-SMA, FN, and col-IV proteins in SV40 cells from the natural control group and after pIgA1 stimulation, transfected with either empty vector or PCK1 overexpression plasmids (n = 3). (D) qRT-PCR analysis of MCP-1 and TNF-α mRNA in NC and pIgA1 groups transfected with either empty vector or PCK1 overexpression plasmids (n = 3). Abbreviations: MCs, mesangial cells; EV, empty vector; OE, overexpression. *p < 0.05, **p < 0.01, ***p < 0.001.
Figure 9.
Figure 9.
Comparison of the impact of PCK1 overexpression and rosiglitazone on cellular fibrosis. Western blotting and densitometry analyses of PPARγ protein in MCs treated with RSG (10 μM, 48 h); (B) Western blotting and densitometry analyses of TGFβ1, psmad3, α-SMA, and col-IV proteins in SV40 cells from the natural control group and after pIgA1 stimulation, transfected with either empty vector or PCK1 overexpression plasmids, and treated with RSG (n = 3). Abbreviations: MCs, mesangial cells; RSG, rosiglitazone; EV, empty vector; OE, overexpression; ns, no significant. *p < 0.05, **p < 0.01, ***p < 0.001.

Similar articles

References

    1. Coppo R. IgA nephropathy: a European perspective in the corticosteroid treatment. Kidney Dis (Basel). 2018;4(2):58–64. doi: 10.1159/000487265. - DOI - PMC - PubMed
    1. Lai KN, Tang SCW, Schena FP, et al. . IgA nephropathy. Nat Rev Dis Primers. 2016;2(1):16001. doi: 10.1038/nrdp.2016.1. - DOI - PubMed
    1. Barbour SJ, Cattran DC, Kim SJ, et al. . Individuals of Pacific Asian origin with IgA nephropathy have an increased risk of progression to end-stage renal disease. Kidney Int. 2013;84(5):1017–1024. - PubMed
    1. Tam FWK, Pusey CD.. TESTING corticosteroids in IgA nephropathy: a continuing challenge. Clin J Am Soc Nephrol. 2018;13(1):158–160. - PMC - PubMed
    1. Zhang H, Barratt J.. Is IgA nephropathy the same disease in different parts of the world? Semin Immunopathol. 2021;43(5):707–715. doi: 10.1007/s00281-021-00884-7. - DOI - PubMed

MeSH terms

Substances

LinkOut - more resources