

Experimental validation of Geant4 nuclear interaction models in dose calculations of therapeutic carbon ion beams
- PMID: 40442938
- PMCID: PMC12258006
- DOI: 10.1002/mp.17906
Experimental validation of Geant4 nuclear interaction models in dose calculations of therapeutic carbon ion beams
Abstract
Background: The choice of nuclear interaction models in Monte Carlo simulations affects the dose calculation accuracy for light ion beam therapy.
Purpose: This study aimed to evaluate the dose calculation accuracy and simulation time of three GATE-RTiON/Geant4 physics lists for therapeutic carbon ion beams, assessing their suitability for independent dose calculation in patient-specific quality assurance (PSQA).
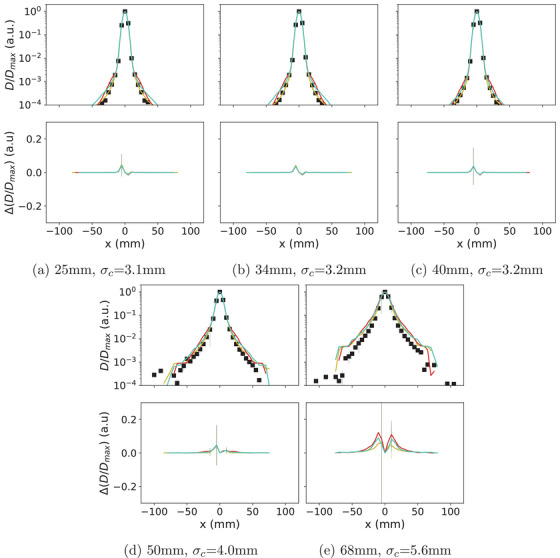
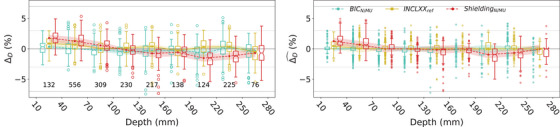
Methods: The normalized beam models for physics lists QGSP_BIC_HP_EMZ, QGSP_INCLXX_HP_EMZ, and Shielding_EMZ were validated against measurements regarding the accuracy of range, spot size and reference dose. Normalized transversal dose profiles ( ) and field size factor (FSF) were compared with measurements. The accuracy of simulated target dose in 103 fields (various energies, field sizes, depths, and dose gradient complexity) of energy-modulated scanned beams was evaluated at 3181 positions. The median of global dose difference was calculated at different depth ranges.
Results: The three physics lists with validated beam models showed similar accuracy in and FSF in the Bragg peak region and proximal depths, while QGSP_INCLXX_HP agreed most closely for in the fragmentation tail. Accounting for -related uncertainty, remained within ±1.1% for QGSP_INCLXX_HP, while exhibiting an overall increasing trend with depth for QGSP_BIC_HP (up to 2.3%) and a decreasing trend for Shielding (down to -4.1%), respectively. By tuning the number-of-primaries/monitor unit conversion ( ) as a function of energy, of QGSP_BIC_HP was reduced to within ±1.3%, at the cost of reduced accuracy in the simulated reference dose. The simulation time of Shielding was 1.8 times that of QGSP_BIC_HP and 1.5 times that of QGSP_INCLXX_HP.
Conclusions: QGSP_INCLXX_HP demonstrated high dosimetric accuracy in the target region of energy-modulated fields. QGSP_BIC_HP and Shielding showed physics model-related inaccuracies in simulated target dose. Additional tuning improved their target dose calculation accuracy with a trade-off of reference dose accuracy. The computationally efficient QGSP_INCLXX_HP and QGSP_BIC_HP are viable candidates for dose calculation applications of carbon ion beam therapy, such as in silico PSQA.
Keywords: GATE‐RTiON; Geant4; carbon ion radiotherapy; dosimetric accuracy.
© 2025 MedAustron Ion Therapy Center and The Author(s). Medical Physics published by Wiley Periodicals LLC on behalf of American Association of Physicists in Medicine.
Conflict of interest statement
The authors declare no conflicts of interest.
Figures


Similar articles
-
Evaluation of GATE-RTion (GATE/Geant4) Monte Carlo simulation settings for proton pencil beam scanning quality assurance.Med Phys. 2020 Nov;47(11):5817-5828. doi: 10.1002/mp.14481. Epub 2020 Oct 17. Med Phys. 2020. PMID: 32967037
-
Results of a Geant4 benchmarking study for bio-medical applications, performed with the G4-Med system.Med Phys. 2025 May;52(5):2707-2761. doi: 10.1002/mp.17678. Epub 2025 Feb 21. Med Phys. 2025. PMID: 39981742 Free PMC article.
-
Extended in-field and out-of-field validation of a compact Monte Carlo model of an IBA PROTEUS®ONE proton beam in TOPAS/GEANT4.Phys Med Biol. 2023 Oct 31;68(21). doi: 10.1088/1361-6560/ad03a9. Phys Med Biol. 2023. PMID: 37844576
-
Drugs for preventing postoperative nausea and vomiting in adults after general anaesthesia: a network meta-analysis.Cochrane Database Syst Rev. 2020 Oct 19;10(10):CD012859. doi: 10.1002/14651858.CD012859.pub2. Cochrane Database Syst Rev. 2020. PMID: 33075160 Free PMC article.
-
Topotecan, pegylated liposomal doxorubicin hydrochloride and paclitaxel for second-line or subsequent treatment of advanced ovarian cancer: a systematic review and economic evaluation.Health Technol Assess. 2006 Mar;10(9):1-132. iii-iv. doi: 10.3310/hta10090. Health Technol Assess. 2006. PMID: 16545208
References
-
- CERN . Introduction to the Monte Carlo simulation of radiation transport. Accessed January 17, 2025. https://indi.to/fyzNy2021
Publication types
MeSH terms
Grants and funding
LinkOut - more resources
Full Text Sources
Research Materials
Miscellaneous
