. 2025 Aug;45(8):1038-1071.
doi: 10.1002/cac2.70036. Epub 2025 May 29.

Simvastatin overcomes the pPCK1-pLDHA-SPRINGlac axis-mediated ferroptosis and chemo-immunotherapy resistance in AKT-hyperactivated intrahepatic cholangiocarcinoma

Affiliations

Simvastatin overcomes the pPCK1-pLDHA-SPRINGlac axis-mediated ferroptosis and chemo-immunotherapy resistance in AKT-hyperactivated intrahepatic cholangiocarcinoma

Jinghan Zhu et al. Cancer Commun (Lond). 2025 Aug.

Abstract

Background: Intrahepatic cholangiocarcinoma (ICC) is a challenging cancer with an increasing incidence. The Phase III TOPAZ-1/KEYNOTE-966 study demonstrated chemo-immunotherapy (CIT) as a significant advancement, potentially replacing traditional chemotherapy for advanced biliary tract cancer. Ferroptosis is a crucial process that affects cancer cell survival and therapy resistance. Although AKT hyperactivation is prevalent in numerous cancers, including ICC, its role in ferroptosis resistance remains unclear. This study explored whether targeting ferroptosis can enhance CIT response rates, specifically in ICC patients with AKT hyperactivation.

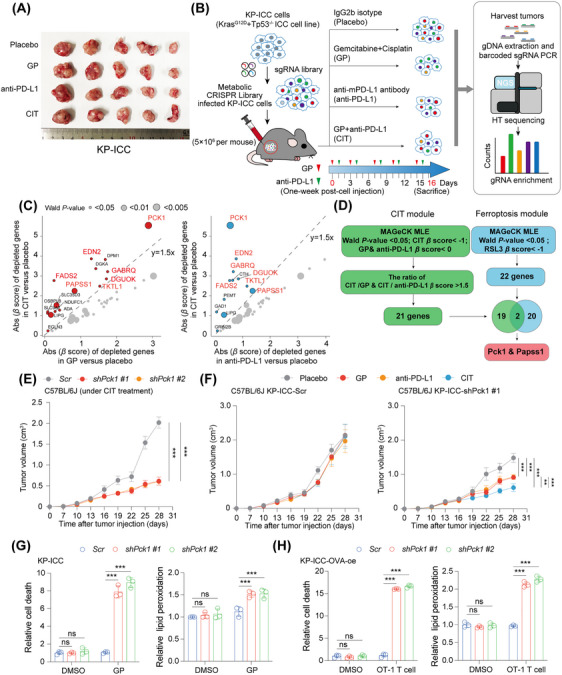
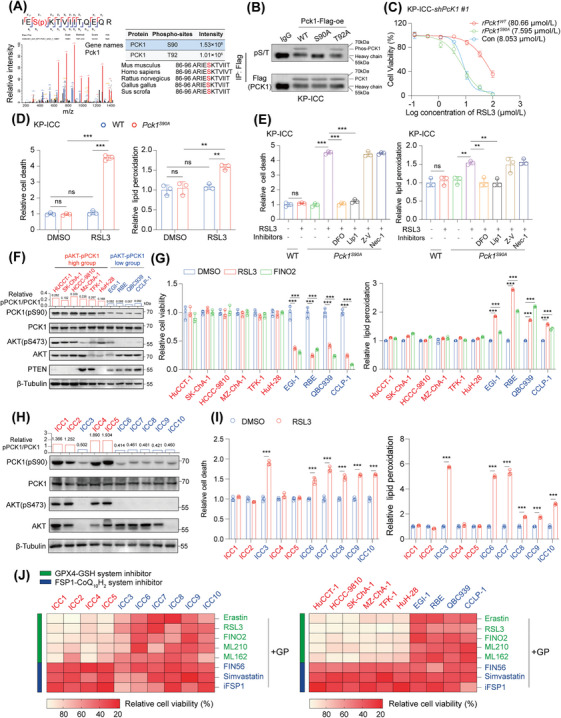
Methods: In vivo metabolic CRISPR screening in a KrasG12D/Tp53-/- ICC mouse model was used to identify primary regulators of ferroptosis during CIT (gemcitabine, cisplatin, and anti-mouse programmed cell death 1 ligand 1). Phosphoenolpyruvate carboxykinase 1 (PCK1) was assessed for its role in ferroptosis and treatment resistance in preclinical models under AKT activation levels. Molecular and biochemical techniques were used to explore PCK1-related resistance mechanisms in AKT-hyperactivated ICC.

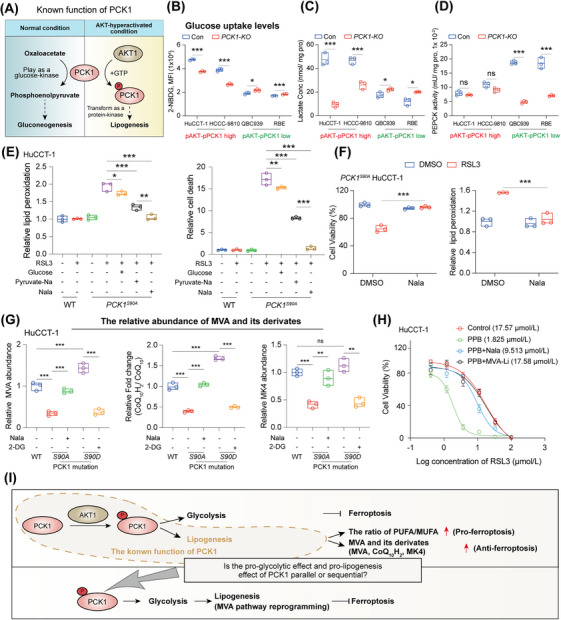
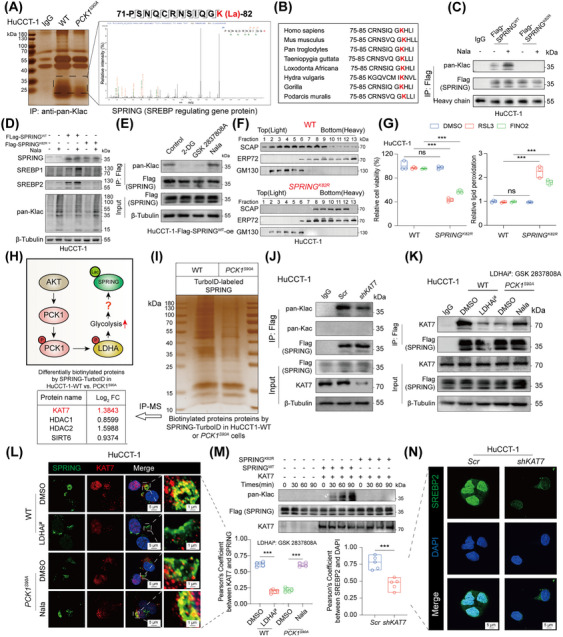
Results: Under AKT hyperactivation condition, phosphorylated PCK1 (pPCK1) promoted metabolic reprogramming, enhancing ubiquinol and menaquinone-4 synthesis through the mevalonate (MVA) pathway. This cascade was mediated by the pPCK1-pLDHA-SPRINGlac axis. Inhibiting PCK1 phosphorylation or using simvastatin significantly augmented CIT efficacy in preclinical models. Clinical data further indicated that phosphorylated AKT (pAKT)-pPCK1 levels might serve as a biomarker to predict CIT response in ICC.

Conclusion: This study identified the pAKT-pPCK1-pLDHA-SPRINGlac axis as a novel mechanism driving ferroptosis resistance in AKT-hyperactivated ICC by associating glycolytic activation with MVA flux reprogramming. Targeting this axis, potentially through statin-based therapies, may offer a strategy to sensitize ICC cells to ferroptosis and improve treatment outcomes.

Keywords: Chemo‐immunotherapy; Ferroptosis; Intrahepatic cholangiocarcinoma; Lactylation; Mevalonate pathway; PCK1.


Conflict of interest statement

The authors declare no potential conflicts of interest.

Figures

FIGURE 1
FIGURE 1
In vivo metabolic screening reveals ferroptosis regulators of CIT in ICC. (A) Representative tumor images of C57BL/6J mice bearing subcutaneous KP‐ICC tumors after indicated treatments (Placebo, GP, anti‐PD‐L1, or CIT; n = 5 per group). (B) in vivo CRISPR screening workflow. Male C57BL/6J mice (4‐5 weeks) were injected with KP‐ICC cells transfected with a mouse metabolic CRISPR library. Tumors were analyzed by NGS‐based sgRNA sequencing to identify regulators. Treatment groups are detailed in (A). (C) Scatter plots of absolute β scores (Wald P < 0.05) for CIT‐depleted genes versus GP (left) or anti‐PD‐L1 (right). Red/blue points: CIT/GP or CIT/anti‐PD‐L1 ratio > 1.5. (D) Schematic representation for the identification of potential ferroptosis‐associated modulators contributing to CIT resistance. (E) Longitudinal monitoring of tumor growth in mice implanted with KP‐ICC cells expressing Scr, shPck1 #1, or shPck1 #2. All mice received CIT treatment (GP + anti‐PD‐L1). (n = 5 per group). (F) Longitudinal monitoring of tumor growth in mice implanted with KP‐ICC cells expressing Scr or shPck1 #1. Tumor‐bearing mice were divided into 4 groups and treated with Placebo, GP, anti‐PD‐L1, or CIT for 2 weeks (n = 5 per group). (G) Assessment of relative lipid peroxidation and cell death in KP‐ICC cells expressing Scr, shPck1 #1 and shPck1 #2 at 36 h after treatment with GP. (H) Relative lipid peroxidation and cell death were assessed in OVA‐overexpressing KP‐ICC cells (Scr, shPck1 #1, and shPck1 #2) after 36 h of incubation with OT‐I T cells at a 1:1 effector‐to‐target ratio (n = 3 per group). All data are mean ± SD. Statistical significance was determined using 2‐way ANOVA for multiple group comparisons and unpaired 2‐tailed t‐tests for comparisons between 2 groups. * P < 0.05; ** P < 0.01; *** P < 0.001; ns, not significant. Abbreviations: GP, gemcitabine + cisplatin; anti‐mPD‐L1, anti‐mouse programmed death‐ligand 1; CIT, chemo‐immunotherapy (gemcitabine + cisplatin+ anti‐mPD‐L1 antibody); NGS, next‐generation sequencing; CRISPR, clustered regularly interspaced short palindromic repeats; sgRNA, single‐guide RNA; gDNA, genome DNA; MAGeCK, model‐based analysis of genome‐wide CRISPR‐Cas9 knockout; MLE, maximum likelihood estimation; Pck1, phosphoenolpyruvate carboxykinase 1; Scr, scramble shRNA; shRNA, short hairpin RNA; OVA, ovalbumin.
FIGURE 2
FIGURE 2
Role of phosphorylated PCK1 in conferring ferroptosis resistance in ICC. (A) IP‐MS in KP‐ICC cells using an anti‐Pck1 antibody to identify phosphorylation‐modified peptides. (B) IP and WB assays were performed on Flag‐tagged Pck1WT, Pck1S90A, and Pck1T92A overexpressing KP‐ICC cells to validate the phosphorylation of Pck1 at S90 and T92 (pS/T, phospho‐serine/threonine). (C) IC50 curves of the given cell lines treated with RSL3. (D) Quantitative analysis of lipid peroxidation and cell death was performed in HuCCT‐1 WT and PCK1S90A HuCCT‐1 cells after 36 h of treatment with 10 µmol/L RSL3 (n = 3 per group). (E) Quantitative analysis of lipid peroxidation and cell death was performed in the given ICC cell lines after 36 h of 10 µmol/L RSL3 treatment with or without pre‐treatment of specific cell death inhibitors: DFO (ferroptosis inhibitor, 5 µmol/L), Lip1 (ferroptosis inhibitor, 300 nmol/L), Z‐V (apoptosis inhibitor, 10 µmol/L), and Nec‐1 (necroptosis inhibitor, 2 µmol/L), administered 1 h before RSL3 treatment. (F) To measure pAKT and pPCK1 activation levels in the given CCA cell lines (ICC/ECC), WB was performed on the indicated proteins, and the ratio of PCK1(pS90) to total PCK1 levels was determined. (G) Quantitative analysis of lipid peroxidation and cell viability was performed in the given CCA cell lines treated with 10 µmol/L RSL3 or 10 µmol/L FINO2 (a ferroptosis inducer) for 36 h. (H) WB was performed to assess pAKT‐pPCK1 activation‐related markers in 10 ICC‐PDOs, and the ratio of PCK1(pS90) to total PCK1 levels was determined. (I) Quantitative analysis of lipid peroxidation and cell death was performed in 10 ICC‐PDOs treated with 10 µmol/L RSL3 for 36 h. (J) Heatmap of cell viability assays in ICC‐PDOs (left panel)/ CCA cell lines (right panel) treated with GP (5 nmol/L gemcitabine and 1 µmol/L cisplatin) with specific ferroptosis inducers: Erastin (10 µmol/L), RSL3 (10 µmol/L), FINO2 (10 µmol/L), ML210 (1 µmol/L), ML162 (10 µmol/L), FIN56 (10 µmol/L), Simvastatin (10 nmol/L), and iFSP1 (200 nmol/L). All data are mean ± SD. Statistical significance was determined using 2‐way ANOVA for multiple group comparisons and unpaired 2‐tailed t‐tests for comparisons between 2 groups. * P < 0.05; ** P < 0.01; *** P < 0.001; ns, not significant. Abbreviations: IP‐MS, immunoprecipitation followed by mass spectrometry; IC50, half maximal inhibitory concentration; ICC, intrahepatic cholangiocarcinoma; ECC, extrahepatic cholangiocarcinoma; CCA, cholangiocarcinoma; PDO, patient‐derived organoid; DFO, deferoxamine; Lip1, liproxstatin‐1; Z‐V, Z‐VAD‐FMK; Nec‐1, necrostatin‐1s; PCK1, phosphoenolpyruvate carboxykinase 1; AKT, protein kinase B; PTEN, phosphatase and tensin homolog; GPX4, glutathione peroxidase 4; GSH, glutathione; FSP1, ferroptosis suppressor protein 1; CoQ10H2, reduced coenzyme Q10 (Ubiquinol).
FIGURE 3
FIGURE 3
Inhibition of PCK1 phosphorylation augments CIT efficacy through ferroptosis. (A‐B) Cell death and lipid peroxidation were measured in HuCCT‐1 and QBC939 cells (Con and PCK1‐KO) treated with RSL3 (10 µmol/L) for 36 h, with or without 1 h pre‐treatment with Lip1 (300 nmol/L). (C) WB probed specific proteins in HuCCT‐1 cells (left); measurement of cell viability and lipid peroxidation in the given cells 36 h post 10 µmol/L RSL3 treatment (right). (D) Schematic representation of the TAT‐PPB peptide sequence. (E) Representative fluorescence microscopy images of ICC‐PDO treated with TAT‐PPB peptides (1 µg/mL). (F) Measurement of cell viability (left) and lipid peroxidation (right) in pAKT‐pPCK1 high ICC‐PDOs (ICC1 and ICC2) 36 h post treatment with GP and PPB (1 µg/mL). (G‐K) KP‐ICC cells were subcutaneously injected into C57BL/6J mice. One‐week post subcutaneous injection, mice received 2 weeks of indicated treatments. Subsequent analysis included: tumor general over view (G), intratumoral MDA concentrations (for lipid peroxidation evaluation) (H), CD3+CD8+ T cell percentages (I), TNFα+/IFNγ+ CD8+ T cell percentages (J) and IHC analysis for CD8+ T cell infiltration (K). All data are mean ± SD. Statistical significance was determined using 2‐way ANOVA for multiple group comparisons and unpaired 2‐tailed t‐tests for comparisons between 2 groups. * P < 0.05; ** P < 0.01; *** P < 0.001; ns, not significant. Abbreviations: Con, control; WT, wild type; KO, knockout; rPCK1, PCK1‐KO + recombinant PCK1 overexpression; PCK1, phosphoenolpyruvate carboxykinase 1; Lip‐1, liproxstatin‐1; CIT, chemo‐immunotherapy; TAT, trans‐activator of transcription; PPB, PCK1 phosphorylation blocker; ICC, intrahepatic cholangiocarcinoma; PDO, patient‐derived organoid; MDA, malondialdehyde; IFNγ, interferon gamma; TNFα, tumor necrosis factor alpha.
FIGURE 4
FIGURE 4
pPCK1 modulates lactate metabolism‐mevalonate flux reprogramming, contributing to ferroptosis resistance in ICC. (A) The scheme summarizes the known function of PCK1. (B‐D) Assessment of glucose uptake (B), intracellular lactate concentrations (C), and PEPCK enzyme activity (D) in ICC cell lines with high pAKT‐pPCK1 activation (HuCCT‐1, HCCC‐9810) and low pAKT‐pPCK1 activation (QBC939, RBE), with or without PCK1 knockout. (E) Measurements of lipid peroxidation and cell death in HuCCT‐1‐WT or PCK1S90A HuCCT‐1 after 36 h of indicated treatments (10 mmol/L glucose; 10 mmol/L Pyruvate‐Na; 10 mmol/L Nala), followed by exposure to 10 µmol/L RSL3 for an additional 36 h. (F) Measurements of lipid peroxidation and cell viability in PCK1S90A HuCCT with 36 h of Nala treatments, followed by exposure to RSL3 for an additional 36 h. (G) Detection of intermediate metabolites in the MVA pathway (MVA, CoQ10H2, MK4) in HuCCT‐1‐WT/PCK1S90A HuCCT‐1‐/ PCK1S90D HuCCT‐1, with and without administration of Nala or 10 mmol/L 2‐DG for 24 h. (H) IC50 curves for HuCCT‐1 cells under indicated treatments (1 µg/mL PPB; 10mmol/L Nala; 500 µmol/L MVA‐Li). (I) The scheme summarizes the findings. Briefly, in AKT‐hyperactivated ICC, AKT phosphorylates PCK1 at Ser90, driving metabolic reprogramming (enhanced glycolysis/lipogenesis) and ferroptosis resistance. Mechanistically, pPCK1 activates the mevalonate pathway by enhancing glycolysis, boosting synthesis of radical‐scavenging antioxidants (CoQ10H2, MK4), thereby shielding cells from ferroptosis. All data are mean ± SD. Statistical significance was determined using 2‐way ANOVA for multiple group comparisons and unpaired 2‐tailed t‐tests for comparisons between 2 groups. * P < 0.05; ** P < 0.01; *** P < 0.001; ns, not significant. Abbreviations: 2‐NBDG, 2‐(n‐(7‐nitrobenz‐2‐oxa‐1,3‐diazol‐4‐yl) amino)‐2‐deoxyglucose; PEPCK, phosphoenolpyruvate carboxykinase; Pyruvate‐Na, sodium pyruvate; PUFA, polyunsaturated fatty acid; MUFA, monounsaturated fatty acid; MVA, mevalonate; MVA‐Li, mevalonic acid lithium salt; CoQ10H2, reduced coenzyme Q10 (Ubiquinol); MK4, menaquinone‐4; Nala, sodium L‐lactate; 2‐DG, 2‐deoxyglucose.
FIGURE 5
FIGURE 5
The pPCK1‐pLDHA axis promotes the translocation of SCAP, thereby facilitating MVA flux reprogramming in ICC. (A) IP assays conducted in PCK1‐KO HuCCT‐1 cells re‐expressing PCK1WT (rPCK1WT) or PCK1S90A (rPCK1S90A) using anti‐PCK1 antibody. The precipitated PCK1‐binding peptides were resolved by SDS‐PAGE and visualized with silver stain. Notable peptide hits associated with PCK1 identified via IP‐MS are indicated. (B) Potential phosphorylation sites on LDHA were identified using SCANSITE and PhosphoSite analysis. Wild‐type LDHA (LDHAWT) and its indicated mutation were overexpressed in HuCCT‐1 cells, followed by IP with anti‐HA antibody and subsequent WB analysis. (C) HEK‐293T cells expressing His‐LDHAWT or His‐LDHAT248A were purified, and LDHA enzyme activity was detected. (D) Representative immunofluorescence colocalization studies were performed to assess the colocalization of PCK1 and LDHA in specified ICC cells. Pearson's coefficients between PCK1 and LDHA in each group were presented. (E) in vitro kinase assay of purified recombinant His‐tagged PCK1WT, His‐PCK1S90A, or His‐PCK1C288S with active His‐AKT in the presence of ATP, followed by interaction assays with Myc‐tagged LDHA in the presence of GTP. (F) Representative immunofluorescence images of the localization of SCAP (green), GM130 (Golgi marker, red), and nuclei (DAPI, blue) in HuCCT‐1‐WT or PCK1S90A HuCCT‐1 after the indicated treatments for 36 h. Treatments included 10 mmol/L 2‐DG; 10 nmol/L GSK 2837808A (specific LDHA inhibitor); 10 mmol/L Nala. (G) Representative immunofluorescence images showing SREBP2 (green) localization in the nucleus (DAPI, blue) in HuCCT‐1‐WT or PCK1S90A HuCCT‐1 after the indicated treatments. (H) The scheme summarizes the findings. Xu et al. found that in AKT‐hyperactivated HCC, pPCK1 promotes SCAP translocation from the ER to the Golgi by binding and phosphorylating INSIGs. However, our work found that in AKT‐hyperactivated ICC, pPCK1 cannot bind to INSIGs but can still regulate SCAP translocation by directly binding and phosphorylating LDHA at T248 in a lactate‐dependent manner. All data are mean ± SD. Statistical significance was determined using 2‐way ANOVA for multiple group comparisons and unpaired 2‐tailed t‐tests for comparisons between 2 groups. * P < 0.05; ** P < 0.01; *** P < 0.001; ns, not significant. Abbreviations: IP, immunoprecipitation; rPCK1WT/S90A/S90D, PCK1‐KO+recombinant PCK1WT/S90A/S90D overexpression; PCK1, phosphoenolpyruvate carboxykinase 1; LDHA, lactate dehydrogenase A; WT, wild type; SCAP, SREBP cleavage activating protein; GM130, golgi matrix protein of 130 kDa; Nala, sodium L‐lactate; 2‐DG, 2‐deoxyglucose; SREBP2, sterol regulatory element‐binding protein 2; AKT, protein kinase B; INSIG1/2, insulin induced gene 1/2; ER, endoplasmic reticulum.
FIGURE 6
FIGURE 6
Lactylation by KAT7 at SPRING's K82 is essential for pPCK1‐pLDHA axis and its anti‐ferroptotic role. (A) IP assays were performed in HuCCT‐1‐WT and PCK1S90A HuCCT‐1 using an anti‐pan‐Klac antibody. Peptides with lysine lactylation modifications were separated by SDS‐PAGE, silver‐stained, and identified by mass spectrometry. (B) Sequence alignment of SPRINGK82 across species. (C) HuCCT‐1 cells with or without Flag‐SPRINGWT/SPRINGK82R overexpression were treated with 10 mmol/L Nala for 36 h. IP assays by anti‐Flag antibody followed by WB measurements was performed on whole‐cell lysates. (D) WB measurements of whole‐cell lysates from HuCCT‐1 cells with or without Flag‐SPRINGWT/SPRINGK82R overexpression, following treatment with 10 mmol/L Nala for 36 h. (E) IP and WB measurements of HuCCT‐1 cells with Flag‐SPRINGWT overexpression after 36 h of indicated treatments (10 mmol/L 2‐DG; 10 nmol/L GSK 2837808A; 10 mmol/L Nala). (F) Subcellular fractionation from HuCCT‐1‐WT and SPRINGK82R HuCCT‐1 cells, followed by WB with specific antibodies. (G) Assessment of relative cell viability and lipid peroxidation in HuCCT‐1‐WT and SPRINGK82R HuCCT‐1 under treatment with 10 µmol/L RSL3 or 10 µmol/L FINO2 for 36 h. (H) The scheme summarizes current findings and remaining questions. The pPCK1‐pLDHA axis promotes SCAP translocation and SREBP nuclear accumulation via SPRING K82 lactylation. However, the enzyme responsible for SPRING K82 lactylation remains to be identified despite the lactate accumulation caused by the pPCK1‐pLDHA axis. (I) Biotinylated proteins from HuCCT‐1‐WT and PCK1S90A HuCCT‐1 cells were enriched and analyzed by mass spectrometry. Enrichment results are presented as a silver‐stained gel. (J‐K) IP and WB analyses of HuCCT‐1‐Scr or HuCCT‐1‐shKAT7 (J) and HuCCT‐1‐WT/ PCK1S90A HuCCT‐1 cells treated with 10 nmol/L LDHAi (GSK 2837808A) or 10 mmol/L Nala (K). (L) Representative immunofluorescence colocalization studies were performed to evaluate the colocalization of SPRING and KAT7 in specified cells following 36 h of indicated treatments. The Pearson's coefficient between PCK1 and KAT7 was calculated and presented for each group. The treatments included 10 nmol/L GSK 2837808A and 10 mmol/L Nala. (M) An in vitro lactylation assay was performed using Flag‐SPRINGWT and Flag‐SPRINGK82R purified from HEK‐293T cells, along with KAT7‐HA also derived from HEK‐293T cells. SPRING lactylation levels were assessed using a pan‐Klac antibody. (N) Representative immunofluorescence images and Pearson's coefficient analysis of SREBP2 nuclear localization in HuCCT‐Scr and HuCCT‐1‐shKAT7.All data are mean ± SD. Statistical significance was determined using 2‐way ANOVA for multiple group comparisons and unpaired 2‐tailed t‐tests for comparisons between 2 groups. * P < 0.05; ** P < 0.01; *** P < 0.001; ns, not significant. Abbreviations: Pan‐Klac, pan‐lysine lactylation; SPRING, SREBP‐regulating gene protein; Nala, sodium‐L‐lactate; SREBP1/2, sterol regulatory element‐binding protein 1; SCAP, SREBP cleavage‐activating protein; GM130, golgi matrix protein 130; ERP72, endoplasmic reticulum protein 72; PPB, PCK1 phosphorylation blocker; Lac, lactylation; HDAC1, histone deacetylase 1; HDAC2, histone deacetylase 2; SIRT6, sirtuin 6; AKT, protein kinase B; PCK1, phosphoenolpyruvate carboxykinase 1; LDHA, lactate dehydrogenase A; MVA, mevalonate; CoQ10H2, reduced coenzyme Q10 (Ubiquinol); MK‐4, menaquinone‐4 (vitamin K2).
FIGURE 7
FIGURE 7
Simvastatin mediates enhanced CIT efficacy in ICC through disruption of the pPCK1‐pLDHA‐SPRINGlac axis. (A) mRNA expression levels of mevalonate pathway‐related genes in HuCCT‐1‐WT and SPRINGK82R HuCCT‐1, treated with or without 10 mmol/L Nala for 36 h. (B) Assessment of cell viability and lipid peroxidation in HuCCT‐1‐WT and SPRINGK82R HuCCT‐1 with or without indicated treatments for 36 h. (C‐I) KP‐ICC cells were subcutaneously injected into C57BL/6J mice. One week after injection, mice received 2 weeks of the indicated treatments [Placebo, PPB, Simv (simvastatin), CIT, CIT + PPB, CIT + Simv]. Subsequent analyses of KP‐ICC tumors included tumor general overview (C), tumor weight (D), tumor volume (E), intratumoral MDA concentrations for lipid peroxidation evaluation (F), flow cytometry analysis of CD3+CD8+ T cell percentages (G) and TNFα+/IFNγ+ CD8+ T cell percentages (H), and IHC analysis for CD8+ T cell infiltration (I). (J‐N) Similar in vivo setup as (C‐I) with post‐treatment (Placebo, CIT, Simv, CIT + Simv, CIT + Simv + MVA‐Li) analyses including tumor general overview (J), tumor weight (K), tumor volume (L), intratumoral MDA concentrations for lipid peroxidation evaluation (M), and IHC analysis for CD8+ T cell infiltration (N). For IHC analysis, 9 field of view were randomly selected from 5 slides corresponding to 5 mice in each group for statistical analysis. All data are mean ± SD. Statistical significance was determined using 2‐way ANOVA for multiple group comparisons and unpaired 2‐tailed t‐tests for comparisons between 2 groups. * P < 0.05; ** P < 0.01; *** P < 0.001; ns, not significant. Abbreviations: ACAT2, acetyl‐CoA acetyltransferase 2; HMGCS1, 3‐hydroxy‐3‐methylglutaryl‐CoA synthase 1; HMGCR, 3‐hydroxy‐3‐methylglutaryl‐CoA reductase; MVK, mevalonate kinase; MVD, mevalonate diphosphate decarboxylase; IDI1, isopentenyl‐diphosphate delta isomerase 1; FDPS, farnesyl diphosphate synthase; FDFT1, farnesyl‐diphosphate farnesyltransferase 1; SQLE, squalene epoxidase; LSS, lanosterol synthase; CYP51A1, cytochrome P450 family 51 subfamily A member 1; SC4MOL, sterol‐C4‐methyl oxidase‐like; NSDHL, NAD(P)H steroid dehydrogenase‐like; DHCR7, 7‐dehydrocholesterol reductase; DHCR24, 24‐dehydrocholesterol reductase; SPRING, SREBP regulating gene protein; Nala, sodium L‐lactate; MVA‐Li, mevalonic acid lithium salt; PPB, PCK1 phosphorylation blocker; Simv, Simvastatin; CIT, chemo‐immunotherapy; MDA, malondialdehyde.
FIGURE 8
FIGURE 8
Prognostic relevance of the pPCK1 in AKT‐hyperactivated ICC patients undergoing CIT. (A) Clinical outcomes for 36 resectable ICC patients receiving durvalumab (anti‐PD‐L1 antibody) combined with cisplatin and gemcitabine (TJ‐ICC‐CIT cohort). (B) Best percentage change from baseline in tumor burden per patient according to modified RECIST (mRECIST 1.1) criteria. (C) IHC assessment of AKT (pS473) and PCK1 (pSer90) in samples from TJ‐ICC‐CIT cohort, with radiographic images (CT scans) and corresponding IHC data for 3 representative patients with PR/PD/SD. (D) Quantitative IHC analysis comparing AKT (pS473) and PCK1 (pS90) expression levels between PD and SD+PR patients. Kaplan‐Meier analysis illustrates OS stratified by high (staining scores 4‐8) versus low (staining scores 0‐3) expression levels of AKT (pS473) and PCK1 (pS90). (E) UMAP plot of ICC tumor cells colored by patient (top) and PI3K‐AKT activity (bottom). The scRNA sequencing data of ICC tumor cells (n = 41,419, from 47 ICC patients) were collected from public datasets, and the PI3K‐AKT activity of ICC tumor cells was evaluated by PROGENy. (F) MVA pathway activation‐related scores were generated using Compass, and differential activity between PI3K‐AKT‐high and PI3K‐AKT‐low ICC tumor cells was analyzed. (G) CCA cell lines (n = 10) and ICC‐PDOs (n = 10) with varying levels of pAKT‐pPCK1 were classified into pAKT‐pPCK1 high and low groups, followed by quantitative analysis of MVA levels and the CoQ10H2/CoQ10 ratio. All data are mean ± SD. Statistical significance was determined using 2‐way ANOVA for multiple group comparisons and unpaired 2‐tailed t‐tests for comparisons between 2 groups. * P < 0.05; ** P < 0.01; *** P < 0.001; ns, not significant. Abbreviations: ORR, overall response rate; DCR, disease control rate; PR, partial response; SD, stable disease; PD, progressive disease; OS, overall survival; IHC, immunohistochemistry; CT, computed tomography; mRECIST 1.1, modified response evaluation criteria in solid tumors version 1.1; ICC, intrahepatic cholangiocarcinoma; PI3K‐AKT, phosphoinositide 3‐kinase‐protein kinase B pathway; CoQ10H2, reduced coenzyme Q10 (Ubiquinol); CoQ10, coenzyme Q10 (Ubiquinone); UMAP, uniform manifold approximation and projection; scRNA, single‐cell RNA sequencing.

References

    1. Rizvi S, Khan SA, Hallemeier CL, Kelley RK, Gores GJ. Cholangiocarcinoma ‐ evolving concepts and therapeutic strategies. Nat Rev Clin Oncol. 2018;15(2):95‐111. - PMC - PubMed
    1. Rauth S, Malafa M, Ponnusamy MP, Batra SK. Emerging Trends in Gastrointestinal Cancer Targeted Therapies: Harnessing Tumor Microenvironment, Immune Factors, and Metabolomics Insights. Gastroenterology. 2024;167(5):867‐84. - PMC - PubMed
    1. Oh D‐Y, Ruth He A, Qin S, Chen L‐T, Okusaka T, Vogel A, et al. Durvalumab plus gemcitabine and cisplatin in advanced biliary tract cancer. NEJM Evid. 2022;1(8):EVIDoa2200015. - PubMed
    1. Satriano L, Lewinska M, Rodrigues PM, Banales JM, Andersen JB. Metabolic rearrangements in primary liver cancers: cause and consequences. Nat Rev Gastroenterol Hepatol. 2019;16(12):748‐66. - PubMed
    1. Wang Y, Zheng L, Shang W, Yang Z, Li T, Liu F, et al. Wnt/beta‐catenin signaling confers ferroptosis resistance by targeting GPX4 in gastric cancer. Cell Death Differ. 2022;29(11):2190‐202. - PMC - PubMed

MeSH terms