. 2025 Dec;17(1):2508432.
doi: 10.1080/19490976.2025.2508432. Epub 2025 May 30.

Human microbiota influence the immune cell composition and gene expression in the tumor environment of a murine model of glioma

Affiliations

Human microbiota influence the immune cell composition and gene expression in the tumor environment of a murine model of glioma

George B H Green et al. Gut Microbes. 2025 Dec.

Abstract

Background: Immunotherapy has shown success against other cancers but not glioblastoma. Previous data has revealed that microbiota influences anti-PD-1 efficacy. We have previously found that, when using gnotobiotic mice transplanted with human fecal microbiota, the gut microbial composition influenced the response to anti-PD-1 in a mouse model of glioma. However, the role of the human microbiota in influencing the mouse immune cells in the glioma microenvironment and anti-PD-1 response was largely unknown. Using two distinct humanized microbiome (HuM) lines, we used single-cell RNA sequencing (scRNA-seq) to determine how gut microbiota affect immune infiltration and gene expression in a murine glioma model.

Methods: 16S rRNA sequencing was performed on fecal samples from HuM1 (H1) and HuM2 (H2) mice. Mice were intracranially injected with murine glioma cells (GL261), and on day 13 treated with one dose of isotype control or anti-PD1. Mice were euthanized on day 14 for analysis of all immune cells in the tumors by scRNA-seq.

Results: HuM1 and HuM2 mice had different microbial populations, with HuM1 being primarily dominated via Alistipes, and HuM2 being primarily composed of Odoribacter. Sc-RNA-seq of the tumor immune cells revealed 21 clusters with significant differences between H1 and H2 samples with a larger population of M1 type macrophages in H1 samples. Gene expression analysis revealed higher expression of inflammatory markers in the M1 population in H2 mice treated with anti-PD-1.

Conclusions: Microbial gut communities influence the presence and gene activation patterns of immune cells in the brain tumors of mice both under control (isotype) and following anti-PD-1 treatment.

Keywords: Microbiome; glioblastoma; immunotherapy; macrophage; scRNA-seq.

Plain language summary

Microbiota differences influenced numbers and activation of immune cells in a murine glioma model.One day after anti-PD-1 treatment, infiltrating inflammatory macrophages (MM1) increased significantly.HuM2 expressed larger amounts of Nos2 in MM1 cells.


Conflict of interest statement

No potential conflict of interest was reported by the author(s).

Figures

Figure 1.
Figure 1.
HuM1 and HuM2 are unique microbiota lines. (a) Schematic of microbiome samples. (b) The relative abundance of the top 10 taxa at the family level and genus level across HuM1 and HuM2 samples. (c) Boxplots revealing significant differences in taxa between HuM1 and HuM2. (d) Beta diversity was determined utilizing the Bray-Curtis and weighted UniFrac metrics. (e) Alpha-diversity measurements (observed ASVs, Shannon diversity index, and Simpson’s index) were determined within HuM1 and HuM2. (f) Dendrogram unique microbial compositions between HuM1 and HuM2 samples. *p < 0.01; **p < 0.01; ***p < 0.001.
Figure 2.
Figure 2.
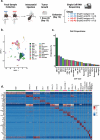
Single-cell RNA sequencing analysis of H1 and H2 samples. (a) Schematic of the single-cell experiment and sample assignments. (b) UMAP visualization of all H1 and H2 samples. Axes represent UMAP 1 and UMAP 2. (c) Bar plot showing the proportion of each cell type across samples. The y-axis represents the percentage of cells, and the x-axis represents the different sample groups. (d) Heatmap displaying the top three differentially expressed genes per cluster, ranked by average log2 Fold change, with pct.1 >0.5. The rows represent genes, and the columns correspond to cell clusters. All plots use a consistent color scheme for cell types, as indicated in the accompanying legend.
Figure 3.
Figure 3.
Single-cell analysis reveals differences between control and anti-PD-1 treatment samples. (a) UMAP visualization of H1 and H2 control samples. Axes represent UMAP 1 and UMAP 2. (b) UMAP visualization of H1 and H2 anti-PD-1-treated samples, with axes represent UMAP 1 and UMAP 2. (c) Stacked bar plot showing the proportion of each cell type across individual samples. The y-axis represents the percentage of cells, and the x-axis represents the sample groups. Panels (a–c) share a consistent color scheme for cell types. (d) Pie chart depicting the relative abundance of innate and adaptive immune cells across H1 and H2 samples. (e) Bar plot comparing cell type proportions between H1 control (blue) and H1 anti-PD-1-treated samples (Grey). (f) Bar plot comparing cell type proportions between H2 control (red) and H2 anti-PD-1-treated samples (Grey). Cell proportions were calculated as the percentage of each immune cell type relative to the total CD45+ population within the tumor microenvironment.
Figure 4.
Figure 4.
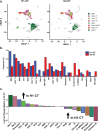
Single-cell analysis comparing H1-CT and H2-CT control samples. (a) UMAP visualization generated via Seurat (v5.1.0), highlighting T-cell and macrophage populations. Axes represent UMAP 1 and UMAP 2. (b) Bar plot showing the proportion of cell types in H1-CT (Blue) and H2-CT (red) samples. Cell proportions were calculated as the percentage of each immune cell type relative to the total CD45+ population within the tumor microenvironment. The y-axis represents the percentage of cells, and the x-axis represents the cell type. (c) Divergent bar plot displaying the differences in all identified cell clusters between H1-CT and H2-CT control samples.
Figure 5.
Figure 5.
Single-cell analysis comparing H1-PD and H2-PD treatment samples. (a) UMAP visualization generated via Seurat (v5.1.0), highlighting T-cell and macrophage populations. Axes represent UMAP 1 and UMAP 2. (b) Bar plot showing the proportion of cell types in H1-PD (blue) and H2-PD (red) samples. Cell proportions were calculated as the percentage of each immune cell type relative to the total CD45+ population within the tumor microenvironment. The y-axis represents the percentage of cells, and the x-axis represents the cell type. (c) Divergent bar plot displaying the differences in all identified cell clusters between H1-PD and H2-PD treatment samples.
Figure 6.
Figure 6.
Single cell analysis of MM1 (monocytes and macrophages type 1) cell population. (a) UMAP generated, subsetting MM1 cell population. (b) UMAP generated via Seurat (v5.1.0) of MM1 separated based on samples. (c) Dot plot generated via scanpy (v1.10.2) revealing differences of MM1 cell population between all sample groups. (d) Flow cytometry revealing differences between sample groups. *p < 0.05; **p < 0.01.

References

    1. Shah S. Novel therapies in glioblastoma treatment: review of Glioblastoma; current treatment Options; and novel oncolytic viral therapies. Med Sci. 2024;12(1):1. doi: 10.3390/medsci12010001. - DOI - PMC - PubMed
    1. Louis DN, Perry A, Wesseling P, Brat DJ, Cree IA, Figarella-Branger D, Hawkins C, Ng HK, Pfister SM, Reifenberger G, et al. The 2021 WHO classification of tumors of the central nervous system: a summary. Neuro Oncol. 2021;23(8):1231–18. doi: 10.1093/neuonc/noab106. - DOI - PMC - PubMed
    1. Sampson JH, Gunn MD, Fecci PE, Ashley DM. Brain immunology and immunotherapy in brain tumours. Nat Rev Cancer. 2020;20(1):12–25. doi: 10.1038/s41568-019-0224-7. - DOI - PMC - PubMed
    1. Lim M, Weller M, Idbaih A, Steinbach J, Finocchiaro G, Raval RR, Ansstas G, Baehring J, Taylor JW, Honnorat J, et al. Phase III trial of chemoradiotherapy with temozolomide plus nivolumab or placebo for newly diagnosed glioblastoma with methylated MGMT promoter. Neuro Oncol. 2022;24(11):1935–1949. doi: 10.1093/neuonc/noac116. - DOI - PMC - PubMed
    1. Omuro A, Brandes AA, Carpentier AF, Idbaih A, Reardon DA, Cloughesy T, Sumrall A, Baehring J, van den Bent M, Bähr O, et al. Radiotherapy combined with nivolumab or temozolomide for newly diagnosed glioblastoma with unmethylated MGMT promoter: an international randomized phase III trial. Neuro Oncol. 2023;25(1):123–134. doi: 10.1093/neuonc/noac099. - DOI - PMC - PubMed

MeSH terms

Substances

LinkOut - more resources