. 2025 May 15:16:1532058.
doi: 10.3389/fpls.2025.1532058. eCollection 2025.

Genomics reveal population structure, genetic diversity and evolutionary history of Phyllostachys edulis (moso bamboo) in global natural distribution

Affiliations

Genomics reveal population structure, genetic diversity and evolutionary history of Phyllostachys edulis (moso bamboo) in global natural distribution

Fangdi Li et al. Front Plant Sci. .

Abstract

Introduction: Moso bamboo (Phyllostachys edulis) is widespread in natural forests over large areas in China.

Methods: Here we collected 193 individuals of moso bamboo from 37 natural populations in China's distribution area. Genotyping by sequencing (GBS) was employed to elucidate the genetic diversity, genetic structure, selection pressure, history and adaptive distribution prediction of moso bamboo.

Results: The results revealed that the moso bamboo in China can be divided into central α, eastern β and southern γ subpopulations, with the α-subpopulation presumed to be the origin center. Notably, the genetic diversity of moso bamboo populations were relatively low, and the heterozygotes were excess. At the subpopulation level, the genetic diversity of α-subpopulation was the highest and that of β-subpopulation was the lowest. Analysis of population selection pressure during the transmission of moso bamboo indicated significant genetic differences among subpopulations. Furthermore, 3681 genes related to adaptability, stress resistance, photosynthesis, and hormone were identified from the selected regions. Four SNP markers developed and validated. Based on the population dynamics history and distribution simulation, we found that the distribution of moso bamboo has been influenced by the climate change in geological history.

Discussion: These findings hold significant implications for enhancing our genetic comprehension of bamboo populations and exploring germplasm resources.

Keywords: GBS; Phyllostachys edulis; genetic variation; germplasm resources; population structure.


Conflict of interest statement

The authors declare that the research was conducted in the absence of any commercial or financial relationships that could be construed as a potential conflict of interest.

Figures

Figure 1
Figure 1
Chromosome distribution of SNPs, InDels. (a) SNP labeling density. (b) InDel labeling density.
Figure 2
Figure 2
Analysis of population structure of moso bamboo. (a) Cross validation (CV) error value for different model (K) (b) Subpopulation structure of moso bamboo. The x-axis shows moso bamboo populations, and the y-axis quantifies the proportion of inferred ancestral lineages.
Figure 3
Figure 3
Three subpopulation structure of moso bamboo. (a) PCA analysis of moso bamboo, the PCA1 was 96.37% and the PCA2 was 3.63%. (b) Moso bamboo subpopulation distribution of China. Dots represent sampling distribution points, and colors represents subpopulations. Red shows central alpha subpopulation, pink shows eastern beta subpopulation, and purple shows southern gamma subpopulation. (c) Phylogeny tree of moso bamboo based on neighbor-joining method. Green represents central α-subpopulation, red represents eastern β-subpopulation, and orange represents southern γ-subpopulation.
Figure 4
Figure 4
Genetic variation of moso bamboo population. (a) Diversity (π) and the genetic distance (Fst) among subpopulations. The color represents sample subpopulation, blue represents central α-subpopulation, orange represents eastern β-subpopulation, and green represents southern γ-subpopulation. The radius of pie represents genetic diversity, and dashed line length represents Fst value between two subpopulations. (b) Genetic distance matrix of moso bamboo populations. (c) Results of the Mantel test of the relationship between geographic distance and genetic distance.
Figure 5
Figure 5
π ratio, Fst value distribution and selection pressure of moso bamboo subpopulation. (a) α vs β. (b) α vs γ. (c) β vs γ. The data points are located to the left and right of the vertical dotted lines (corresponding to the 5% left and right tails of the log2(π ratio) distribution, -1.75 and 0.36, -0.14 and 2.50, -0.55 and 0.36, -2.70 and 1.02, -0.55 and 3.59, -1.21 and 1.66, respectively). Above the horizontal dotted line (5% Fst right tail of the distribution, with Fst of 1.62, 1.35, 1.49, 2.22, 1.98, 1.76) was identified as the selection area for the two subpopulations (blue and green dots), respectively. X-axis represents enrichment factor, y-axis represents pathway name, dots size represents number of genes and dots color represents p-value. (d) Statistical map of selected genes of bamboo subpopulations. Yellow bars represent total number of genes, green bars represent unique or shared genes, blue circles represent unique genes, and black connecting circles represent shared genes.
Figure 6
Figure 6
GO and KEGG analysis of selected genes of moso bamboo subpopulation. (a) GO analysis of elected genes between α-subpopulation and β-subpopulation. (b) KEGG analysis of elected genes between α-subpopulation and β-subpopulation. X-axis represents rich factor, y-axis represents pathway name, dots size represents gene number, and dots color represents p-value, Vacancies indicate no selection genes and no GO and KEGG analysis results.
Figure 7
Figure 7
Nucleotide mismatch distribution and Population dynamics history of moso bamboo subpopulations. (a, d) α-subpopulation. (b, e) β-subpopulation. (c, f) γ-subpopulation. Red line represents median of 200 inferences based on subsampling. Dark gray lines represent 75% confidence interval of the inference. Light gray lines represent 95% confidence interval of the inference.
Figure 8
Figure 8
The geological history of moso bamboo simulated by MaxEnt. (a-c) ROC curve and jackknife test for forecasting three periods of moso bamboo based on MaxEnt model. (d-f) The contribution rate of climatic factors in the geological history of moso bamboo simulated by MaxEnt. (d) LIG period. (e) LGM period. (f) The current period.
Figure 9
Figure 9
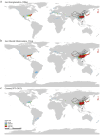
Distribution area of moso bamboo in geological history. (a) The last interglacial period (LIG). (b) The last glacial period (LGM). (c) The current period (Ct). Color indicates probability of suitable habitat for moso bamboo.

References

    1. Abdie O., Dagne K., Feyissa T., Tesfaye K., Durai J. (2020). Genetic diversity, population structure, and gene flow analysis of lowland bamboo [Oxytenanthera abyssinica (A. Rich.) Munro] in Ethiopia. Ecol. Evol. 10, 11217–11236. doi: 10.1002/ece3.6762 - DOI - PMC - PubMed
    1. Ahuja M., Jain S. (2016). Genetic diversity and erosion in plants: Case Histories. (Springer; ) 8, 357–407. doi: 10.1007/978-3-319-25954-3 - DOI
    1. Angst P., Ameline C., Haag C., Ben-Ami F., Ebert D., Fields P. (2022). Genetic drift shapes the evolution of a highly dynamic metapopulation. Mol. Biol. Evol. 39, msac264. doi: 10.1093/molbev/msac264 - DOI - PMC - PubMed
    1. Araújo B., Luoto M. (2007). The importance of biotic interactions for modelling species distributions under climate change. Global Ecol. Biogeogr. 16, 743–753. doi: 10.1111/j.1466-8238.2007.00359.x - DOI
    1. Cai M., Wen Y., Uchiyama K., Onuma Y., Tsumura Y. (2020). Population genetic diversity and structure of ancient tree populations of cryptomeria japonica var. sinensis based on RAD-seq data. Forests 11, 1192. doi: 10.3390/f11111192 - DOI

LinkOut - more resources