. 2025 May 25:20:6675-6699.
doi: 10.2147/IJN.S502031. eCollection 2025.

Proteomic Characterization of Extracellular Vesicles from Human Neural Precursor Cells: A Promising Advanced Therapy for Neurodegenerative Diseases

Affiliations

Proteomic Characterization of Extracellular Vesicles from Human Neural Precursor Cells: A Promising Advanced Therapy for Neurodegenerative Diseases

Priscila Elias Ferreira Stricker et al. Int J Nanomedicine. .

Abstract

Background: The therapeutic effect of stem cells is attributed to their direct maturation into somatic cells and their paracrine effects, which influence the extracellular environment. One such component released is extracellular vesicles containing proteins and genetic materials with immunomodulatory functions and facilitating cell-to-cell communication.

Purpose: The study's main objective was to characterize extracellular vesicles (EVs) from Human Neural Precursor Cells (hNPCs).

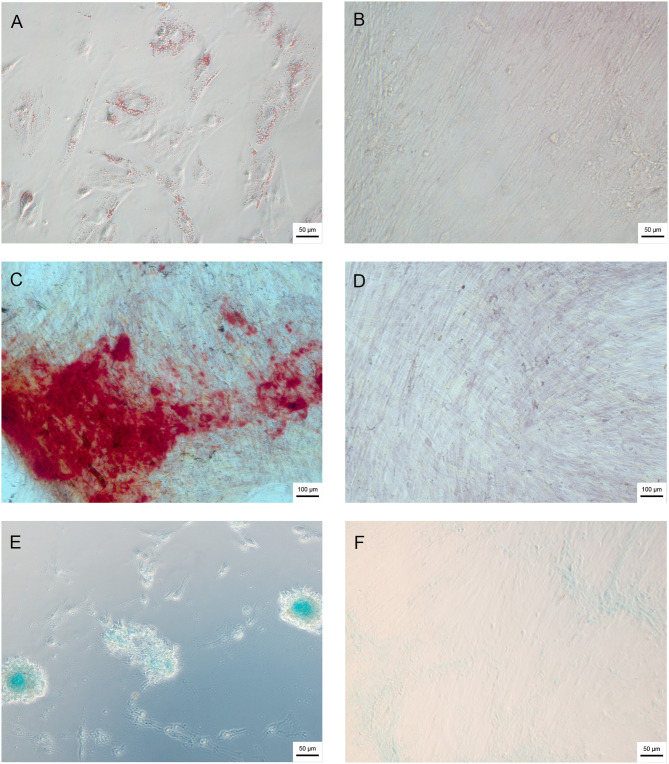
Methods: Wharton's Jelly mesenchymal stem cells (WJ-MSCs) were isolated by explant technique and characterized by flow cytometry and trilineage differentiation. The hNPCs obtained from neurospheres were produced by seeding WJ-MSCs on a natural functional biopolymer matrix. EVs derived from WJ-MSCs and hNPCs were isolated by precipitation methodology and characterized by flow cytometry, nanoparticle tracking analysis (NTA), scanning electron microscopy (TEM), and proteomic.

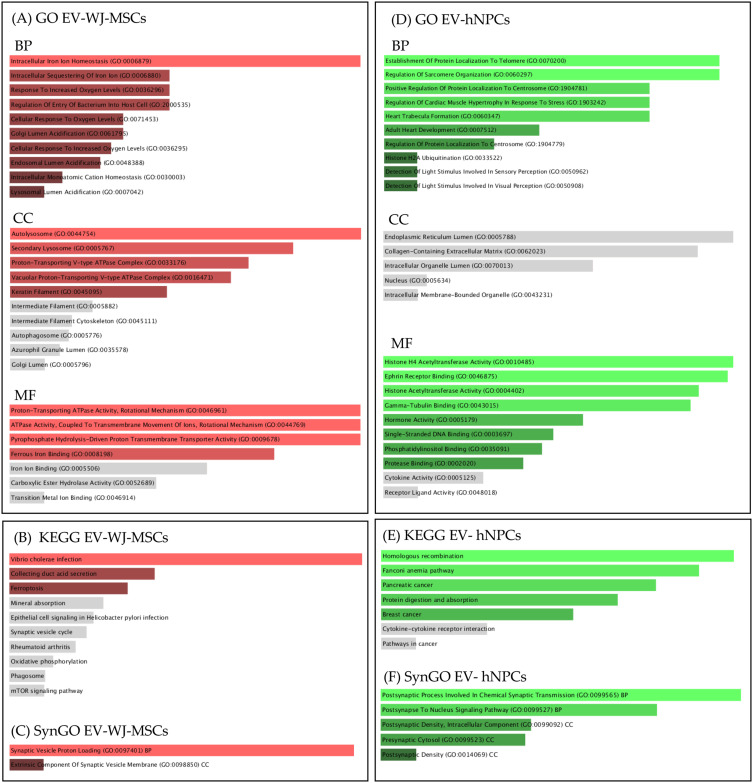
Results: hNPCs expressed proteins and genes characteristic of neural precursor cells. The EVs were characterized by flow cytometry and showed varied expression for the markers CD63, CD9, and CD81, indicating different subpopulations based on their origin of formation. NTA and TEM of the EVs exhibited characteristic size, shape, and structural integrity consistent with the criteria established by the International Society for Extracellular Vesicles (ISEV). EV-hNPCs function enrichment analysis of the proteomic results showed that these vesicles presented abundant proteins directly involved in neuronal biological processes such as plasticity, transduction, postsynaptic density, and overall brain development.

Discussion: The results indicate that EVs derived from hNPCs maintain key neural precursor characteristics and exhibit marker variability, suggesting distinct subpopulations. Their structural integrity aligns with ISEV standards, supporting their potential as reliable biological entities. The proteomic analysis highlights their role in neuronal functions, reinforcing their applicability in neurodegenerative research and therapeutic strategies.

Conclusion: The EVs were successfully isolated from hNPCs with abundant proteins involved in neuronal processes, making them attractive for acellular therapies to treat neurodegenerative diseases.

Keywords: Wharton’s Jelly; extracellular vesicles; mesenchymal stem cell; neural precursor cells; neurospheres.


Conflict of interest statement

The authors report no conflicts of interest in this work.

Figures

Figure 1
Figure 1
Trilineage Differentiation. (A) Adipogenic Differentiation. (B) Negative control of adipogenic differentiation (WJ-MSCs not induced to differentiation). (C) Osteogenic Differentiation. (D) Negative control of osteogenic differentiation. (E) Chondrogenic Differentiation. (F) Negative control of chondrogenic differentiation. Image obtained using an inversion optical microscope at 100x magnification (Axio Vert A1, Car Zeiss, Oberkochen, Germany).
Figure 2
Figure 2
Human Neuronal Precursor Cells production by NFBX. (A and B) Neurospheres forming from sample WJ-MSCs-seeded on NFBX. (C and D) Neurospheres formed on NFBX. (E and F) Expanding hNPCs in a 75cm2 culture bottle. Image obtained using an inversion optical microscope at 100x magnification (Axio Vert A1, Car Zeiss, Oberkochen, Germany).
Figure 3
Figure 3
Immunofluorescence of WJ-MSCs and hNPCs. In the first line, we have the WJ-MSCs labeled with anti-NESTIN (FITC), anti-BTUB-III (CY5) and anti-GFAP (FITC) antibodies, demonstrating the presence of Nestin, Beta Tubulin-III and Acid Protein glial fibrillation (GFAP). In the second line, the hNPCs labeled with anti-NESTIN (FITC), anti-BTUB-III (CY5) and anti-GFAP (FITC) antibodies, demonstrating the presence of the proteins Nestin, Beta Tubulin-III and Glial fibrillary acidic protein (GFAP). The Hoechst for nuclear marking. The image was obtained using the IN-Cell Analyzer 2000 Imaging System, GE Healthcare, UK, 200X magnification.
Figure 4
Figure 4
RT-PCR analysis to determine the expression of genes related to neural origin (NES, MAP2, GFAP, and TUBB3) in WJ-MSCs, hNPCs, and NP ReNcell. (A) Amplification of NES (240 bp), MAP2 (241 bp), and GFAP (769 bp) in WJ-MSCs, hNPCs, NP ReNcell, and CCD1059Sk. (B) Amplification of TUBB3 (385 bp) and β-ACT (564 bp) in the same cell groups. β-actin was used as an endogenous control.
Figure 5
Figure 5
Nano Sight graphics representing the characterization of EVs. The graphs represent the size of the EVs from each of the samples. (A) EV-WJ-MSCs-4E EVs from WJ-MSCs of sample 4E; (B) EV-hNPCs-4E VEs from the hNPCs of sample 4E; (C) VE-WJ-MSCs-5E VEs from WJ-MSCs of sample 5E; (D) EV-hNPCs-5E VEs from the NP of sample 5E; (E) VE-WJ-MSCs-6E VEs from WJ-MSCs of sample 6E; (F) EV-hNPCs-6E VEs from the hNPCs of sample 6E. (Nano sight - NS500).
Figure 6
Figure 6
Transmission electron microscopy of EV. Representation of EVs from WJ-MSCs (A) and from hNPCs (B). In the image we can see spheroid bodies representative of EVs in the 200 nm scale. (Jeol -Jem-1400 – Plus – Hitachi High Technologies, Tokyo, Japan).
Figure 7
Figure 7
Vein Diagram and Volcano plot comparing EV-WJ-MSCs and EV-hNPCs. (A) The Venn diagram showed that extracellular vesicles from different sources share about 500 proteins, with EV-WJ-MSCs having only 33 abundant and exclusive proteins and EV-hNPCs having only six abundant and exclusive proteins. (B) Each volcano plot represents a protein. Abscissa (x) represented log2(P-value) and ordinate (y) represented -log2(fold change). Red dots represent proteins that do not meet the criteria for fold change and q-value cutoffs. Green dots represent proteins that meet the fold change criteria but not the q-value cutoff. Orange dots represent proteins that meet both the fold change and q-value cutoffs but have shallow quantitative values, thus excluded from the analysis. Finally, blue dots represent proteins that meet all statistical filters and are considered statistically differentially abundant.
Figure 8
Figure 8
Differentially abundant presented proteins (DEPs) from EV-WJ-MSCs and EV-hNPCs. (A) DEPs from EV-hNPCs are represented in the green graph bar, and DEPs are represented in the red graph bar. (B) Co-abundance proteins from EV-WJ-MSCs. (C) Co-abundance proteins from EV-hNPCs.
Figure 9
Figure 9
Total protein gene ontology terms enriched, and KEGG diagram pathways from EV-WJ-MSCs and EV-hNPCs. (A) Gene Ontology terms of biological process (BP), cellular component (CC) and molecular function (MF) from EV-WJ-MSCs. (B) KEGG diagram enriched by the proteome from EV-WJ-MSCs. (C) Gene Ontology terms of biological process (BP), cellular component (CC) and molecular function (MF) from EV-hNPCs. (D) KEEG diagram enriched by the proteome from EV-hNPCs.
Figure 10
Figure 10
DEPs gene ontology terms enriched, and KEGG diagram pathways from EV-WJ-MSCs and EV-hNPCs. (A) Gene Ontology terms of biological process (BP), cellular component (CC) and molecular function (MF) from EV-WJ-MSCs. (B) KEGG diagram enriched by the proteome from EV-WJ-MSCs. (C) Gene Ontology terms of biological process (BP), cellular component (CC) and molecular function (MF) from EV-hNPCs. (D) KEEG diagram enriched by the proteome from EV-hNPCs.
Figure 11
Figure 11
Gene ontology terms enriched, KEGG pathway diagrams, and SynGO for proteins exclusively identified in EV-WJ-MSCs and EV-hNPCs. (A) Gene Ontology terms of biological process (BP), cellular component (CC) and molecular function (MF) from EV-WJ-MSCs. (B) KEGG diagram enriched by the proteome from EV-WJ-MSCs. (C) SynGO from EV-WJ-MSCs. (D) Gene Ontology terms of biological process (BP), cellular component (CC) and molecular function (MF) from EV-hNPCs. (E) KEEG diagram enriched by the proteome from EV-hNPCs. (C and F) SynGO from EV-hNPCs.

References

    1. Clarke D, Stanton J, Powers D, et al. Managing particulates in cell therapy: guidance for best practice. Cytotherapy. 2016;18(9):1063–1076. doi:10.1016/j.jcyt.2016.05.011 - DOI - PubMed
    1. Majors S. Regenerative medicine: the pipeline momentum builds H1. Alliance Regener Med. 2022;2022:1–30.
    1. Hu G, Drescher KM, Chen XM. Exosomal miRNAs: biological properties and therapeutic potential. Front Genet. 2012;3:56. doi:10.3389/fgene.2012.00056 - DOI - PMC - PubMed
    1. Thind A, Wilson C. Exosomal miRNAs as cancer biomarkers and therapeutic targets. J Extracell Vesicles. 2016;5(1). doi:10.3402/jev.v5.31292 - DOI - PMC - PubMed
    1. De Carvalho KAT, Steinhoff G, Chachques JC. Mesenchymal stem cell therapy in nonhematopoietic diseases. Stem Cells Int. 2015;2015:676903. doi:10.1155/2015/676903 - DOI - PMC - PubMed

MeSH terms

LinkOut - more resources