. 2025 May;30(5):055002.
doi: 10.1117/1.JBO.30.5.055002. Epub 2025 May 29.

Cherenkov light emission in external beam radiation therapy of the larynx

Affiliations

Cherenkov light emission in external beam radiation therapy of the larynx

Jigar Dubal et al. J Biomed Opt. 2025 May.

Abstract

Significance: Cherenkov light emitted in the tissue during radiation therapy enables unprecedented approaches to tumor functional imaging for early treatment assessment. Cherenkov light-based tomographic imaging requires image reconstruction algorithms based on internal light sources that, in turn, require knowledge about the characteristics of the Cherenkov light within the patient.

Aim: We aim to investigate the spatial and spectral characteristics of Cherenkov light within the patient and at the patient's surface, and the origin within the tissue of light reaching the surface, to provide insight for the development of image reconstruction algorithms for Cherenkov light-based tomographic imaging.

Approach: Numerical experiments using clinical patient data and Monte Carlo simulations are performed for the radiation therapy of laryngeal cancer for intensity-modulated radiation therapy and volumetric-modulated arc radiation therapy.

Results: The emitted Cherenkov light is concentrated in regions of high delivered dose, with the spatial distribution within the patient and at the patient's surface depending on the treatment type and patient anatomy. The Cherenkov light at the patient's surface is dominant in the near-infrared spectral region. Light emitted within the tumor emerges at the patient's surface on a well-defined radiation beam-independent region. The distribution within the patient of the emitted light that emerges on reduced areas on the patient's surface containing this region is similar to that of the light that emerges across the entire patient's surface.

Conclusions: Detailed information about the spectral and spatial characteristics of Cherenkov light is provided. In addition, these results suggest that surface light measurements restricted to smaller areas containing the region where the light emitted in the tumor emerges (that can be determined through simulations prior to the treatment) could enable probing the tumor while being easier to integrate with the radiotherapy system and while the effect of measurement data incompleteness on image reconstruction may not be too strong.

Keywords: Cherenkov light; radiation therapy; spatial and spectral characteristics.


Figures

Fig. 1
Fig. 1
Optical properties of the biological tissue used in this study. The graphs for tissue anisotropy factor for tumor and adipose tissue overlap.
Fig. 2
Fig. 2
3D view [(a) and (b)] and 2D view at an axial slice through the isocenter [(c) and (d)] of the two treatment beams for the IMRT treatment [(a) and (c)] and the two treatment arcs and radiation beams at the start of the arcs for the VMAT treatment [(b) and (d)]. L, R, A, and P indicate left, right, anterior, and posterior positions, respectively.
Fig. 3
Fig. 3
Dose distribution for IMRT and VMAT (in Gy) from the treatment planning system and Monte Carlo simulations on an axial slice at the tumor center. The tumor is indicated by a dotted contour, the axes units are in mm, and only a relevant part of the axial slice is presented for the IMRT patient.
Fig. 4
Fig. 4
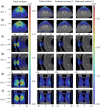
Distribution of delivered dose (in Gy) and the emitted Cherenkov light (photons per mm3) for each of the IMRT treatment beams [(a)–(d)] and VMAT treatment arcs [(e)–(h)] in an axial slice across the center of the tumor. The tumor is indicated by a dotted contour, and axes units are in mm.
Fig. 5
Fig. 5
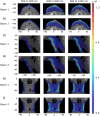
IMRT treatment. The Cherenkov light distribution at the patient’s surface for each IMRT beam, corresponding to photons emitted everywhere in the patient in the 500 to 1200 nm spectral range [(a) and (d)], in the 710 to 720 nm spectral range [(b) and (e)], and emitted only in the tumor in the 500 to 1200 nm spectral range [(c) and (f)]. The reduced measurement areas 1 and 2 are represented by a dashed red and dotted black box, respectively, in the right column.
Fig. 6
Fig. 6
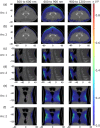
VMAT treatment. The Cherenkov light distribution at the patient’s surface for each VMAT arc, corresponding to photons emitted everywhere in the patient in the 500 to 1200 nm spectral range [(a), (b), (f), and (g)] in the 710 to 720 nm spectral range [(c), (d), (h), and (i)], and emitted only in the tumor in the 500 to 1200 nm spectral range [(e) and (j)]. The reduced measurement areas 1 and 2 are represented here by a dashed red and dotted black box, respectively, in the right column.
Fig. 7
Fig. 7
Normalized spectra of Cherenkov light spatially integrated over the entire patient volume (for the emitted light), and over the total surface of the patient and the tumor spot (for light at the surface) for each IMRT beam (a) and VMAT arc (b).
Fig. 8
Fig. 8
IMRT Treatment. The distribution of emitted Cherenkov light (photons per mm3) that contributes to the light across the whole patient’s surface within three spectral ranges for each radiation beam, in axial [(a) and (b)], sagittal [(c) and (d)], and coronal [(e) and (f)] slices at the tumor center. The tumor is indicated by a dotted contour and the axes units are in mm.
Fig. 9
Fig. 9
Same as for Fig. 8 but for VMAT treatment.
Fig. 10
Fig. 10
IMRT Treatment. The distribution (photons per mm3) for the 710 to 720 nm spectral range of the total emitted Cherenkov light and of the emitted light that contributes to the surface light across the entire patient’s surface and across the surfaces 1 (of width 10 cm) and 2 (of width 8 cm) presented in Fig. 5 for each treatment beam, in axial [(a)  and (b)], sagital [(c) and (d)], and coronal [(e) and (f)] slices at the tumor center. The tumor is indicated by a dotted contour and the axes units are in mm.
Fig. 11
Fig. 11
Same as for Fig. 10 but for each VMAT treatment arc and for the reduced measurement areas 1 (of width 10 cm) and 2 (of width 8 cm) illustrated in Fig. 6, in axial [(a) and (b)], sagittal [(c) and (d)], and coronal [(e) and (f)] slices at the tumor center.

References

    1. Frank I., Tamm I., “Coherent visible radiation of fast electrons passing through matter,” in Selected Papers, Bolotovskii B. M., et al., Eds., pp. 29–35, Springer; (1991).
    1. Spinelli A. E., et al. , “First human cerenkography,” J. Biomed. Opt. 18(2), 020502 (2013).JBOPFO10.1117/1.JBO.18.2.020502 - DOI - PubMed
    1. Jarvis L. A., et al. , “Initial clinical experience of cherenkov imaging in external beam radiation therapy identifies opportunities to improve treatment delivery,” Int. J. Radiat. Oncol. Biol. Phys. 109(5), 1627–1637 (2021).IOBPD310.1016/j.ijrobp.2020.11.013 - DOI - PMC - PubMed
    1. Hachadorian R. L., et al. , “Remote dose imaging from Cherenkov light using spatially resolved ct calibration in breast radiotherapy,” Med. Phys. 49(6), 4018–4025 (2022).MPHYA610.1002/mp.15614 - DOI - PMC - PubMed
    1. Dubal J., et al. , “Cherenkov light emission in molecular radiation therapy of the thyroid and its application to dosimetry,” Biomed. Opt. Express 13(4), 2431–2449 (2022).BOEICL10.1364/BOE.448139 - DOI - PMC - PubMed

Publication types

Associated data