. 2025 Aug;12(32):e01956.
doi: 10.1002/advs.202501956. Epub 2025 May 30.

Nephronectin (NPNT) is a Crucial Determinant of Idiopathic Pulmonary Fibrosis: Modulating Cellular Senescence via the ITGA3/YAP1 Signaling Axis

Affiliations

Nephronectin (NPNT) is a Crucial Determinant of Idiopathic Pulmonary Fibrosis: Modulating Cellular Senescence via the ITGA3/YAP1 Signaling Axis

Jiayu Guo et al. Adv Sci (Weinh). 2025 Aug.

Abstract

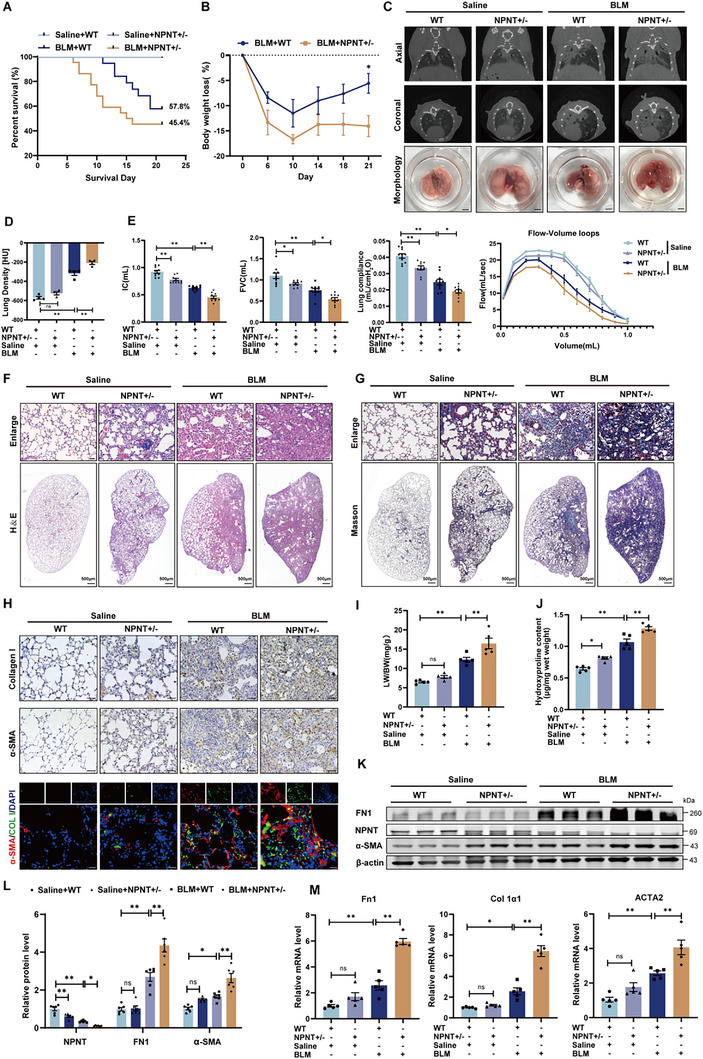
Idiopathic pulmonary fibrosis (IPF) is a prototype of chronic, progressive, and fibrotic lung disease. While advancing age is recognized as the most significant risk factor for both the development and mortality associated with pulmonary fibrosis, precise mechanisms underlying this association remain elusive. Here, Nephronectin (NPNT) is identified as an antiaging molecule, a potential major regulator of the progression of pulmonary fibrosis. In IPF patients, a marked reduction in NPNT expression is detected in lung tissues, which correlated with a decline in lung function. The study reveals that NPNT deficiency exacerbates bleomycin-induced senescence in alveolar epithelial cells, potentially intensifying fibrosis severity due to diminishes extracellular matrix turnover. Conversely, NPNT overexpression in the alveolar epithelium improves lung respiratory function and enhances resistance to aging and fibrosis. Mechanistically, NPNT inhibits the hyperactivation of LATS1 and MOB1, facilitates YAP1 nuclear translocation, and suppresses YAP1 ubiquitination and degradation, contingent upon the interaction between NPNT and ITGA3. Notably, pharmacological elevation of NPNT protein levels using Escin has been shown to alleviate pulmonary fibrosis and improve lung function in mice. The findings shed light on the key mechanism underlying stress-induced senescence and fibrosis, and offer a promising framework for interventions targeting aging-related diseases.

Keywords: cellular senescence; hippo; integrin α3; nephronectin; pulmonary fibrosis.


Conflict of interest statement

The authors declare no conflict of interest.

Figures

Figure 1
Figure 1
The expression of NPNT was downregulated in fibrotic lung tissues and injured alveolar epithelial cells. A) Transcriptome RNA‐seq datasets illustrating the transcriptional expression of secreted protein genes in IPF patients compared to the control group. Colors from red to blue represent log2 fold change values, with the IPF group relative to the control group. Statistical significance determined by two‐sided Wilcoxon rank‐sum test: * p < 0.05, ** p < 0.01, *** p < 0.001, **** p < 0.0001. B) Volcano plot based on data analysis of proteomics in IPF patients. n = 9 per group. C) According to the mean value of NPNT expression value, all samples were divided into NPNT high expression group and NPNT low expression group, and the corresponding lung function data (GSE47460) of patients were analyzed. D,E) The protein expression and tissue localization of NPNT were detected by immunoblotting and immunohistochemistry (n = 5 per group). F) Elisa assay was used to detect NPNT protein concentrations in the serum of healthy volunteers and IPF patients (n = 69 per group). G) Pearson correlation analysis of serum NPNT concentration and FEV1/FVC in patients with lung fibrosis (n = 41). H) The expression of NPNT in single‐cell transcriptome data derived from human PF samples has been analyzed, utilizing dataset author annotations from all samples within GSE135893. I) Comparison of NPNT expression in AT2 cells between the control group and PF group in the GSE135893 dataset, evaluated using a two‐sided Wilcoxon rank‐sum test (**** p < 0.0001). J) Tissue immunofluorescence staining identified the expression of NPNT in AT2 cells (n = 4). Scale bars = 20 µm. K) Western blotting and quantification showed the protein expression of fibronectin 1 (FN1) and NPNT in lung tissue samples of Saline‐ and BLM‐treated mice. (n = 6 samples per group). (L) The protein level of NPNT in MLE‐12 cells after BLM‐induced injury. (n = 5 samples per group). Data are presented as mean±SEM. * p < 0.05, ** p < 0.01, *** p < 0.001, **** p < 0.0001.
Figure 2
Figure 2
NPNT deficiency exacerbated BLM‐induced pulmonary fibrosis and pulmonary dysfunction in mice. A) Kaplan‐Meier analysis of WT and NPNT+/− mice 3 weeks after Saline or BLM surgery. Saline+WT n = 10, Saline+NPNT+/− n = 10, BLM+WT n = 19, BLM+NPNT+/− n = 22. B) Percentage of weight loss in mice over time after BLM induction. C) Micro‐CT imaging showed the shadow area of the mouse lung, and the bottom group was the morphology of mouse lung tissue. n = 4. Scale bars = 2 mm. D) Lung density in Hounsfield units (HU) based on micro‐CT images. E) After 3 weeks of Saline or BLM stimulation, the lung function of WT and NPNT+/− mice was tested, including IC, FVC, lung compliance, and flow‐volume loop (n = 8–10 per group). F,G) Representative images of H&E and Masson staining of WT and NPNT+/− mice 3 weeks after intratracheal injection of Saline or BLM. Scale bar, 50 µm. H) The pulmonary collagen deposition and myofibroblast formation of WT and NPNT+/− after BLM induction were detected by immunohistochemical staining (Scale bar, 50 µm) and immunofluorescence staining (Scale bar, 20 µm). n = 4 per group. I) The ratio of lung weight to body weight of mice was weighed and calculated (n = 5 per group). J) The content of hydroxyproline in mouse lung tissue was measured to reflect the decomposition of connective tissue (n = 5 per group). K,L) Western blotting and quantification showed protein levels of FN1, α‐SMA, and NPNT in WT and NPNT+/− mice after Saline or BLM injection. n = 6 per group. (M) Quantification of mRNA levels of Fn1, Col 1α1, and ACTA2. n = 5 samples per group. Data are presented as mean ± SEM. * p < 0.05, ** p < 0.01.
Figure 3
Figure 3
Specific overexpression of NPNT in AT2 cells inhibited the progression of pulmonary fibrosis and improved lung function in mice. A) Percentages of surviving NPNT‐cKI and NPNT‐fl/fl mice were plotted over a 21‐day period post‐BLM or ‐Saline administration. Saline+NPNT‐fl/fl n = 10, Saline+NPNT‐cKI n = 10, BLM+NPNT‐fl/fl n = 22, BLM+NPNT‐cKI n = 20. B) During the observation period of 21 days, the corresponding percentage of weight loss in each group was calculated. C) Representative images of the different groups were determined by micro‐CT imaging. Healthy lungs are black, and diseased lungs with elevated density are white. The appearance of lung tissue was shown in the bottom row (n = 4 per group). Scale bars = 2 mm. D) Lung density in Hounsfield units (HU). n = 4. E) Lung function parameters, including IC, FVC, lung compliance, and flow‐volume loop, among different groups were compared at day 21 post‐BLM or saline administration (n = 8–10 per group). F,G) NPNT‐fl/fl and NPNT‐cKI mice were treated with H&E staining and Masson staining on day 21 after BLM or Saline administration. The image on the upper panel is magnified from the micrograph on the lower panel. H) Immunohistochemical staining (Scale bar, 50 µm) and immunofluorescence staining (Scale bar, 20 µm) showed the expression levels of Collagen I and α‐SMA in lung tissues of different groups. I) Ratio of lung weight (LW) to body weight (BW) (n = 5 per group). J) Hydroxyproline content of lungs from NPNT‐fl/fl and NPNT‐cKI mice after BLM injection (n = 5 per group). K,L) The inhibitory effect of overexpression of NPNT on FN1 and α‐SMA protein levels was detected by Western blot. n = 6 per group. M) Quantitative real‐time PCR analysis of Fn1, Col 1α1, and ACTA2 mRNA levels in lung homogenates of BLM‐challenged NPNT‐fl/fl and NPNT‐cKI mice. n = 5 samples per group. Data are presented as mean±SEM. * p < 0.05, ** p < 0.01.
Figure 4
Figure 4
Overexpression of NPNT inhibited BLM‐induced epithelial cell senescence. A) Efficiency verification of NPNT overexpression plasmid (n = 5 per group). B) Western blot analysis of P16 and P21 expression. n = 4 samples per group. C) SA‐β‐gal staining was used to evaluate the senescence of MLE‐12 cells transfected with NPNT overexpression plasmid after BLM treatment. Scale bar, 50 µm. D) The proliferation ability of different groups of MLE‐12 cells was calculated by EdU‐positive cells. n = 5. Scale bar, 50 µm. E) The ROS levels in cells overexpressing NPNT after BLM treatment were labeled with DCFH‐DA probe. n = 4 samples per group. Scale bar, 50 µm. F) The morphological changes of mitochondria in living cells were shown by representative images of immunofluorescence. Scale bar, 15 µm. G) Representative images of SA‐β‐gal (Scale bar, 50 µm), immunohistochemical (Scale bar, 20 µm), and immunofluorescence staining (Scale bar, 20 µm) in NPNT‐fl/fl and NPNT‐cKI mice 3 weeks after Saline or BLM administration. n = 4 samples per group. H,I) The protein levels of P21 and P16 were quantitatively analyzed by Western blot (n = 6 per group). J) Determination of CXCL1, CCL2, and IL‐1β mRNA levels in lung tissues of NPNT‐fl/fl and NPNT‐cKI mice after Saline or BLM injection (n = 5 per group). K) Immunofluorescence staining was used to detect the expression changes of SPC and AQP5 in mouse lung sections. Scale bar, 20 µm. Data are presented as mean±SEM. * p < 0.05, ** p < 0.01.
Figure 5
Figure 5
NPNT regulated the Hippo/YAP1 axis in MLE‐12 cells. A) GSEA enrichment analysis of silencing NPNT‐mediated differential genes. B) Enrichment score of the Hippo signaling pathway. C) Transcriptome expression levels of Hippo signaling pathway related genes after siNC and siNPNT transfection (n = 3 per group). D,E) Representative diagram of YAP1 protein expression after overexpression and silencing of NPNT, respectively (n = 4 per group). F) Nuclear/cytoplasmic isolation and Western blot analysis revealed YAP1 translocation. GAPDH and Lamin B were used as cytoplasmic and nuclear markers, respectively (n = 5 per group). G) Immunohistochemical staining revealed YAP1 expression and cellular localization in the lung tissues of NPNT‐fl/fl and NPNT‐cKI mice. n = 4 samples per group. Scale bar, 20 µm. H) Representative images taken by confocal fluorescence microscopy showed the intracellular distribution of YAP1 in MLE‐12 cells after different treatments (n = 4 per group). Scale bar, 20 µm. I) Effect of silencing NPNT on protein expression or phosphorylation of Hippo signaling components. J) YAP1 protein immunoprecipitation was used to measure phosphorylation rate of YAP1. K) MLE‐12 cells transfected with siNC or siNPNT were treated with proteasome inhibitor MG132. The expression of YAP1 was detected by Western blot. Numbers indicated the relative intensity of the band of YAP1 against β‐actin. n = 4 samples per group. L,M) MLE‐12 cells silencing NPNT or overexpressing NPNT, respectively, were treated with CHX for the indicated time. The expression level of YAP1 was detected by Western blot (n = 3 per group). N) siNC and siNPNT were transfected in MLE‐12 cells to evaluate the effect of silencing NPNT on YAP1 ubiquitination. Cells were treated with MG132 before harvesting to avoid degradation of ubiquitinated proteins. Data are presented as mean±SEM. * p < 0.05, ** p < 0.01.
Figure 6
Figure 6
Combination of ITGA3 and NPNT regulates Hippo signal and YAP1 degradation. A) Transcriptome and proteomic analysis of integrin family members in IPF patients versus control group. B–D) Single‐cell dataset was used to analyze the cellular localization of ITGA3 and the expression of ITGA3 in control and IPF patients. E) Western blot and quantitative analysis showed the protein level of ITGA3 in lung tissue of non‐IPF and IPF patients. n = 6 samples per group. F) Immunohistochemical staining detection of ITGA3 expression and tissue localization in IPF patients and BLM‐induced pulmonary fibrosis mice (n = 4 per group). Scale bar, 50 µm. G) Fluorescence co‐localization of NPNT and ITGA3 in MLE‐12 cells. Scale bar, 20 µm. H) Surface diagram of the docking model and its interfacing residues between NPNT and ITGA3 protein (NPNT, orange; ITGA3, blue; hydrogen bond interaction, dotted line). I) Co‐IP analysis of the interaction between NPNT and ITGA3 in MLE‐12 cells. J) Immunoprecipitation of NPNT was performed using anti‐ITGA3 antibodies, and the binding ability of NPNT and ITGA3 between the two groups was detected by Western blotting. K) Representative Western blots showed the protein levels of p‐LATS1, LATS1, YAP1, MST1, p‐MOB1, and MOB1 in MLE‐12 cells. n = 4 per group. L) ITGA3 was silenced or not under the premise of NPNT overexpression. After BLM induction for 24 h, cells were treated with MG132 and collected. Whole cell lysates were subjected to YAP1 antibody immunoprecipitation and Western blot with anti‐Ubiquitinated antibody to detect YAP1 ubiquitination. M) Representative Western blot bands and statistical data showed the protein level of P21 in siITGA3‐treated cells after NPNT overexpression. n = 4 per group. Data are presented as mean±SEM. * p < 0.05, ** p < 0.01.
Figure 7
Figure 7
ITGA3 deletion abolished the antifibrotic effect of NPNT overexpression. A,B) Axial and corresponding coronal micro‐CT images were obtained 21 days after BLM administration, and lung density was quantitatively analyzed. n = 4. C) The lung function parameters, such as IC, FVC, and lung compliance, were compared among the groups after 21 days of BLM administration. n = 6 per group. D,E) In the context of BLM‐induced pulmonary fibrosis, H&E and Masson's trichrome staining representative images of lung sections of NPNT‐cKI mice injected with AAV6‐shITGA3 or AAV6‐shNC. n = 4 per group. Scale bar of upper images, 50 µm. Scale bar of bottom images, 500 µm. F) Immunofluorescence staining (Scale bar, 20 µm) and immunohistochemical staining (Scale bar, 50 µm) images showed the expression of Collagen I and α‐SMA in lung tissues. n = 4 per group. G) Western blot was used to detect the protein levels of FN1 and α‐SMA in the lung tissue of NPNT‐cKI mice lacking ITGA3. n = 3 per group. (H) Real‐time quantitative reverse transcription polymerase chain reaction analysis of Fn1, Col 1α1, and ACTA2 mRNA expression in mice treated with BLM. n = 5 per group. I) SA‐β‐gal and IHC staining images of lung sections from NPNT‐cKI mice treated with AAV6‐shITGA3 or AAV6‐shNC. J) Western blot was used to analyze the protein expression of P21 and P16 in each group of mice after BLM administration. n = 3 per group. (K) Western blot analysis and statistical data showed that the protein levels of YAP1, TAZ, p‐LATS1, and LATS1 in the lungs of NPNT‐cKI mice were treated with ITGA3 knockdown. n = 3 per group. Data are presented as mean±SEM. * p < 0.05, ** p < 0.01.
Figure 8
Figure 8
Escin treatment alleviated the progression of pulmonary fibrosis through reducing lung tissue aging. A) Hek‐293T cells expressing NPNT‐EGFP were treated with 3105 compounds, and the fluorescence intensity was detected. The heat map depicted the EGFP intensity of cells treated with ten identified compounds. B) Schematic diagram of Escin treatment in BLM‐induced pulmonary fibrosis mouse model. C) Micro‐CT images displayed the shadow area of the lungs of mice using Escin after BLM administration. n = 4 per group. D,E) H&E staining and Masson's trichrome staining of mouse lung sections reflected lung tissue structure and collagen accumulation. Scale bar, 50 µm. F) Representative images of immunofluorescence (Scale bar, 20 µm) and immunohistochemical staining (Scale bar, 50 µm) in lungs of mice treated with or without Escin after BLM induction. n = 4 per group. G) Representative images of immunohistochemistry and SA‐β‐gal staining in lungs of mice with or without Escin after intratracheal injection of saline or BLM. n = 4 per group. H) Western blot and quantification showing protein levels of FN1, α‐SMA, P21, and P16 in WT and Escin mice 3 weeks after Saline or BLM treatment. n = 6 per group. I–J) The mRNA levels of fibrosis‐related markers and inflammatory factors in each group were measured quantitatively. n = 5 per group. Data are presented as mean±SEM. * p < 0.05, ** p < 0.01.
Figure 9
Figure 9
A mechanistic model of NPNT binding integrin receptor ITGA3 mediated Hippo/YAP1 axis in pulmonary fibrosis. In the normal lung, NPNT combines with ITGA3 in alveolar epithelial cells, mediates the polymerization degree of F‐actin, inhibits the excessive activation of Hippo pathway kinase, and is conducive to YAP1 nuclear entry to play the role of a transcription factor. However, in pulmonary fibrosis, NPNT expression is significantly downregulated, which leads to YAP1 retention in the cytoplasm and degradation by ubiquitin proteasome. Inactivation of YAP1 subsequently causes mitochondrial dysfunction and alveolar epithelial cell senescence, releases a large amount of SASP, stimulates ECM deposition and myofibroblast generation, and finally promotes the progression of pulmonary fibrosis.

References

    1. Podolanczuk A. J., Thomson C. C., Remy‐Jardin M., Richeldi L., Martinez F. J., Kolb M., Raghu G., Eur. Respir. J. 2023, 61, 2200957. - PubMed
    1. Zhao R., Wang Z., Wang G., Geng J., Wu H., Liu X., Bin E., Sui J., Dai H., Tang N., Cell Stem Cell 2024, 31, 1344. - PubMed
    1. Kim J. S., Murray S., Yow E., Anstrom K. J., Kim H. J., Flaherty K. R., Martinez F. J., Noth I., Chest 2024, 165, 1163. - PMC - PubMed
    1. Liu H., Shen J., He C., Chinese Med. J. Pulm. Crit. Care Med. 2025, 3, 12. - PMC - PubMed
    1. Guan R., Yuan L., Li J., Wang J., Li Z., Cai Z., Guo H., Fang Y., Lin R., Liu W., Wang L., Zheng Q., Xu J., Zhou Y., Qian J., Ding M., Luo J., Li Y., Yang K., Sun D., Yao H., He J., Lu W., Eur. Respir. J. 2022, 60, 2102307. - PMC - PubMed

MeSH terms

LinkOut - more resources