. 2025 May 22;53(10):gkaf435.
doi: 10.1093/nar/gkaf435.

DNMT3A-dependent DNA methylation shapes the endothelial enhancer landscape

Affiliations

DNMT3A-dependent DNA methylation shapes the endothelial enhancer landscape

Stephanie Gehrs et al. Nucleic Acids Res. .

Abstract

DNA methylation plays a fundamental role in regulating transcription during development and differentiation. However, its functional role in the regulation of endothelial cell (EC) transcription during state transition, meaning the switch from an angiogenic to a quiescent cell state, has not been systematically studied. Here, we report the longitudinal changes of the DNA methylome over the lifetime of the murine pulmonary vasculature. We identified prominent alterations in hyper- and hypomethylation during the transition from angiogenic to quiescent ECs. Once a quiescent state was established, DNA methylation marks remained stable throughout EC aging. These longitudinal differentially methylated regions correlated with endothelial gene expression and highlighted the recruitment of de novo DNA methyltransferase 3a (DNMT3A), evidenced by its motif enrichment at transcriptional start sites of genes with methylation-dependent expression patterns. Loss-of-function studies in mice revealed that the absence of DNMT3A-dependent DNA methylation led to the loss of active enhancers, resulting in mild transcriptional changes, likely due to loss of active enhancer integrity. These results underline the importance of DNA methylation as a key epigenetic mechanism of EC function during state transition. Furthermore, we show that DNMT3A-dependent DNA methylation appears to be involved in establishing the histone landscape required for accurate transcriptome regulation.


Conflict of interest statement

None declared.

Figures

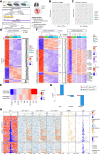
Graphical Abstract
Graphical Abstract
Figure 1.
Figure 1.
Methylation-correlating gene transcription shows differential DNA methylation distal to the TSS. (A) Scheme showing the longitudinal timeline for methylome sample collection and the additional methylome and transcriptome datasets used. For all the datasets, pulmonary capillary ECs were subjected to FACS and used for library generation. Single-datatype analysis and data integration were performed. In this study, methylome data were generated using WGSB. Identified DMRs between ECinf and ECyAdu were donated as cross-sectional DMRs. DMRs identified during EC state transition using ECinf as a reference point were termed longitudinal DMRs. n= 3 for each age group. The scheme was created in BioRender. Augustin, H. (2025) https://BioRender.com/k83b042. (B) Methylome-based Principal Component Analysis (PCA) plot showing all the identified DMRs from all samples of the longitudinal timeline. (C) Methylome-based PCA plot showing DMRs detected in CGIs from all samples of the longitudinal timeline. (D) Heatmap displaying the scaled methylation level as z-score for 1,558 DMRs (left) and their distance to the nearest TSS (right). DMRs were clustered based on their genomic location (CGI shore, others, CGI). The distance to the nearest TSS is displayed as log10(). (E) Genomic enrichment analysis of longitudinal DMRs separated by their methylation direction into longitudinal hypo- and hyper-DMRs. ECinf was used as a reference point. (F) Heatmap displaying the scaled methylation of 448 DMRs as z-score (left) with a high correlation (|cor| > 0.5 and adjusted P-values <0.05) to scaled gene expression (right). Endothelial genes showing a high correlation between DNA methylation and gene transcription are highlighted at the site of the gene expression heatmap (right). The middle plot shows the DMR association either as CGI or other, and the distance to the nearest TSS. (G) Bar plot showing the fold enrichment of positively correlated DMRs across genomic regions. Hypermethylated DMRs in ECyAdu are labeled as "low in ECinf and high in ECyAdu", while hypermethylated DMRs in ECinf are labeled as "high in ECinf and low in ECyAdu". (H) Heatmap enriched for the 315 genes showing a high correlation between methylation and gene expression (|cor| > 0.5 and adjusted P-values <0.05). Panel 1 displays the mean methylation level in a gene-centric way for angiogenic ECinf, followed by panels 2–4, with the methylation difference between ECinf and ECyAdu, ECinf and ECmAdu, and ECinf and ECaged samples. Panel 5 shows the called DMRs. Panel 6 indicates the presence of a CGI at the TSS.
Figure 2.
Figure 2.
Context-dependent impact of DNA methylation on chromatin accessibility. (A) Differential chromatin accessibility in the TSS of genes showing a methylation–transcription correlation in ECinf versus ECyAdu (panel 1) and in ECinf versus ECmAdu (panel 2). The enrichment plot displays the binding motives for DNMT3A (panel 3) and DNMT3B (panel 4). n= 3 for each age group. (B) qPCR of pulmonary ECs isolated from infant and young adult mice showing the expression of DNA modifiers. n= 6 per age group. The data are presented as the means ± SDs. P-values were determined by the Mann−Whitney test. ***P<0.001, **** P<0.0001. (C) Representative images of infant and young adult lung sections stained for CD31 (vascular surface), DNMT3A (DNA methyltransferase), and Hoechst (nucleus). Scale bar: 20 μm.
Figure 3.
Figure 3.
Loss of DNMT3A-dependent DNA methylation results in mild gene deregulation. (A) Schematic overview showing the sample collection of pulmonary ECs isolated from Dnmt3a WT and Dnmt3a KO infant mice. FACS-sorted pulmonary ECs were further used for methylome, transcriptome, chromatin accessibility, and histone landscape analysis. The scheme was created in BioRender. Augustin, H. (2025) https://BioRender.com/k83b042. (B) Pie diagram displaying the relative number of DMRs upon the loss of Dnmt3a located distal (distance > 5 kb) or local (distance ≤ 5 kb) to the nearest TSS. (C) Genomic enrichment of distal DNMT3A-dependent DMRs. (D) Genomic enrichment of local DNMT3A-dependent DMRs. (E) Heatmap showing DNMT3A-dependent DMRs (left) and 258 associated genes (middle) that were differentially expressed (adjusted P-value <0.05) in Dnmt3a KO ECs compared to WT ECs. The distance of the DMRs to the gene TSS is shown on the right as log10() in bp. For both, methylome and transcriptome analyses, three biological replicates were used for each genotype. (F) Gene ontology analysis based on the biological functions of 258 differentially expressed genes (DEGs) that were associated with DNMT3A-dependent DNA methylation changes. A heatmap (left) displays the clustering of GO terms based on similarity (range: 0–0.8). The letter size represents the significance of the GO term (right). (G) Schematic representation of the sprouting assay. Control and shDNMT3A cell lines were analyzed under baseline conditions and angiogenic stimulation with recombinant human VEGF (rhVEGF) supplementation. The scheme was created in BioRender. Augustin, H. (2025) https://BioRender.com/k83b042. (H) Quantification of DNMT3A knockdown efficacy in HUVECs following lentiviral transduction with shDNMT3A (sh#1, sh#2) or control shRNA (nsh). Data represent n= 3 biological replicates per cell line and are presented as mean ± SD. Statistical significance was assessed using an unpaired t-test. **P<0.01. (I) Representative images of spheroids formed by HUVECs transduced with control shRNA or shDNMT3A. The spheroid assay was conducted under baseline conditions or upon angiogenic induction with rhVEGF. (J) Quantification of the number of sprouts in spheroids formed by HUVECs transduced with control shRNA or shDNMT3A constructs. Data represent n= 3 biological replicates per cell line and are presented as the mean ± SD. Statistical significance was determined using an unpaired t-test. *P<0.05. (J) Quantification of the average sprout length, expressed as fold change, in HUVECs transduced with control shRNA or shDNMT3A constructs. Data represent n= 3 biological replicates per cell line and are presented as the mean ± SD. Statistical significance was determined using an unpaired t-test. *P<0.05.
Figure 4.
Figure 4.
The absence of DNMT3A-dependent DNA methylation results in enhancer loss. (A) Bar plot showing the number of identified regulatory elements and silent chromatin in Dnmt3a WT and KO pulmonary ECs. (B) Circos plot showing the transition of all regulatory regions identified in Dnmt3a WT pulmonary ECs compared with Dnmt3a KO ECs. Regions are depicted in bp. (C) Focused circos plot of identified active enhancers in Dnmt3a WT pulmonary ECs (23,267,740 bp) and their change into other CRE categories in Dnmt3a KO ECs. This plot only focuses on active enhancers in WT ECs and does not include newly established active enhancers in KO ECs, which were gained due to conversions from non-assigned regions, among others, in WT ECs. Regions are depicted in bp. (D) Gene ontology analysis based on lost active enhancer regions in Dnmt3a WT compared to Dnmt3a KO ECs. GO terms were based on similarity, ranging from 0 to 0.8 (panel 3). The letter size represents the significance of the GO term (right). (E) Gene ontology analysis based on consistent active enhancer regions identified in both Dnmt3a WT and Dnmt3a KO ECs. GO terms were based on similarity, ranging from 0 to 0.8 (panel 3). The letter size represents the significance of the GO term (right).

References

    1. Herbert SP, Stainier DYR Molecular control of endothelial cell behaviour during blood vessel morphogenesis. Nat Rev Mol Cell Biol. 2011; 12:551–64. 10.1038/nrm3176. - DOI - PMC - PubMed
    1. Trimm E, Red-Horse K Vascular endothelial cell development and diversity. Nat Rev Cardiol. 2023; 20:197–210. 10.1038/s41569-022-00770-1. - DOI - PMC - PubMed
    1. Ricard N, Bailly S, Guignabert C et al. The quiescent endothelium: signalling pathways regulating organ-specific endothelial normalcy. Nat Rev Cardiol. 2021; 18:565–80. 10.1038/s41569-021-00517-4. - DOI - PMC - PubMed
    1. Schlereth K, Weichenhan D, Bauer T et al. The transcriptomic and epigenetic map of vascular quiescence in the continuous lung endothelium. eLife. 2018; 7:e34423. 10.7554/eLife.34423. - DOI - PMC - PubMed
    1. Cedar H, Bergman Y Linking DNA methylation and histone modification: patterns and paradigms. Nat Rev Genet. 2009; 10:295–304. 10.1038/nrg2540. - DOI - PubMed

Substances

LinkOut - more resources