. 2025 Jun 1;46(8):e70223.
doi: 10.1002/hbm.70223.

Event-Marked Windowed Communication: Inferring Activity Propagation from Neural Time Series

Affiliations

Event-Marked Windowed Communication: Inferring Activity Propagation from Neural Time Series

Varun Madan Mohan et al. Hum Brain Mapp. .

Abstract

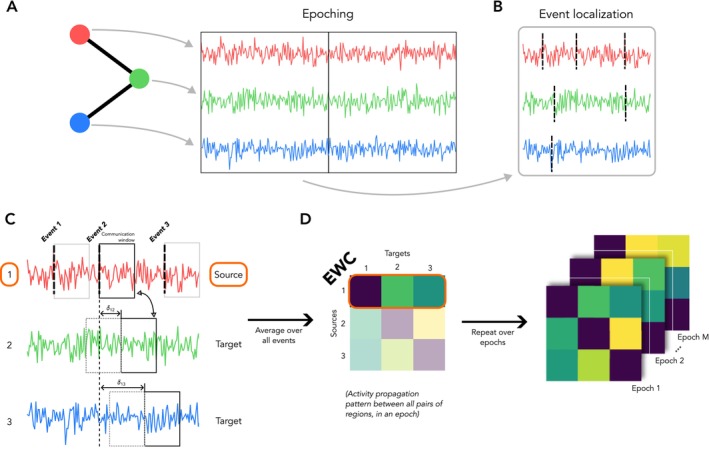
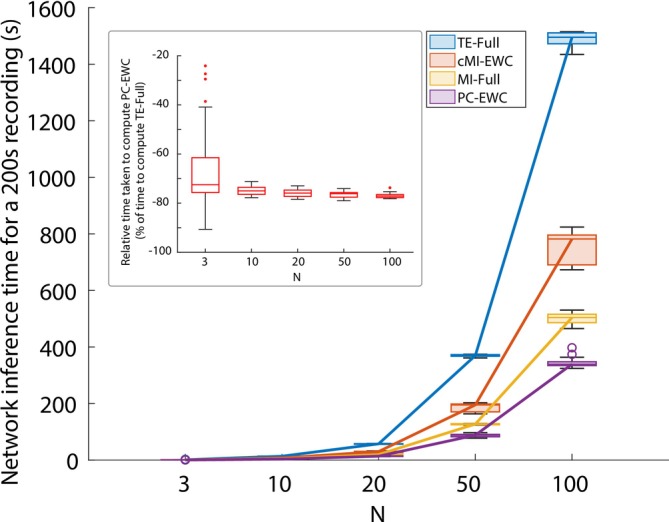
Tracking how activity or signal perturbations propagate in nervous systems is crucial to understanding interareal communication in the brain. Current analytical methodologies are not well suited to systematically infer interareal activity propagation from neural time series recordings. Here, we propose Event-marked Windowed Communication (EWC), a framework to infer activity propagation between neural elements by tracking the statistical consequence of spontaneous, endogenous regional perturbations. EWC tracks the downstream effect of these perturbations by subsampling the neural time series and quantifying statistical dependences using established functional connectivity measures. We test EWC on simulations of neural dynamics and demonstrate the retrieval of ground truth motifs of directional signaling, over a range of model configurations. We also show that EWC can capture activity propagation in a computationally efficient manner by benchmarking it against more advanced FC estimation methods such as transfer entropy. Lastly, we showcase the utility of EWC to infer whole-brain activity propagation maps from magnetoencephalography (MEG) recordings. Networks computed using EWC were compared to those inferred using transfer entropy and were found to be highly correlated (median r = 0.81 across subjects). Importantly, our framework is flexible and can be applied to activity time series captured by diverse functional neuroimaging modalities, opening new avenues for the study of neural communication.

Keywords: MEG; connectome; functional connectivity; neural communication.


Figures

FIGURE 1
FIGURE 1
A pipeline to estimate communication patterns from regional time series. (A) Regional activities are divided into epochs of fixed length, and each epoch is processed independently. (B) For each epoch, the regional activities are individually z‐scored to identify instances of deviation from mean behavior, which are termed “supra‐threshold events”. (C) Each region is successively chosen as a “source”. For each event of a source, a communication window that encompasses the activity over a duration of 1 s, is defined starting at the time point of the event. Similar communication windows are defined over the activities of all other regions (termed “targets”), starting at timepoints delayed with respect to the source event, in proportion to the Euclidean distance between the source and target. (D) For each event for a chosen source, the Event‐marked Windowed Communication (EWC) is estimated between the source and all possible targets by computing the functional connectivity between the activities contained in the communication windows of the source and target. The past activity of the target is used as the conditioning variable. The pairwise EWC values over all events of a source (within an epoch) are averaged, to populate a row of the EWC matrix corresponding to the source index. Steps (B–D) are repeated over all epochs to give epoch‐level EWC matrices that capture the dynamic communication patterns over the entire scan duration.
FIGURE 2
FIGURE 2
Communication over a network motif. (A) We test our method of estimating communication patterns on a simple 4‐node network motif with three connected nodes (nodes 1, 2, and 3) and an isolated node (node 4). The solid black edges and the dashed grey edge indicate the presence and absence of a ground truth connection respectively. The activities of the individual nodes in this network are described by a Linear Stochastic Model. The dynamics of the red, blue and cyan nodes have an additional Poisson process, causing it to spike at an average rate of 0.2 Hz, emulating communication events. δxy is the delay between nodes x and y, in ms. The noise amplitude of the LSM, σ, is varied relative to the fixed Poisson pulse amplitude of the sources. (B) 10s of simulated activity of the network in (A). The dashed lines at the location of the pulses mark communication events used in the EWC protocol. Note that in addition to nodes 1 and 3, events are detected in node 4 as well, based on its pulses. (C) Transfer entropy (in nats) between nodes, estimated over the full signal. (D) Conditional Mutual Information (in nats) between nodes, estimated as per the EWC protocol (E) Partial Correlation (Pearson‐R) between nodes, estimated as per EWC. We show only the absolute correlation strengths. (F–H) Standardized contrast (difference between FC estimated between of True and False connections that is, solid and dashed edges in (A), normalized by their pooled standard deviation) plots associated with the FC estimates. A non‐zero contrast value quantifies the discriminability between estimates. Shading in the plots represent ± SEM (20 trials). All plots maximally smoothed (i.e., using all available points) to clearly reveal trends.
FIGURE 3
FIGURE 3
Time taken for network inference as a function of network size. Signals spanning 200s (Twenty 10s epochs) sampled from source‐localized MEG recordings of three subjects. Sampling repeated 10 times per subject for each network size (each box plot spanning 30 data points). Circles represent outliers. (Inset) Percentage of time taken to compute PC‐EWC, relative to the time taken to compute TE‐Full. For a range of network sizes, PC‐EWC takes ≈75% less time to compute for a 200s scan, or equivalently, is ≈4 times faster.
FIGURE 4
FIGURE 4
Application of EWC on source‐localized MEG recordings. (A) Resting‐state MEG scans of 30 subjects from the Human Connectome Project (HCP) were pre‐processed, source localized, orthogonalized, and epoched into 10 s segments. (B) (Top) The subject‐level FC for the left hemisphere was estimated as PC‐EWC and TE‐Full. (Bottom) Edgewise correlation distribution between the subject‐level FC matrices. The red line marks the median correlation. (C) (Top) Scatterplot of edge weights for a representative subject (closest to the median correlation). Correlation after excluding outliers (> 4 standard deviation) − r ≈ 0.87, p < 0.0001. (Bottom) inference time per epoch across subjects, for each of the methods.

Similar articles

References

    1. Abeysuriya, R. G. , Hadida J., Sotiropoulos S. N., et al. 2018. “A Biophysical Model of Dynamic Balancing of Excitation and Inhibition in Fast Oscillatory Large‐Scale Networks.” PLoS Computational Biology 14, no. 2: e1006007. 10.1371/journal.pcbi.1006007. - DOI - PMC - PubMed
    1. Aminikhanghahi, S. , and Cook D. J.. 2017. “A Survey of Methods for Time Series Change Point Detection.” Knowledge and Information Systems 51, no. 2: 339–367. 10.1007/s10115-016-0987-z. - DOI - PMC - PubMed
    1. Avena‐Koenigsberger, A. , Misic B., and Sporns O.. 2018. “Communication Dynamics in Complex Brain Networks.” Nature Reviews Neuroscience 19, no. 1: 17–33. 10.1038/nrn.2017.149. - DOI - PubMed
    1. Avena‐Koenigsberger, A. , Yan X., Kolchinsky A., Van Den Heuvel M. P., Hagmann P., and Sporns O.. 2019. “A Spectrum of Routing Strategies for Brain Networks.” PLoS Computational Biology 15, no. 3: e1006833. 10.1371/journal.pcbi.1006833. - DOI - PMC - PubMed
    1. Barnett, L. , and Seth A. K.. 2014. “The MVGC Multivariate Granger Causality Toolbox: A New Approach to Granger‐Causal Inference.” Journal of Neuroscience Methods 223: 50–68. 10.1016/j.jneumeth.2013.10.018. - DOI - PubMed

LinkOut - more resources