. 2025 Jul 22;99(7):e0062625.
doi: 10.1128/jvi.00626-25. Epub 2025 May 30.

Assessing the fitness of Epstein-Barr virus following its reactivation

Affiliations

Assessing the fitness of Epstein-Barr virus following its reactivation

Yen-Fu Adam Chen et al. J Virol. .

Abstract

Epstein-Barr virus (EBV) is usually maintained latently on passaging in cell culture, as are most herpesviruses in vivo. Its fitness, or its ability to infect and replicate in naïve cells, cannot be ascertained by serially passaging it in host cells because no identified cell line initially supports a productive infection by it. Yet its fitness is critical to EBV's remarkable success as a human pathogen. We have, therefore, developed multiple approaches to assess EBV's fitness upon being reactivated from its familiar state of latency. We established and tested expression plasmids for 77 viral genes and a set of shRNAs targeting 25 viral genes to measure how increasing and decreasing their levels affected the fitness of the released stocks of virus. Four of their properties were then analyzed: (i) their concentrations of physical particles, (ii) their binding to the CD21 receptor on a B-cell line, (iii) their entry into human primary B cells, and (iv) their infectious titers. These analyses identified multiple EBV genes whose altered levels of expression altered the biological activities of the released virus. These measurements revealed, though, an unexpected insight into the robustness of EBV produced from latently infected cells. EBV is amazingly resilient to any increased expression of its genes. The levels expressed in cells, as they support an induced productive infection, therefore are close to optimal for the fitness of the released virus.IMPORTANCEPopulations of viruses accumulate mutations while being propagated. While most mutations are neutral or disadvantageous, some confer on the variant a selective advantage, increasing its infectivity. These variants can be identified by serial passaging virus stocks, allowing those with increased fitness to predominate. This approach does not work for Epstein-Barr virus (EBV), for which no identified cell line initially supports its productive infection. How mutations accumulate in EBV as it is propagated latently to affect its fitness was unknown. We have devised an approach to assess EBV's fitness upon being reactivated. Our findings suggest that EBV during its many latent generations has maintained a strikingly robust productive fitness.

Keywords: EBV; Epstein-Barr virus; fusion assay; herpesvirus; infection; mutagenesis; physical particles; viral fitness; virus titer.


Conflict of interest statement

The authors declare no conflict of interest.

Figures

Fig 1
Fig 1
Experimental strategy of analyzing the composition of engineered EBV stocks and their virus-cell interactions. EBV stocks from the EBV producer cell line 2089 were collected 3 days after transient co-transfection of a BZLF1 expression plasmid together with individual expression plasmids from a panel of 77 different EBV genes. Alternatively, the EBV producer cells were co-transfected with the two plasmids plus a CD63:β-lactamase (BlaM) reporter plasmid to equip virus particles with an enzyme to study viral fusion with target cells. Different individual virus stocks were analyzed for their physical particle concentration using the nanoparticle tracking analysis instrument, ZetaView PMX110. Elijah cells were used to assess bioparticle concentration in the virus stocks via cell surface binding and subsequent analysis of bound particles by flow cytometry. Virus particles engineered to contain the CD63:β-lactamase reporter protein were analyzed for their fusogenic activity with human primary B cells as targets by flow cytometry. Raji cells were infected with virus stocks to measure the concentration of infectious virus particles conferring green fluorescence protein gene in the cells analyzed by flow cytometry. Similarly engineered virus stocks were also obtained from HH514 cells, a Burkitt lymphoma cell line infected with EBV. These HH514 EBV stocks were tested for their fusogenic activity with Daudi cells employing the split nanoluciferase system. The diagram was created with the help of BioRender.com (https://biorender.com/).
Fig 2
Fig 2
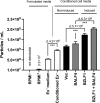
Concentration of physical particles in different formulated cell culture media and in conditioned cell culture media from non-induced and induced 2089 EBV producer cells. Concentrations of physical particles were determined with the aid of nanoparticle tracking analysis using the ZetaView PMX110 instrument. Formulated media are different cell culture medium preparations based on standard RPMI1640, which are as follows: RPMI, plain, non-supplemented commercial RPMI1640 medium (Gibco); RPMI+, commercial RPMI1640 medium supplemented with penicillin-streptomycin stock, sodium pyruvate, sodium selenite, and α-thioglycerol; Ex medium, RPMI+ with 10% fetal bovine serum and the supplements listed above after ultracentrifugation (100,000 g, 4°C for more than 16 h as described in Materials and Methods); Conditioned Ex, supernatant from non-induced 2089 EBV producer cell line cultured in Ex medium for 3 days; Vec, 2089 EBV producer cells transfected with pCMV control plasmid DNA (0.5 µg; p6816) using 3 µL PEI MAX cultivated in Ex medium for 3 days; BALF4, same as “Vec,” but the cells were transfected with 0.5 µg of the BALF4 expression plasmid p6515; BZLF1, same as “Vec,” but the cells were transfected with 0.5 µg of the BZLF1 expression plasmid p509 to induce EBV production; BZLF1 + BALF4, same as “Vec,” but the cells were co-transfected with 0.25 µg each of the expression plasmids p509 and p6515 coding for BZLF1 and BALF4, respectively. Mean and standard deviation of three replicates are shown. ***P ≤ 0.001.
Fig 3
Fig 3
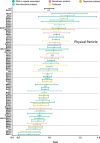
Comparison of physical particle concentrations in virus samples generated by co-transfection of BZLF1 and single expression plasmids from a panel of 77 EBV genes including two controls. EBV stocks were analyzed for their physical particle concentration by nanoparticle tracking analysis. NTA was performed with the ZetaView PMX110 instrument, and the images were analyzed with the ZetaView 8.04.02 software. Standard calibration beads were used to confirm the range of linearity. The y-axis lists the transfected individual EBV genes co-transfected with BZLF1. An empty pCMV vector plasmid plus the BZLF1 plasmid was co-transfected as reference (Ctrl). The positive control encompasses supernatants obtained after co-transfection of both BZLF1 and BALF4 expression plasmids. The number of physical particles in the range of 100–200 nm contained in the supernatants of cells was analyzed and normalized to the reference sample (Ctrl). The results are arranged in descending order and are classified according to five functional groups and color coded as indicated. Mean and standard deviation of three biological replicates are shown. The horizontal lines indicate groups of 10 viral genes for better visualization. The viral gene designated sLF3 represents a version of LF3 with a reduced number of internal repeats.
Fig 4
Fig 4
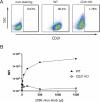
CD21 is essential for virus-cell adhesion. The two alleles of the surface receptor CD21 were deleted in Elijah cell chromatin using pre-formed CRISPR-Cas9 ribonucleoprotein complexes with two individual CD21-targeting guide RNAs and a recombinant Cas9 nuclease. The cells were further sorted for CD21-negative cells. (A) CD21 expression levels and knockout efficiency of Elijah cells were evaluated by flow cytometry using an APC-coupled CD21-specific antibody. Left panel, wild-type (WT) Elijah cells without antibody staining; middle, wild-type Elijah cells stained with the fluorochrome-coupled CD21 antibody; right, CD21 expression level in sorted CD21-negative Elijah cells after CRISPR-Cas9-mediated knockout (CD21 KO). (B) Binding activity of 2089 EBV stocks was analyzed with WT and CD21 KO Elijah cells. Furthermore, 2 × 10⁵ Elijah cells were incubated with 0, 5, 15, 50, 150, 500, and 1,500 µL virus stocks at 4°C for 3 h. The cell-surface-bound virus particles were detected with an Alxea647-coupled anti-gp350 antibody, and mean fluorescence intensities (MFI) were recorded by flow cytometry and plotted as a function of virus dose.
Fig 5
Fig 5
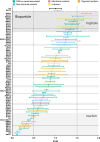
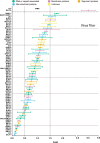
Comparison of bioparticle concentrations in virus samples generated in 2089 EBV producer cells by co-transfection of BZLF1 and individual expression plasmids from a panel of 77 EBV genes. Virus production and generation of samples were identical as described in the legend of Fig. 3. The amount of gp350-positive particles bound to Elijah cells was quantified using a gp350-specific, fluorochrome-coupled monoclonal antibody and flow cytometry. The ratios of mean fluorescence intensity values of individual samples vs the MFI value of the reference sample (Ctrl) were calculated and are provided on the x-axis. An empty pCMV vector plasmid co-transfected with the BZLF1 plasmid p509 served as reference (Ctrl). The y-axis lists the transfected individual EBV genes. Ratios are arranged in descending order. An expression plasmid encoding BALF4 served as a positive control. Shaded areas at the top and bottom highlight groups of viral genes termed “high bin” and “low bin,” respectively. Three singly highlighted genes (BPLF1, BBRF1, and BGLF4) were randomly picked as further candidates. EBV genes are classified according to five functional groups as indicated. Mean and standard deviation of three biological replicates are shown. The two vertical lines indicate 0.5- and 1.5-fold ratios, and horizontal lines indicate groups of 10 viral genes for better visualization. The viral gene designated sLF3 represents a version of LF3 with a reduced number of internal repeats.
Fig 6
Fig 6
Comparison of virus titer of stocks generated by co-transfecting 2089 EBV producer cells with BZLF1 together with single expression plasmids from a panel of 77 EBV genes. 2089 EBV producer cells were co-transfected with BZLF1 and single expression plasmids encoding the denoted viral genes. Virus-containing supernatants were harvested 3 days later and used to infect Raji cells. After 3 days, the infected Raji cells were investigated by flow cytometry analyzing the expression of green fluorescence protein. The y-axis lists the individual EBV genes transfected in combination with BZLF1. The BZLF1 (p509) expression plasmid co-transfected with p6816, an empty pCMV vector plasmid served as reference and control (Ctrl). The titers of infectious EBV stocks according to the percentage of GFP-positive Raji cells were normalized to the reference sample (Ctrl), which was set to 1. The results are listed in descending order. EBV genes are color coded according to five functional groups as indicated. Mean and standard deviation of three biological replicates are shown. Vertical lines indicate 0.5- and 1.5-fold ratios. The horizontal lines indicate groups of 10 viral genes for better visualization. The viral gene designated sLF3 represents a version of LF3 with a reduced number of internal repeats.
Fig 7
Fig 7
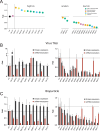
Viral titers and bioparticles in supernatants generated after co-transfection of BZLF1 and single viral genes into 2089 EBV producer cell lines stably transduced with sets of 3 shRNAs directed against 25 individual viral transcripts. (A) Recapitulation of selected data shown in Fig. 5. Three groups of viral genes are shown that were picked randomly (“random”), or increased (“high bin,” left panel) or decreased (“low bin,” right panel) the yield of bioparticles when co-transfected together with BZLF1 into the EBV producer cell line 2089. The EBV genes are arranged in descending order, and the color codes depict the different functions of viral proteins as in Fig. 5. (B) Parental 2089 EBV producer cells were stably transduced with sets of 3 shRNAs each targeting 25 viral transcripts. Controls encompass the EBV producer cell line 2089 stably transduced with the empty pCDH shRNA expression vector (Ctrl). The viral genes termed “high bin” and “low bin” groups are shown in the left and right panels, respectively. The individual cell lines were transiently transfected with the BZLF1 expression plasmid. The virus supernatants were harvested 3 days after transfection and used to infect Raji cells. After 3 days, the fraction of GFP-positive Raji cells was determined by flow cytometry, and virus titers (GFP-positive Raji cell unit titers) were calculated. Supernatants harvested from the control cell lines are shown on the left side of the graph with the “high bin” group of genes separated by a vertical dotted line from the test samples. The “low bin” group is shown on the right, separated from the control, and includes the three “random” genes separated by a dotted vertical line. Virus titers of supernatants obtained from the 25 individual shRNA-expressing EBV producer cell lines (red columns; shRNA knockdown) analyzed in panel B are compared with virus titers found in supernatants from the parental EBV producer cell line 2089 upon transient expression of viral genes (black columns; ectopic expression). Mean and standard deviation of three biological replicates are shown. (C) Virus stocks analyzed in panel B were tested for their bioparticle concentration in the Elijah cell binding assay. Bioparticle concentrations found in supernatants from parental 2089 EBV producer cells upon ectopic expression of single viral genes (as analyzed in Fig. 5; black columns; ectopic expression) are compared with results obtained from 2089 EBV producer cells stably transduced with sets of shRNAs (red columns; shRNA knockdown). Mean and standard deviation of three biological replicates are shown.
Fig 8
Fig 8
Analysis of engineered virus stocks using the BlaM fusion assay and primary human B cells as targets. (A) The flow chart depicts the experimental steps of the fusion assay (top pathway) and its comparison with the Raji cell-based test for infectivity (below, the results are shown in Fig. S7). (B) Results of the β-lactamase fusion assay with supernatants of the 2089 EBV producer cell line transiently transfected with 25 individual expression plasmids encoding viral genes of the “high bin,” “low bin” groups and three random genes. The cells were co-transfected with three plasmids as shown in panel A (plasmids encode BZLF1 [p509], CD63:BlaM [p7200], and 1 of the 25 selected EBV genes or controls). The resulting supernatants were tested on primary human B cells as targets. The readouts are based on the fraction of “blue” B cells with cleaved CCF4 substrate by flow cytometry and normalized to the control. Shown are the results from the “high bin” and “low bin” groups and three randomly picked viral genes separated by a vertical dotted line. The illustration was created using the BioRender.com source (https://biorender.com/).
Fig 9
Fig 9
Engineered HH514 EBV stocks tested for their fusogenicity with Daudi cells. HH514 virus stocks were obtained from HH514 cells transiently transfected with 25 selected expression plasmids encoding individual viral genes. The cells were co-transfected with 3 plasmids encoding BZLF1 (p509), CD63:HiBiT (p7544), and 1 of the 25 selected genes or an empty control plasmid (pCMV). The harvested virus supernatants were added to CD63:LgBiT Daudi cells as recipients. In the figure, EBV genes were aligned on the x-axis and categorized in different groups, accordingly. The horizontal dotted line marks the baseline of the control. Vertical dotted lines separate different groups. The assay was performed by luminescence measurement and normalized.
Fig 10
Fig 10
Spider charts visualizing the results of six parameters derived from the analysis of 17 selected viral genes. (A) Schematic view of the spider charts. Four of the six “legs” of the diagram represent the calculated ratios of readouts encompassing “physical particle,” “bioparticle,” virus “titer,” and “fusogenic activity” upon ectopic expression of selected viral genes. The remaining two legs show the consequences of shRNA-mediated knockdown of a given gene affecting virus “titer” and “bioparticle”. Concentric hexameric rings indicate ratios of 1 (no change of the parameter), 0 (complete functional loss), and 2 (twofold increase of the parameter). (B) The six ratios obtained with BALF4. Ectopic expression of BALF4 in 2089 EBV producer cells increases the virus titer and the fusogenic activity about seven- and fourfold, respectively. The shRNA-mediated knockdown of BALF4 leads to an almost complete loss of the parameter virus “titer,”’ indicating that BALF4 is indispensable for virus synthesis. (C) Three viral genes, which, when expressed ectopically, show reduced ratios of “bioparticles,” virus “titer,” and “fusogenic activity.” Their shRNA-mediated knockdown does not affect “bioparticles” and virus “titer” ratios. (D) The selected seven viral genes have little effect on four parameters when expressed ectopically, but their shRNA-mediated knockdown severely compromised the parameter ratios “bioparticle” and virus “titer.” (E) The parameter ratios of “bioparticle,” virus “titer,” and “fusogenic activity” of six viral genes are compromised upon their ectopic expression, and their shRNA-mediated knockdown profoundly affects the parameters “bioparticle” and virus “titer” as well. Fig. S9 provides additional spider charts of other viral genes analyzed.

Similar articles

References

    1. Domingo E, Menéndez-Arias L, Holland JJ. 1997. RNA virus fitness. Rev Med Virol 7:87–96. doi: 10.1002/(SICI)1099-1654(199707)7:2<87::AID-RMV188>3.0.CO;2-0 - DOI - PubMed
    1. Buschle A, Hammerschmidt W. 2020. Epigenetic lifestyle of Epstein-Barr virus. Semin Immunopathol 42:131–142. doi: 10.1007/s00281-020-00792-2 - DOI - PMC - PubMed
    1. Kuny CV, Bowen CD, Renner DW, Johnston CM, Szpara ML. 2020. In vitro evolution of herpes simplex virus 1 (HSV-1) reveals selection for syncytia and other minor variants in cell culture. Virus Evol 6:veaa013. doi: 10.1093/ve/veaa013 - DOI - PMC - PubMed
    1. Delecluse HJ, Hilsendegen T, Pich D, Zeidler R, Hammerschmidt W. 1998. Propagation and recovery of intact, infectious Epstein-Barr virus from prokaryotic to human cells. Proc Natl Acad Sci USA 95:8245–8250. doi: 10.1073/pnas.95.14.8245 - DOI - PMC - PubMed
    1. Feederle R, Kost M, Baumann M, Janz A, Drouet E, Hammerschmidt W, Delecluse HJ. 2000. The Epstein-Barr virus lytic program is controlled by the co-operative functions of two transactivators. EMBO J 19:3080–3089. doi: 10.1093/emboj/19.12.3080 - DOI - PMC - PubMed

LinkOut - more resources