Multicenter Study
. 2025 May;7(3):e240332.
doi: 10.1148/rycan.240332.

Interactive Explainable Deep Learning Model for Hepatocellular Carcinoma Diagnosis at Gadoxetic Acid-enhanced MRI: A Retrospective, Multicenter, Diagnostic Study

Affiliations
Multicenter Study

Interactive Explainable Deep Learning Model for Hepatocellular Carcinoma Diagnosis at Gadoxetic Acid-enhanced MRI: A Retrospective, Multicenter, Diagnostic Study

Mingkai Li et al. Radiol Imaging Cancer. 2025 May.

Abstract

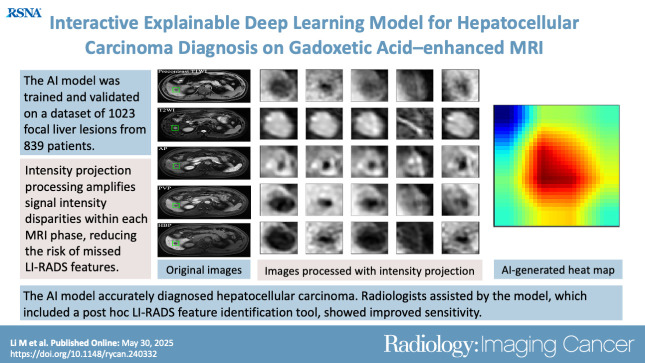
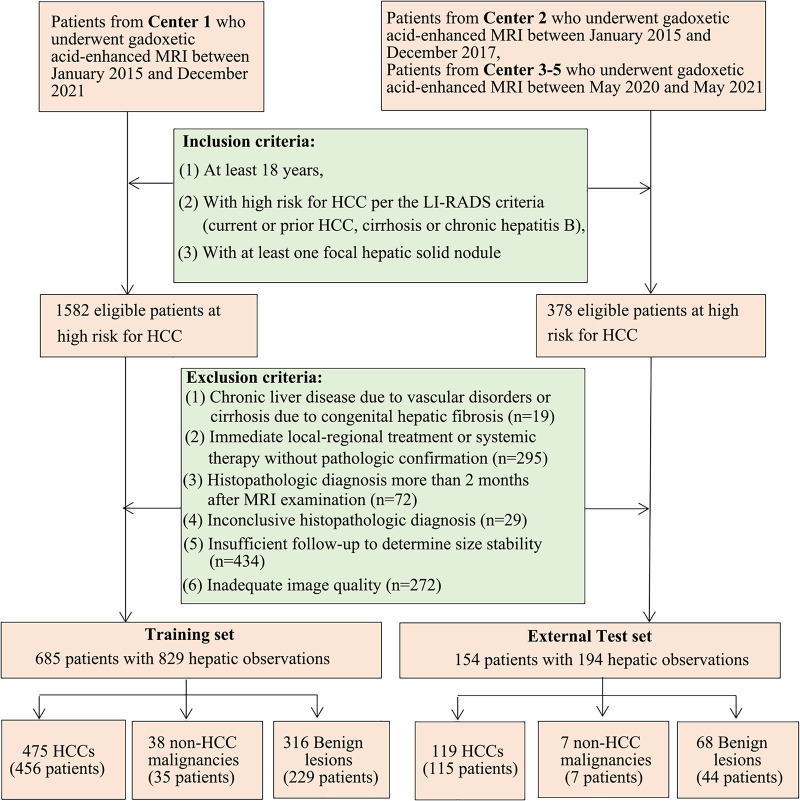
Purpose To develop an artificial intelligence (AI) model based on gadoxetic acid-enhanced MRI to assist radiologists in hepatocellular carcinoma (HCC) diagnosis. Materials and Methods This retrospective study included patients with focal liver lesions (FLLs) who underwent gadoxetic acid-enhanced MRI between January 2015 and December 2021. All hepatic malignancies were diagnosed pathologically, whereas benign lesions were confirmed with pathologic findings or imaging follow-up. Five manually labeled bounding boxes for each FLL obtained from precontrast T1-weighted, T2-weighted, arterial phase, portal venous phase, and hepatobiliary phase images were included. The lesion classifier component, used to distinguish HCC from non-HCC, was trained and externally tested. The feature classifier, based on a post hoc algorithm, inferred the presence of the Liver Imaging Reporting and Data System (LI-RADS) features by analyzing activation patterns of the pretrained lesion classifier. Two radiologists categorized FLLs in the external testing dataset according to LI-RADS criteria. Diagnostic performance of the AI model and the model's impact on reader accuracy were assessed. Results The study included 839 patients (mean age, 51 years ± 12 [SD]; 681 male) with 1023 FLLs (594 HCCs and 429 non-HCCs). The AI model yielded area under the receiver operating characteristic curves of 0.98 and 0.97 in the training set and external testing set, respectively. Compared with LI-RADS category 5, the AI model showed higher sensitivity (91.6% vs 74.8%; P < .001) and similar specificity (90.7% vs 96.0%; P = .22). The two readers identified more LI-RADS major features and more accurately classified category LR-5 lesions when assisted versus unassisted by AI, with higher sensitivities (reader 1, 85.7% vs 72.3%; P < .001; reader 2, 89.1% vs 74.0%; P < .001) and the same specificities (reader 1, 93.3% vs reader 2, 94.7%; P > .99 for both). Conclusion The AI model accurately diagnosed HCC and improved the radiologists' diagnostic performance. Keywords: Artificial Intelligence, Deep Learning, MRI, Hepatocellular Carcinoma Supplemental material is available for this article. © RSNA, 2025 See also commentary by Singh et al in this issue.

Keywords: Artificial Intelligence; Deep Learning; Hepatocellular Carcinoma; MRI.


Conflict of interest statement

Disclosures of conflicts of interest: M.L. No relevant relationships. Z.Z. No relevant relationships. Z.C. No relevant relationships. X.C. No relevant relationships. H.L. No relevant relationships. Y.X. No relevant relationships. H.C. No relevant relationships. X.Z. No relevant relationships. Jingbiao Chen No relevant relationships. Jianning Chen No relevant relationships. X.W. No relevant relationships. X.X. No relevant relationships. Z.Y. No relevant relationships. L.H. No relevant relationships. J.W. No relevant relationships. B.W. No relevant relationships.

Figures

None
Graphical abstract
Flowchart of patient inclusion and exclusion. Patients with
hepatocellular carcinoma (HCC) coexisting with non-HCCs, lesions with
histologic evidence, or hemangioma and focal nodular hyperplasia with
typical imaging features would also be included for artificial intelligence
model development and validation. The goal of the deep learning model was to
discriminate between HCCs and non-HCCs. LI-RADS = Liver Imaging Reporting
and Data System.
Figure 1:
Flowchart of patient inclusion and exclusion. Patients with hepatocellular carcinoma (HCC) coexisting with non-HCCs, lesions with histologic evidence, or hemangioma and focal nodular hyperplasia with typical imaging features would also be included for artificial intelligence model development and validation. The goal of the deep learning model was to discriminate between HCCs and non-HCCs. LI-RADS = Liver Imaging Reporting and Data System.
Development and evaluation of the deep learning framework. (A) Process
of images annotation. Manual labeling of the bounding box on the largest
layer of tumor appearance on the clearest sequence (usually hepatobiliary
phase), then input starting and ending layers to build a three-dimensional
bounding box. After replicating on the other four registered phases and
manual checking whether boxes were correctly aligned, five three-dimensional
bounding boxes for each lesion were generated. (B) Deep learning framework.
For each lesion, raw data within three-dimensional bounding boxes were
processed with a series of vertical intensity projection, including maximum
intensity projection, minimum intensity projection, average intensity
projection, and the subtraction between the maximum and minimum intensity
projections. Using Resnet 50 (Linux Foundation), the median layer and the
processed intensity projection data from each phase were included for the
hepatocellular carcinoma (HCC) diagnosis–oriented artificial
intelligence (AI) model development. To determine an optimal combination of
the five phases, AI models using different phases were compared with
consensus reading of an expert reader. Model A represents an AI model with
arterial phase and portal venous phase images. Model B represents an AI
model with arterial phase, portal venous phase, and hepatobiliary phase
images. Model C represents an AI model with precontrast T1-weighted imaging
(T1WI), T2-weighted imaging (T2WI), arterial phase, portal venous phase, and
hepatobiliary phase images. Diagnostic results by the Liver Imaging
Reporting and Data System (LI-RADS) category 5 were used to represent the
LI-RADS version 2018 performances. (C) Flowchart of the approach for lesion
and feature classifier development and validation.
Figure 2:
Development and evaluation of the deep learning framework. (A) Process of images annotation. Manual labeling of the bounding box on the largest layer of tumor appearance on the clearest sequence (usually hepatobiliary phase), then input starting and ending layers to build a three-dimensional bounding box. After replicating on the other four registered phases and manual checking whether boxes were correctly aligned, five three-dimensional bounding boxes for each lesion were generated. (B) Deep learning framework. For each lesion, raw data within three-dimensional bounding boxes were processed with a series of vertical intensity projection, including maximum intensity projection, minimum intensity projection, average intensity projection, and the subtraction between the maximum and minimum intensity projections. Using Resnet 50 (Linux Foundation), the median layer and the processed intensity projection data from each phase were included for the hepatocellular carcinoma (HCC) diagnosis–oriented artificial intelligence (AI) model development. To determine an optimal combination of the five phases, AI models using different phases were compared with consensus reading of an expert reader. Model A represents an AI model with arterial phase and portal venous phase images. Model B represents an AI model with arterial phase, portal venous phase, and hepatobiliary phase images. Model C represents an AI model with precontrast T1-weighted imaging (T1WI), T2-weighted imaging (T2WI), arterial phase, portal venous phase, and hepatobiliary phase images. Diagnostic results by the Liver Imaging Reporting and Data System (LI-RADS) category 5 were used to represent the LI-RADS version 2018 performances. (C) Flowchart of the approach for lesion and feature classifier development and validation.
Overview of the artificial intelligence (AI)–assisted workflow.
HCC = hepatocellular carcinoma, LI-RADS = Liver Imaging Reporting and Data
System.
Figure 3:
Overview of the artificial intelligence (AI)–assisted workflow. HCC = hepatocellular carcinoma, LI-RADS = Liver Imaging Reporting and Data System.
Graph of diagnostic performance of the artificial intelligence (AI)
model with different imaging phases and radiologists for hepatocellular
carcinoma diagnosis. Model A represents the AI model with arterial phase and
portal venous phase images. Model B represents the AI model with arterial
phase, portal venous phase, and hepatobiliary phase images. Model C
represents the AI model with precontrast T1-weighted, T2-weighted, arterial
phase, portal venous phase, and hepatobiliary phase images. AUC = area under
the receiver operating characteristic curve, LR-5 = Liver Imaging Reporting
and Data System category 5. Dotted line indicates performance of a
classifier, serving as a reference line with an AUC of 0.50.
Figure 4:
Graph of diagnostic performance of the artificial intelligence (AI) model with different imaging phases and radiologists for hepatocellular carcinoma diagnosis. Model A represents the AI model with arterial phase and portal venous phase images. Model B represents the AI model with arterial phase, portal venous phase, and hepatobiliary phase images. Model C represents the AI model with precontrast T1-weighted, T2-weighted, arterial phase, portal venous phase, and hepatobiliary phase images. AUC = area under the receiver operating characteristic curve, LR-5 = Liver Imaging Reporting and Data System category 5. Dotted line indicates performance of a classifier, serving as a reference line with an AUC of 0.50.
Graphs of diagnostic performance of artificial intelligence (AI) model
in different Liver Imaging Reporting and Data System (LI-RADS) version 2018
categories. (A) Association between AI model predictive probability of
hepatocellular carcinoma (HCC) and LI-RADS version 2018 categories. (B)
Diagnostic performance of AI model in LR-1/2, LR-3, LR-4, and LR-5. (C)
Diagnostic performance of AI model in LR-M (other malignancy). FLL = focal
liver lesion.
Figure 5:
Graphs of diagnostic performance of artificial intelligence (AI) model in different Liver Imaging Reporting and Data System (LI-RADS) version 2018 categories. (A) Association between AI model predictive probability of hepatocellular carcinoma (HCC) and LI-RADS version 2018 categories. (B) Diagnostic performance of AI model in LR-1/2, LR-3, LR-4, and LR-5. (C) Diagnostic performance of AI model in LR-M (other malignancy). FLL = focal liver lesion.
Example of the AI model predicting a Liver Imaging Reporting and Data
System (LI-RADS) other malignancy category (LR-M) focal liver lesion (FLL).
(A–F) Axial gadoxetic acid–enhanced MRI scans show a 16-mm FLL
in a 39-year-old male patient. (A) The FLL was seen as hypointensity on
precontrast T1-weighted image (T1WI). (B) Mild to moderate T2 hyperintensity
was noted. There was (C) rim arterial phase hyperenhancement (APHE), (D)
nonperipheral washout at portal venous phase (PVP), and (D–E)
enhancing capsule at PVP and transitional phase (TP). Ancillary features
such as (E) TP hypointensity (arrow) and (F) hepatobiliary phase (HBP)
hypointensity were noted. Since rim APHE could not be confirmed by reader 1,
this FLL was categorized into LR-M with use of the original LI-RADS version
2018. After accessing five three-dimensional (3D) bounding boxes for each
lesion, the AI model applied a series of intensity projections (IP),
including maximum IP (MAIP), minimum IP (MIIP), and average IP (AVIP), to
each 3D bounding box obtained from precontrast T1-weighted imaging,
T2-weighted imaging (T2WI), AP, PVP, and HBP. Additionally, the median layer
of the phase and the difference between the MAIP and MIIP were calculated as
feature values. As a result, it was recategorized as hepatocellular
carcinoma (HCC) by the lesion classifier with a probability of 0.9992. The
heatmap of the deep learning model analyzing the hepatic nodule indicates
the contribution of the corresponding area to the model prediction (1.00
indicates the region with the most important contribution, while 0 indicates
no contribution). In this case, the feature classifier identified nonrim
APHE with a probability of 0.978, and heterogeneous enhancement (arrows) was
noted after reviewing the (G) coronal precontrast T1-weighted images and (H)
coronal AP images. The presumptive diagnoses were changed to definite HCC.
After surgical resection, it was confirmed as HCC.
Figure 6:
Example of the AI model predicting a Liver Imaging Reporting and Data System (LI-RADS) other malignancy category (LR-M) focal liver lesion (FLL). (A–F) Axial gadoxetic acid–enhanced MRI scans show a 16-mm FLL in a 39-year-old male patient. (A) The FLL was seen as hypointensity on precontrast T1-weighted image (T1WI). (B) Mild to moderate T2 hyperintensity was noted. There was (C) rim arterial phase hyperenhancement (APHE), (D) nonperipheral washout at portal venous phase (PVP), and (D–E) enhancing capsule at PVP and transitional phase (TP). Ancillary features such as (E) TP hypointensity (arrow) and (F) hepatobiliary phase (HBP) hypointensity were noted. Since rim APHE could not be confirmed by reader 1, this FLL was categorized into LR-M with use of the original LI-RADS version 2018. After accessing five three-dimensional (3D) bounding boxes for each lesion, the AI model applied a series of intensity projections (IP), including maximum IP (MAIP), minimum IP (MIIP), and average IP (AVIP), to each 3D bounding box obtained from precontrast T1-weighted imaging, T2-weighted imaging (T2WI), AP, PVP, and HBP. Additionally, the median layer of the phase and the difference between the MAIP and MIIP were calculated as feature values. As a result, it was recategorized as hepatocellular carcinoma (HCC) by the lesion classifier with a probability of 0.9992. The heatmap of the deep learning model analyzing the hepatic nodule indicates the contribution of the corresponding area to the model prediction (1.00 indicates the region with the most important contribution, while 0 indicates no contribution). In this case, the feature classifier identified nonrim APHE with a probability of 0.978, and heterogeneous enhancement (arrows) was noted after reviewing the (G) coronal precontrast T1-weighted images and (H) coronal AP images. The presumptive diagnoses were changed to definite HCC. After surgical resection, it was confirmed as HCC.

Similar articles

Cited by

References

    1. Sung H , Ferlay J , Siegel RL , et al. . Global Cancer Statistics 2020: GLOBOCAN Estimates of Incidence and Mortality Worldwide for 36 Cancers in 185 Countries . CA Cancer J Clin 2021. ; 71 ( 3 ): 209 – 249 . - PubMed
    1. Vogel A , Meyer T , Sapisochin G , Salem R , Saborowski A . Hepatocellular carcinoma . Lancet 2022. ; 400 ( 10360 ): 1345 – 1362 . - PubMed
    1. Kim SH , Kim SH , Lee J , et al. . Gadoxetic acid-enhanced MRI versus triple-phase MDCT for the preoperative detection of hepatocellular carcinoma . AJR Am J Roentgenol 2009. ; 192 ( 6 ): 1675 – 1681 . - PubMed
    1. Sano K , Ichikawa T , Motosugi U , et al. . Imaging study of early hepatocellular carcinoma: usefulness of gadoxetic acid-enhanced MR imaging . Radiology 2011. ; 261 ( 3 ): 834 – 844 . - PubMed
    1. Chernyak V , Fowler KJ , Kamaya A , et al. . Liver Imaging Reporting and Data System (LI-RADS) Version 2018: imaging of Hepatocellular Carcinoma in At-Risk Patients . Radiology 2018. ; 289 ( 3 ): 816 – 830 . - PMC - PubMed

Publication types

LinkOut - more resources