. 2025 Jul-Aug;75(4):308-340.
doi: 10.3322/caac.70011. Epub 2025 May 30.

Cancer treatment and survivorship statistics, 2025

Affiliations

Cancer treatment and survivorship statistics, 2025

Nikita Sandeep Wagle et al. CA Cancer J Clin. 2025 Jul-Aug.

Erratum in

Abstract

The number of people living with a history of cancer in the United States continues to rise because of the growth and aging of the population as well as improved survival through advances in early detection and treatment. To assist the public health community serve the needs of these survivors, the American Cancer Society and the National Cancer Institute collaborate triennially to estimate cancer prevalence in the United States using data from the Surveillance, Epidemiology, and End Results cancer registries, the Centers for Disease Control and Prevention's National Center for Health Statistics, and the United States Census Bureau. In addition, cancer treatment patterns are presented from the National Cancer Database along with a brief overview of treatment-related side effects. As of January 1, 2025, about 18.6 million people were living in the United States with a history of cancer, and this number is projected to exceed 22 million by 2035. The three most prevalent cancers are prostate (3,552,460), melanoma of the skin (816,580), and colorectum (729,550) among males and breast (4,305,570), uterine corpus (945,540), and thyroid (859,890) among females. About one half (51%) of survivors were diagnosed within the past 10 years, and nearly four fifths (79%) were aged 60 years and older. Racial differences in treatment in 2021 were common across disease stage; for example, Black people with stage I-II lung cancer were less likely to undergo surgery than their White counterparts (47% vs. 52%). Larger disparities exist for rectal cancer, for which 39% of Black people with stage I disease undergo proctectomy or proctocolectomy compared to 64% of their White counterparts. Targeted, multi-level efforts to expand access to high-quality care and survivorship resources are vital to reducing disparities and advancing support for all survivors of cancer.

Keywords: prevalence; statistics; survivorship; treatment patterns.


Conflict of interest statement

The authors gratefully acknowledge all cancer registries and their staff for their hard work and diligence in collecting cancer information, without which this research could not have been accomplished.

K. Robin Yabroff reports support for professional activities from Flatiron Health outside the submitted work. Patricia A. Ganz reports personal/consulting fees from Blue Note Therapeutics, Grail, Informed DNA, and Roche; and service on a Data and Safety Monitoring Board for Astellas Pharma and Duke University outside the submitted work. Nikita Sandeep Wagle, Leticia Nogueira, K. Robin Yabroff, Farhad Islami, Ahmedin Jemal, Rick Alteri, and Rebecca L. Siegel are employed by the American Cancer Society, which receives grants from private and corporate foundations, including foundations associated with companies in the health sector, for research outside of the submitted work. The authors are not funded by or key personnel for any of these grants, and their salary is solely funded through American Cancer Society funds. Other authors report no conflicts of interest.

Figures

FIGURE 1
FIGURE 1
Estimated numbers of survivors of cancer in the United States by state as of January 1, 2025. State estimates do not sum to the US total because of rounding.
FIGURE 2
FIGURE 2
Estimated number of survivors of cancer in the United States by site. Estimates do not include in situ carcinoma of any site except the urinary bladder and do not include basal cell or squamous cell skin cancers.
FIGURE 3
FIGURE 3
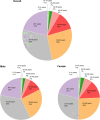
Distribution (%) of survivors of cancer in the United States as of January 1, 2025 by age at prevalence and sex. Percentages do not sum to 100% because of rounding.
FIGURE 4
FIGURE 4
Distribution (%) of survivors of selected cancers in the United States as of January 1, 2025 by age at prevalence and years since diagnosis. Percentages may not sum to totals because of rounding. Estimates do not include in situ carcinoma of any site except the urinary bladder and do not include basal cell or squamous cell skin cancers.
FIGURE 5
FIGURE 5
Treatment patterns (%) among women with breast cancer by stage, 2021. Percentages may not sum to totals because of rounding. Categories for White and Black race exclude persons of Hispanic ethnicity. aA small number of these patients receive chemotherapy. bA small number of these patients receive RT. +/− indicates with or without; BCS, breast‐conserving surgery; chemo, chemotherapy (includes targeted therapy and immunotherapy); RT, radiation therapy.
FIGURE 6
FIGURE 6
Endocrine therapy receipt (%) among women with hormone receptor‐positive breast cancer by stage, 2021. Categories for White and Black race exclude persons of Hispanic ethnicity.
FIGURE 7
FIGURE 7
Five‐year relative survival rates (%) for selected cancers by race and stage at diagnosis, 2013–2017. Categories for White and Black race exclude persons of Hispanic ethnicity. aExcludes appendix.
FIGURE 8
FIGURE 8
Colon cancer treatment patterns (%) by stage, 2021. Percentages may not sum to totals because of rounding. Colon cancer excludes appendiceal cancer. Categories for White and Black race exclude persons of Hispanic ethnicity. aA small number of these patients also receive RT. + indicates with; Chemo, chemotherapy (includes targeted therapy and immunotherapy); RT, radiation therapy.
FIGURE 9
FIGURE 9
Rectal cancer treatment patterns (%) by stage, 2021. Percentages may not sum to totals because of rounding. Categories for White and Black race exclude persons of Hispanic ethnicity. + indicates with; Chemo, chemotherapy (includes targeted therapy and immunotherapy); RT, radiation therapy.
FIGURE 10
FIGURE 10
Disparities in observed colorectal cancer survival by health insurance coverage and stage, ages 45–64 years. Patients were diagnosed from 2017 to 2021 and all followed through 2021.
FIGURE 11
FIGURE 11
Kidney cancer treatment patterns (%) by stage, 2021. Percentages may not sum to totals because of rounding. Categories for White and Black race exclude persons of Hispanic ethnicity. Surgery of an unspecified type was not included in these treatment patterns. + indicates with; RT, radiation therapy.
FIGURE 12
FIGURE 12
Diffuse large B‐cell lymphoma treatment patterns (%), 2017–2021. Percentages may not sum to totals because of rounding. Categories for White and Black race exclude persons of Hispanic ethnicity. +/− indicates with or without; chemo, chemotherapy (includes targeted therapy); RT, radiation therapy.
FIGURE 13
FIGURE 13
Nonsmall cell lung cancer treatment patterns (%) by stage, 2021. Percentages may not sum to totals because of rounding. Categories for White and Black race exclude persons of Hispanic ethnicity. + indicates with; Chemo, chemotherapy (includes targeted therapy but does not include immunotherapy, which is shown in the inset); RT, radiation therapy.
FIGURE 14
FIGURE 14
Treatment patterns (%) for testicular germ cell tumors by stage, 2017–2021. Percentages may not sum to totals because of rounding. Treatment patterns by race are not presented due to sparse data. The tumors did not include mixed cell types. Surgery includes orchiectomy and other local excision and tumor‐destruction procedures but does not include RPNLD. + indicates with; Chemo, chemotherapy (includes targeted therapy and immunotherapy); RPNLD, retroperitoneal lymph node dissection; RT, radiation therapy.
FIGURE 15
FIGURE 15
Urinary bladder cancer treatment patterns (%) by stage, 2021. Percentages may not sum to totals because of rounding. Categories for White and Black race exclude persons of Hispanic ethnicity. aThese patients may have received a surgical diagnostic procedure to determine staging. + indicates with; Chemo, chemotherapy (includes targeted therapy but does not include immunotherapy, which is shown in the top right inset); RT, radiation therapy; TURBT, transurethral resection of the bladder tumor.
FIGURE 16
FIGURE 16
Endometrial cancer treatment patterns (%) by stage, 2021. Percentages may not sum to totals because of rounding. Categories for White and Black race exclude persons of Hispanic ethnicity. aSome of these patients may have received hormonal therapy. + indicates with; Chemo, chemotherapy (includes targeted therapy and immunotherapy); RT, radiation therapy.

References

    1. Tonorezos E, Devasia T, Mariotto AB, et al. Prevalence of cancer survivors in the United States. J Natl Cancer Inst. 2024;116(11):1784‐1790. doi: 10.1093/jnci/djae135 - DOI - PMC - PubMed
    1. Weaver KE, Forsythe LP, Reeve BB, et al. Mental and physical health‐related quality of life among U.S. cancer survivors: population estimates from the 2010 National Health Interview Survey. Cancer Epidemiol Biomarkers Prev. 2012;21(11):2108‐2117. doi: 10.1158/1055-9965.EPI-12-0740 - DOI - PMC - PubMed
    1. Han X, Robinson LA, Jensen RE, Smith TG, Yabroff KR. Factors associated with health‐related quality of life among cancer survivors in the United States. JNCI Cancer Spectr. 2021;5(1):pkaa123. doi: 10.1093/jncics/pkaa123 - DOI - PMC - PubMed
    1. Berry LL, Davis SW, Godfrey Flynn A, Landercasper J, Deming KA. Is it time to reconsider the term “cancer survivor?” J Psychosoc Oncol. 2019;37(4):1‐14. doi: 10.1080/07347332.2018.1522411 - DOI - PubMed
    1. Verdecchia A, De Angelis G, Capocaccia R. Estimation and projections of cancer prevalence from cancer registry data. Stat Med. 2002;21(22):3511‐3526. doi: 10.1002/sim.1304 - DOI - PubMed