. 2025 Jun 15;39(11):e70663.
doi: 10.1096/fj.202401558RR.

A Novel Function of NaV Channel β3 Subunit in Endothelial Cell Alignment Through Autophagy Modulation

Affiliations

A Novel Function of NaV Channel β3 Subunit in Endothelial Cell Alignment Through Autophagy Modulation

Léa Réthoré et al. FASEB J. .

Abstract

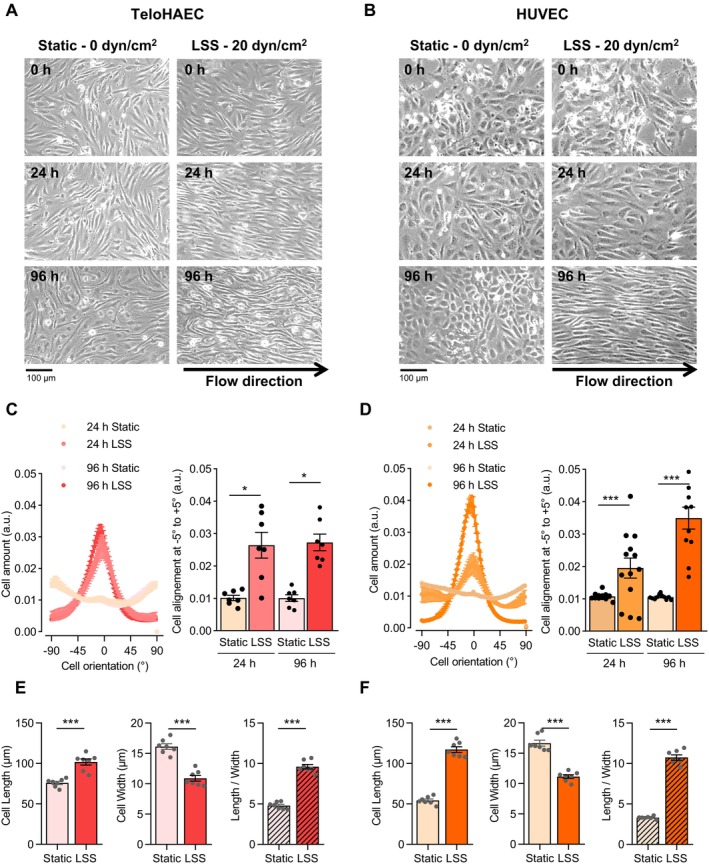
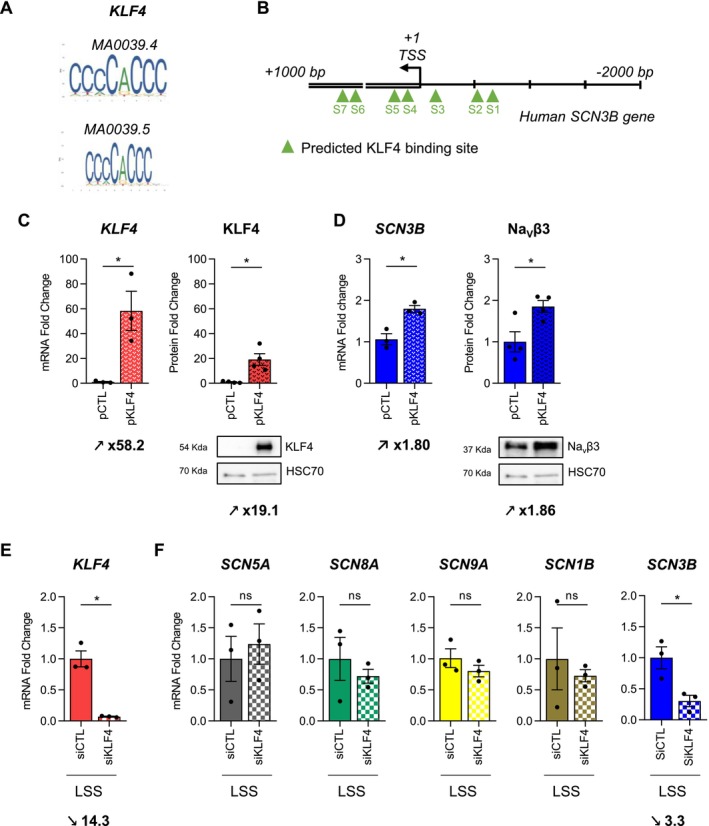
Endothelial cells (EC) play a pivotal role in vascular homeostasis. By sensing shear stress generated by blood flow, EC endorse vasculoprotection through mechanotransduction signaling pathways. Various ion channels are involved in mechanosignaling, and here, we investigated the endothelial voltage-gated Na+ channels (NaV channels), since their mechanosensitivity has been previously demonstrated in cardiomyocytes. First, we showed that EC from aorta (TeloHAEC) behave as EC from umbilical vein (HUVEC) under laminar shear stress (LSS). For both EC models, cell alignment and elongation occurred with the activation of the KLF2/KLF4 atheroprotective signaling pathways. We found that LSS decreased the expression of SCN5A, encoding NaV1.5, while LSS increased that of SCN3B, encoding NaVβ3. We demonstrated that the KLF4 transcription factor is involved in SCN3B expression under both static and LSS conditions. Interestingly, SCN3B silencing impaired EC alignment induced by LSS. The characterization of NaVβ3 interactome by coimmunoprecipitation and proteomic analysis revealed that mTOR, implicated in autophagy, binds to NaVβ3. This result was evidenced by the colocalization between NaVβ3 and mTOR inside cells. Moreover, we showed that SCN3B silencing led to the decrease in LC3B expression and the number of LC3B positive autophagosomes. Furthermore, we showed that NaVβ3 is retained within the cell and colocalized with LAMP1 and LC3B. Finally, we found that resveratrol, a stimulating-autophagy and vasculoprotective molecule, induced KLF4 together with NaVβ3 expression. Altogether, our findings highlight a novel role of NaVβ3 in endothelial function and cell alignment as an actor in shear stress vasculoprotective intracellular pathway through autophagy modulation.

Keywords: SCN3B; NaVβ3; autophagy; endothelial cell; mechanosignaling; shear stress.


Conflict of interest statement

The authors declare no conflicts of interest.

Figures

FIGURE 1
FIGURE 1
Phenotypic changes induced by LSS in TeloHAEC and HUVEC. Representative phase contrast microscopy images of TeloHAEC (A) and HUVEC (B) cultivated under static condition (Static, 0 dyn/cm2) or LSS (20 dyn/cm2) at different times (0, 24, and 96 h). TeloHAEC (C) and HUVEC (D) alignment quantification using local gradient orientation method with Fiji software at 24 and 96 h of LSS or under static condition. Cell amount is expressed over cell orientation in degree. A peak at angle value of 0° corresponds to a cell alignment with the flow direction. The histogram illustrates cell amount between angle values of −5° and +5°. Phenotypic modifications of TeloHAEC (E) and HUVEC (F) were assessed with the cell length (left panel) and width (middle panel), giving the elongation factor (Length/Width, right panel) after 96 h of LSS or of static culture. Values are mean ± SEM are shown (n = 7–13). Significance was analyzed using nonparametric Kruskal–Wallis (C, D) or Mann–Whitney (E, F) tests. *p < 0.05, ***p < 0.001.
FIGURE 2
FIGURE 2
Activation of the atheroprotective signaling pathway in TeloHAEC and HUVEC by LSS. The transcriptional and protein modification of KLF2/KLF2, KLF4/KLF4, and NOS3/eNOS expression induced by LSS (20 dyn/cm2, 96 h) was measured in TeloHAEC and HUVEC, by RT‐qPCR and western blotting, followed by densitometry analysis (A–C). The histogram bars illustrate the fold change values (mRNA and protein) as mean ± SEM (n = 3–8), compared to static condition, given the arbitrary value of 1 for RT‐qPCR data or normalized to HSC70 (loading control protein) and compared to static condition, given the arbitrary value of 1 for western blotting. Nonparametric Mann–Whitney tests were performed. ns, nonsignificant, *p < 0.05, **p < 0.01, ***p < 0.001.
FIGURE 3
FIGURE 3
LSS modulates NaV expression profiles in both TeloHAEC and HUVEC after 96 h of flow. mRNA expression profile of NaV channel subunits (SCN1A to SCN11A and SCN1B to SCN4B) in TeloHAEC and HUVEC (A, B). The mRNA relative expression of NaV channel subunits was determined by relative RT‐qPCR. The data are mean of mRNA relative expression ± SEM (n = 3) with the 2−ΔCq method. ND, not detected (Cq > 35). The protein expression of NaV channel subunits detected at transcript level was evaluated by western blot in comparison to control tissues as mouse heart (for NaV1.5 and NaVβ3), brain (for NaV1.6 and NaVβ1) or Dorsal Root Ganglion neurons (DRG) (for NaV1.7) (C, D). Fifty μg of cell protein extracts (TeloHAEC and HUVEC) and twenty μg of protein from control tissue (heart, brain and DRG) were loaded on 8% SDS‐PAGE. HSC70 protein was used as a loading control (C, D). In TeloHAEC or HUVEC, NaV1.5 and NaVβ3 share the same HSC70 loading control as well as NaV1.6 and NaVβ1 since the protein samples immunoblotted with these antibodies (NaV1.5/NaVβ3 and NaV1.6/NaVβ1) are the same after cutting the nitrocellulose membrane. SCN5A (E), SCN8A (F) and SCN9A (G), SCN1B (H), SCN3B (I) mRNA expression and NaVβ3 protein expression (J) in LSS (20 dyn/cm2 for 96 h) compared to static condition in TeloHAEC (left panel) and HUVEC (right panel). Values of fold change (mRNA and protein) are expressed as mean ± SEM for at least 3 until 6 independent experiments and compared to static condition, given the arbitrary value of 1 using the 2−ΔΔCq method for RT‐qPCR experiments or normalized to HSC70 used as loading control protein and compared to static condition, given the arbitrary value of 1 for the densitometry analysis. Immunoblot representative images of NaVβ3 and HSC70 protein expression in TeloHAEC and HUVEC (J) cultivated under static or LSS (20 dyn/cm2) condition for 96 h. Nonparametric Mann–Whitney tests were performed. ns, nonsignificant, *p < 0.05, **p < 0.01.
FIGURE 4
FIGURE 4
KLF4 is involved in SCN3B mRNA and protein expression in TeloHAEC. (A) Graphical representation of the KLF4 based on the position frequency matrix (PFM). The height of the column at each position is the information content (bit) and the individual base heights are in proportion to their frequencies. (B) Schematic representation of the location of the seven putative KLF4 (green triangles) DNA binding sites in human SCN3B promoter, with a score greater than 10.00, given by JASPAR analysis, named S1 to S7. (C, D) The effects of KLF4 overexpression using pKLF4 in comparison with empty vector (pCTL) were evaluated on KLF4 mRNA and protein (C) and SCN3B mRNA and NaVβ3 protein (D) expression in TeloHAEC. (E, F) The effects of LSS (24 h at 20 dyn/cm2) on KLF4 (E) and SCN5A, SCN8A, SCN9A, SCN1B, and SCN3B (F) expression were evaluated in TeloHAEC transfected with SiRNA Control (SiCTL) or SiRNA targeting KLF4 (SiKLF4). The histogram bars illustrate the fold change values (mRNA and protein) as mean ± SEM (n = 3–4), compared with pCTL or SiCTL, given the arbitrary value of 1 for RT‐qPCR data using the 2−ΔΔCq method or normalized to HSC70 (loading control protein) and compared to pCTL, given the arbitrary value of 1 for western blotting. Values of mRNA fold change are expressed as mean ± SEM (n = 3) and compared to SiCTL condition, given the arbitrary value of 1. Significance was analyzed using nonparametric Mann–Whitney tests. ns, nonsignificant, *p < 0.05.
FIGURE 5
FIGURE 5
SiRNA SCN3B decreased cell alignment and increased cell width after 24 h of LSS in TeloHAEC. (A) mRNA expression of SCN3B in TeloHAEC transfected with SiRNA Control (siRNA CTL) or SiRNA targeting SCN3B (SiRNA SCN3B) by ddPCR. Values of SCN3B mRNA fold change are expressed as mean of copy number of SCN3B per μL. (B) The histogram illustrates TeloHAEC amount between angle values of −5° and +5°, after transfection with SiRNA Control (siRNA CTL) or SiRNA targeting SCN3B (siRNA SCN3B). (C) Elongation of HUVEC was determined as the cell length along flow direction (left panel) divided by cell width (right panel). TeloHAEC were submitted to static or LSS (20 dyn/cm2) for 24 h. Values are mean ± SEM are shown (n = 5). Significance was analyzed using one‐way ANOVA statistical analysis, followed by Tukey multiple comparisons test or nonparametric Mann–Whitney tests. ns, nonsignificant, *p < 0.05, ***p < 0.001, ****p < 0.0001.
FIGURE 6
FIGURE 6
Identification of NaVβ3‐interacting partners in TeloHAEC and HUVEC by proteomic analysis. (A, B) Schematic representation of the NaVβ3 immunoprecipitation (IP) procedures. TeloHAEC (A) and COS‐7 (B) were transfected with pMyc‐SCN3B, and pCTL (negative control). (A) Myc tag‐NaVβ3 with its partners were coimmunoprecipitated using anti‐Myc tag magnetic beads from TeloHAEC protein extracts. (B) Myc tag‐NaVβ3 from COS‐7 protein extracts were first immunocaptured with anti‐Myc tag magnetic beads and subjected to pull‐down using HUVEC whole cell protein lysate. Below the schemes are shown representative control immunoblots (n = 3) with anti‐NaVβ3 (top blot) and anti‐myc tag (bottom blot). Input (Inp) was the whole protein extract after cell transfection and the flow throw (FT) corresponded to the supernatant recuperated after immunocapturing with the anti‐Myc tag magnetic beads. Wash and IP correspond to the washing step and a sample from the solution used to boil the beads (IP) to elute NaVβ3 and its partners. IP from TeloHAEC and HUVEC were subjected to MS/MS analysis. (C) Venn Diagram indicating the number of NaVβ3 interacting proteins identified in TeloHAEC and HUVEC after proteomic analysis. (D) Bubble plots of Gene ontology (GO)‐term enrichment analysis of the 76 putative NaVβ3 interactants. The four first GO‐terms belonging to the biological process and cellular component categories are indicated on the left. Below the bubble chart, is shown the protein ratio (number of proteins in our dataset compared to number of proteins in annotation). The scale of the bubble plot size (black, upper right) reflects the number of proteins. The significancy of the identification score is illustrated by a color intensity scale (Log10 Bonferroni, lower right). (E, F) Representative NaVβ3 and mTOR immunoblots (n = 3) of immunoprecipitated NaVβ3 with Myc tag antibody in TeloHAEC (E) and HUVEC (F).
FIGURE 7
FIGURE 7
NaVβ3 modulates LC3B expression in TeloHAEC. (A) Protein expression of P‐mTOR at serine 2448 (mTORC1 complex) or at serine 2481 (mTORC2 complex) and mTOR in static or LSS (20 dyn/cm2–24 h) conditions in TeloHAEC transfected with SiRNA Control (siCTL) or SiRNA targeting SCN3B (siSCN3B). The expression of proteins was evaluated by western blot where ten μg of cell protein extracts were loaded on 4%–20% SDS‐PAGE and where GAPDH protein was used as a loading control. (B) mRNA expression of LC3B in the same conditions. (C) LC3B protein expression in static or LSS (20 dyn/cm2–24 h) conditions in TeloHAEC transfected with SiRNA Control (siCTL) or SiRNA targeting SCN3B (siSCN3B). (D) Densitometry analysis following western blot of the LC3B‐I and LC3B‐II bands in static and LSS with or without siSCN3B in TeloHAEC. Values of fold change (mRNA and protein) are expressed as mean ± SEM for at least 4 or 5 independent experiments and compared to static condition, given the arbitrary value of 1 using the 2−ΔΔCq method for RT‐qPCR experiments or normalized to GAPDH for western blot experiments. One‐way ANOVA was performed. ns, nonsignificant, *p < 0.05, **p < 0.01, ***p < 0.001. (E) Representative immunofluorescence images of LC3B staining (red) in TeloHAEC transfected with siCTL or siSCN3B and cultivated under LSS (20 dyn/cm2 for 24 h). Nuclei (blue) were stained with DAPI. (F) Histograms represent the number of puncta (left) and fluorescence intensity (right) of LC3B staining. Data are presented as mean ± SEM (n = 3) and normalized to SiCTL, given the arbitrary value of 1. Significance was analyzed using one sample t‐test and Wilcoxon test, *p < 0.05.
FIGURE 8
FIGURE 8
NaVβ3 partially colocalizes with LC3B, LAMP1, and mTOR in TeloHAEC under static or LSS conditions. (A) Representative images illustrating the immunostaining of LC3B, LAMP1 or mTOR (red) together with NaVβ3 (green) in TeloHAEC which were transfected with pmyc‐SCN3B and cultivated under static condition. Nuclei (blue) were stained with DAPI. (B) Quantification of the colocalization of NaVβ3 with LC3B, LAMP1 or mTOR was calculated using Pearson's correlation coefficient (PCC). Histogram bars represent the PCC value as mean ± SEM for each protein (LC3B, LAMP1 or mTOR) in TeloHAEC cultivated under static or LSS conditions for three independent experiments. Significance was analyzed using one‐way ANOVA statistical analysis, followed by Tukey multiple comparisons test. **p < 0.01, ***p < 0.001.
FIGURE 9
FIGURE 9
Resveratrol induces KLF4, LC3B, and SCN3B mRNA expression in both TeloHAEC and HUVEC and in KLF4, LC3B, and NaVβ3 protein in TeloHAEC. (A‐C) The effects of RSV were evaluated on the expression of KLF4 (A), LC3B (B), and SCN3B (C) mRNA in TeloHAEC and HUVEC. (D) The effect of resveratrol was assessed on KLF4, LC3B and NaVβ3 protein expression in TeloHAEC. (A–D) The cells were treated with 100 μM of RSV and 0.1% DMSO (CTL) as negative control. The histogram bars illustrate the fold change values (mRNA and protein) as mean ± SEM (n = 3–4), compared to CTL, given the arbitrary value of 1 for RT‐qPCR data using the 2−ΔΔCq method or normalized to GAPDH (loading control protein) and compared to CTL, given the arbitrary value of 1 for western blotting. Nonparametric unpaired Mann–Whitney tests were performed, *p < 0.05.

References

    1. Deanfield J. E., Halcox J. P., and Rabelink T. J., “Endothelial Function and Dysfunction: Testing and Clinical Relevance,” Circulation 115 (2007): 1285–1295. - PubMed
    1. Baeyens N., Bandyopadhyay C., Coon B. G., Yun S., and Schwartz M. A., “Endothelial Fluid Shear Stress Sensing in Vascular Health and Disease,” Journal of Clinical Investigation 126 (2016): 821–828. - PMC - PubMed
    1. Davis M. J., Earley S., Li Y.‐S., and Chien S., “Vascular Mechanotransduction,” Physiological Reviews 103 (2023): 1247–1421. - PMC - PubMed
    1. Chatterjee S., “Endothelial Mechanotransduction, Redox Signaling and the Regulation of Vascular Inflammatory Pathways,” Frontiers in Physiology 9 (2018): 524. - PMC - PubMed
    1. Maurya M. R., Gupta S., Li J. Y.‐S., et al., “Longitudinal Shear Stress Response in Human Endothelial Cells to Atheroprone and Atheroprotective Conditions,” Proceedings of the National Academy of Sciences of the United States of America 118 (2021): e2023236118. - PMC - PubMed

MeSH terms

Substances

LinkOut - more resources