. 2025 Jun 3;122(22):e2420708122.
doi: 10.1073/pnas.2420708122. Epub 2025 May 30.

Environmental DNA adsorption to chitin can promote horizontal gene transfer by natural transformation

Affiliations

Environmental DNA adsorption to chitin can promote horizontal gene transfer by natural transformation

Jacob D Holt et al. Proc Natl Acad Sci U S A. .

Abstract

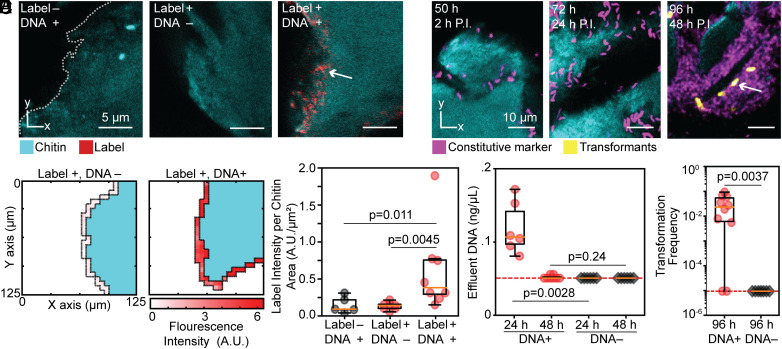
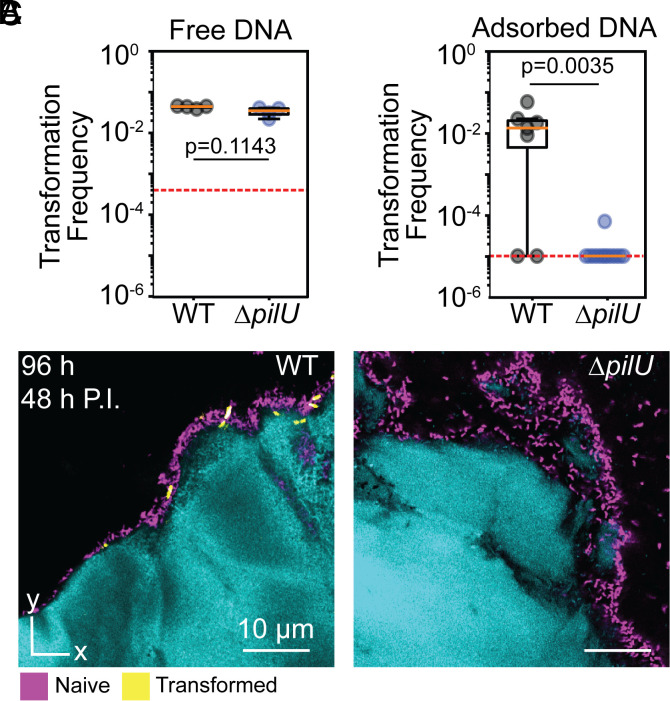
Horizontal gene transfer by natural transformation (NT) is induced in Vibrio cholerae upon attachment to chitin surfaces in the aquatic environment. Here, we show that free environmental DNA adsorbs to chitin surfaces under physiologically realistic conditions. Using live-cell imaging and a fluorescent NT reporter, we demonstrate with cellular resolution microscopy that V. cholerae utilizes chitin-bound DNA as a reservoir for genetic exchange. Additionally, we demonstrate that uptake of DNA from this chitin-bound reservoir requires the forceful retraction of competence type IV pili. These findings uncover a role for retraction force in driving pilus-dependent NT and suggest that chitin particle surfaces can act as hotspots for horizontal gene transfer.

Keywords: Vibrio; biofilm; chitin; natural transformation; pilus retraction force.


Conflict of interest statement

Competing interests statement:The authors declare no competing interest.

Figures

Fig. 1.
Fig. 1.
DNA accumulates on chitin under flow and is available for horizontal gene transfer by NT. (A) Representative images of chitin treated with DNA, Cy3 label, or Cy3-labeled DNA. At left, the outer surface of the chitin particle, which is exposed to the surrounding liquid, is shown with a dotted line trace. Note that the variable appearance of the chitin in panels A (and E), as well as in Fig. 2 and SI Appendix, Fig. S1, is due to confocal 2-dimensional optical sectioning through irregularly shaped 3-dimensional chitin particles used in the experiments. (B) Representative heatmaps quantifying Cy3 fluorescence intensity (A.U.) in proximity to the water-facing surface of sample chitin particles. (C) Box and whisker plots of Cy3 intensity, normalized to available chitin surface area (A.U./μm2), showing a significant difference between the Cy3-labeled DNA and Cy3 control (Mann–Whitney U test, n = 7-8) and the Cy3-labeled DNA and the unlabeled DNA control (Mann–Whitney U test, n = 5-8). (D) Box and whisker plot showing DNA concentration (ng/μL) in the effluent after a 24 h DNA addition period and a subsequent 24 h wash period. At 24 h, there is significantly more DNA in the effluent of the DNA treatment than in a control treatment to which no DNA was added (Mann–Whitney U test, n = 6). At 48 h, after the 24 h wash step, there is no significant difference in effluent DNA concentration between the two treatments (Mann–Whitney U test, n = 6-8). (E) Representative time series of images of V. cholerae biofilm formation and transformation on chitin. In these images, the time indicator at top left denotes the total elapsed time since the start of the experiment, and the time indicator just below denotes the elapsed time post inoculation with the V. cholerae reporter strain. Transformed cells first appeared 48 h post inoculation. (F) Box and whisker plot of V. cholerae transformation frequency 48 h after inoculation, indicating a significant increase in transformation frequency relative to a no-DNA control (Mann–Whitney U test, n = 7-10). Red dotted lines in panels (D and F) denote the limit of detection.
Fig. 2.
Fig. 2.
PilU is required for efficient NT when DNA is adsorbed to chitin. (A) A box and whisker plot showing no change in transformation frequency between WT and ΔpilU when assayed with DNA that is present in shaken liquid media (Mann–Whitney U test, n = 4). (B) A box and whisker plot illustrating the nearly complete loss of NT in a ΔpilU strain relative to WT when they are inoculated onto DNA-coated chitin particles (Mann–Whitney U test, n = 7-12). (C) Representative images of WT and ΔpilU biofilms. The red dotted lines in panels (A and B) denote the limit of detection.

References

    1. Conner J. G., Teschler J. K., Jones C. J., Yildiz F. H., Staying Alive: Vibrio cholerae’s Cycle of environmental survival, transmission, and dissemination. Microbiol. Spectr. 4, 4.2.02 (2016). - PMC - PubMed
    1. Li X., Roseman S., The chitinolytic cascade in Vibrios is regulated by chitin oligosaccharides and a two-component chitin catabolic sensor/kinase. Proc. Natl. Acad. Sci. U.S.A. 101, 627–631 (2004). - PMC - PubMed
    1. Meibom K. L., et al. , The Vibrio cholerae chitin utilization program. Proc. Natl. Acad. Sci. U.S.A. 101, 2524–2529 (2004). - PMC - PubMed
    1. Shapiro B. J., Levade I., Kovacikova G., Taylor R. K., Almagro-Moreno S., Origins of pandemic Vibrio cholerae from environmental gene pools. Nat. Microbiol. 2, 16240 (2016). - PubMed
    1. Blokesch M., Schoolnik G. K., Serogroup conversion of Vibrio cholerae in aquatic reservoirs. PLoS Pathog. 3, e81 (2007). - PMC - PubMed

LinkOut - more resources