. 2025 Jun 3;122(22):e2425781122.
doi: 10.1073/pnas.2425781122. Epub 2025 May 30.

Solution structure and synaptic analyses reveal determinants of bispecific T cell engager potency

Affiliations

Solution structure and synaptic analyses reveal determinants of bispecific T cell engager potency

Alexander Leithner et al. Proc Natl Acad Sci U S A. .

Abstract

Bispecific T cell engagers (TcEs) link T cell receptors to tumor-associated antigens on cancer cells, forming cytotoxic immunological synapses (IS). Close membrane-to-membrane contact (≤13 nm) has been proposed as a key mechanism of TcE function. To investigate this and identify potential additional mechanisms, we compared four immunoglobulin G1-based (IgG1) TcE Formats (A-D) targeting CD3ε and Her2, designed to create varying intermembrane distances (A < B < C < D). Small-angle X-ray scattering (SAXS) and modeling of the conformational states of isolated TcEs and TcE-antigen complexes predicted close contacts (≤13 nm) for Formats A and B and far contacts (≥18 nm) for Formats C and D. In supported lipid bilayer (SLB) model interfaces, Formats A and B recruited, whereas Formats C and D repelled, CD2-CD58 interactions. Formats A and B also excluded bulky Quantum dots more effectively. SAXS also revealed that TcE-antigen complexes formed by Formats A and C were less flexible than complexes formed by Formats B and D. Functional data with Her2-expressing tumor cells showed cytotoxicity, surface marker expression, and cytokine release following the order A > B = C > D. In a minimal system for IS formation on SLBs, TcE performance followed the trend A = B = C > D. Addition of close contact requiring CD58 costimulation revealed phospholipase C-γ activation matching cytotoxicity with A > B = C > D. Our findings suggest that when adhesion is equivalent, TcE potency is determined by two parameters: contact distance and flexibility. Both the close/far-contact formation axis and the low/high flexibility axis significantly impact TcE potency, explaining the similar potency of Format B (close contact/high flexibility) and C (far contact/low flexibility).

Keywords: breast cancer; immunological synapse; immunotherapy; multistate modeling; supported lipid bilayers.


Conflict of interest statement

Competing interests statement:F.L., F.S., M.C., S.R., H.N., D.W., S.H., S.C., D.Y., S.L., A.N., N.P., and S.K. work for Boehringer Ingelheim, which supported the research. S.J.D. is founder of MiroBio.

Figures

Fig. 1.
Fig. 1.
Structural analysis of TcEs. (A) Schematic overview of TcE formats. (B) Conformational space of TcEs (Top) and TcE–antigen complexes (Bottom) in solution. Gray meshes show overlay of all conformational states of each molecule. One single state per molecule is shown as colored surface representation. Magenta = anti-CD3, green = anti-Her2, blue = Fc-domain, yellow = CD3εγ, salmon = Her2. Flexible residues are shown in red. Disulfide bonds in the hinge region are shown in yellow. The dashed red line illustrates measurement of the distance between antigens. (C) SAXS-data derived conformation weight-adjusted distributions of antigen spacings, (D) radius of gyration, (E) center of mass (CoM) flexibility, (F) rotational flexibility, and (G) Shannon entropy. Solid yellow lines indicate medians, white dotted lines represent 1st and 3rd quartiles, respectively, red dashed lines indicate the close contact zone at 13 nm.
Fig. 2.
Fig. 2.
Intermembrane distances in the membrane-model system. (A) Schematic overview of GUV-SLB experimental system. (B) Representative TIRF images of CD3εδ and CD2 loaded GUVs (orange) incubated for 60 min on SLBs presenting 400 molecules/µm2 Her2 (green) and 200 molecules/µm2 CD58 (magenta), preincubated with TcEs. (Scale bar, 5 µm.) (C) Pearson correlation coefficient of Her2 and CD58 at the interface of CD3εδ and CD2 loaded GUVs and SLBs from (B). Yellow solid line = median, box and whiskers = min. and max. three biological replicates, Kruskal–Wallis test, ****P < 0.0001. (D) Schematic overview of T cell–SLB experimental system in the presence of Qdot525. (E) Representative TIRF images of TcE-mediated contacts of T cells on SLBs presenting Her2 at 400 molecules/µm2 (green) and QDot525 (magenta), preincubated with TcEs. (Scale bar, 5 µm.) (F) Pearson correlation coefficient of Her2 and Qdot525 at TcE mediated T cell–SLB contacts from (E), yellow solid line = median, white dashed line = quartiles, three biological replicates, Kruskal–Wallis test, **P ≤ 0.0058.
Fig. 3.
Fig. 3.
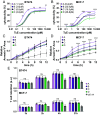
TcE-mediated cytotoxicity and adhesion. (A) BT474 or MCF-7 (B) cancer cell cytotoxicity upon increasing TcE concentrations after 24 h of coincubation in an E:T ratio of 5:1. Single data points represent the median of 6 biological replicates. Lines represent the nonlinear fit of the data. Numbers in brackets = EC50. Asterisks refer to two-way ANOVA results between Formats A and D at indicated TcE concentrations, **<0.01 and **<0.0001. (C) Relative Annexin 5+ Area over 12 h in cocultures of T cells with BT474 or MCF-7 (D) cancer cells at an E:T ratio of 5:1 in the presence of 50 pM TcEs. Three biological replicates. Solid circles = Median ± SEM. Solid black lines = no TcE controls. Asterisks refer to two-way ANOVA results between Formats A and D at indicated TcE concentrations, **<0.01 and **<0.0001. (E) Time-series of the relative retention of T cells on BT474 (Top) or MCF-7 (Bottom) tumor cells in the presence of 500 pM TcEs or IgG control. Mean ± SD, two biological replicates, two-way ANOVA, ns = not significant.
Fig. 4.
Fig. 4.
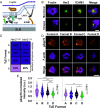
TcE-mediated immune synapse formation dynamics and signaling. (A) Schematic overview of T cell–SLB IS experimental system. (B) Representative TIRF images of monofocal and kinapse-like TcE-mediated IS formation at 50 pM TcE on SLBs at 400 (Her2, green) and 200 (ICAM1, yellow) molecules/µm2 after 20 min of interaction, stained for F-actin (magenta). (Scale bar, 5 µm.) (C) Analysis of TcE-mediated immune synapse phenotype frequencies after 20 min of interaction. Numbers in boxes represent the percentage of ISs with bulls-eye actin structures. Mean of three biological replicates. (D) Representative TIRF images of 50 pM TcE-mediated IS formation on SLBs at 400 (Her2) and 200 (ICAM1) molecules/µm2 after 20 min of interaction, stained for F-actin (magenta) and pZap70 (orange). (Scale bar, 5 µm.) (E) Normalized pZap70 levels at the 50 pM TcE-mediated IS at 400 (Left) or 30 (Right) molecules/µm2 of Her2 and 200 molecules/µm2 ICAM1. Yellow solid line = median, White dashed line = quartiles. Three biological replicates, Kruskal–Wallis test, *P < 0.05, **P < 0.005, ***P ≤ 0.0007, and ****P < 0.0001.
Fig. 5.
Fig. 5.
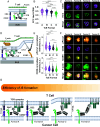
TcE-mediated CD2–CD58 cooperation. (A) Schematic overview of T cell–SLB experimental system in the presence of CD58. (B) Pearson correlation coefficient of Her2 and CD58 at TcE-mediated T cell–SLB contacts at 400 molecules/µm2 of Her2 and 200 molecules/µm2 CD58, preloaded with TcEs after 20 min of incubation. Yellow solid line = median, White dashed line = quartiles. Three biological replicates, Kruskal–Wallis test, ****P < 0.0001. (C) Representative TIRF images of TcE-mediated T cell–SLB contacts on SLBs from (B) with Her2 (green) and CD58 (magenta). (Scale bar, 5 µm.) (D) Schematic overview of T cell–SLB IS experimental system in the presence of CD58 and ICAM1. (E) Normalized pPLCγ1 (Top) and CD58 (Bottom) levels at the TcE-mediated IS at 400 (Her2) and 200 (ICAM1) molecules/µm2 in the presence of 200 molecules/µm2 CD58 and 5 pM TcEs after 20 min of incubation. Yellow solid line = median, White dashed line = quartiles. Three biological replicates, Kruskal–Wallis test, *P ≤ 0.0363, **P ≤ 0.007, ***P ≤ 0.0007, and ****P < 0.0001. (F) Representative TIRF images of TcE-mediated IS formation on SLBs from (E) with Her2 (green) ICAM1 (yellow), CD58 (magenta), pPLCγ1 (orange), and F-actin (green). (Scale bar, 5 µm.) (G) Working model of TcE potency. Transparent shadows of Formats B and D represent increased flexibility of the TcE–antigen complex.

References

    1. van de Donk N. W. C. J., Zweegman S., T-cell-engaging bispecific antibodies in cancer. Lancet 402, 142–158 (2023). - PubMed
    1. Brinkmann U., Kontermann R. E., The making of bispecific antibodies. MAbs 9, 182–212 (2017). - PMC - PubMed
    1. Roda-Navarro P., Álvarez-Vallina L., Understanding the spatial topology of artificial immunological synapses assembled in T cell-redirecting strategies: A major issue in cancer immunotherapy. Front. Cell Dev. Biol. 7, 1–5 (2020). - PMC - PubMed
    1. Dickopf S., Georges G. J., Brinkmann U., Format and geometries matter: Structure-based design defines the functionality of bispecific antibodies. Comput. Struct. Biotechnol. J. 18, 1221–1227 (2020). - PMC - PubMed
    1. Trabolsi A., Arumov A., Schatz J. H., T cell-activating bispecific antibodies in cancer therapy. J. Immunol. 203, 585–592 (2019). - PubMed

MeSH terms

LinkOut - more resources