. 2025 May 9;37(5):koaf049.
doi: 10.1093/plcell/koaf049.

Gene editing of the E3 ligase PIRE1 fine-tunes reactive oxygen species production for enhanced bacterial disease resistance in tomato

Affiliations

Gene editing of the E3 ligase PIRE1 fine-tunes reactive oxygen species production for enhanced bacterial disease resistance in tomato

Bardo Castro et al. Plant Cell. .

Abstract

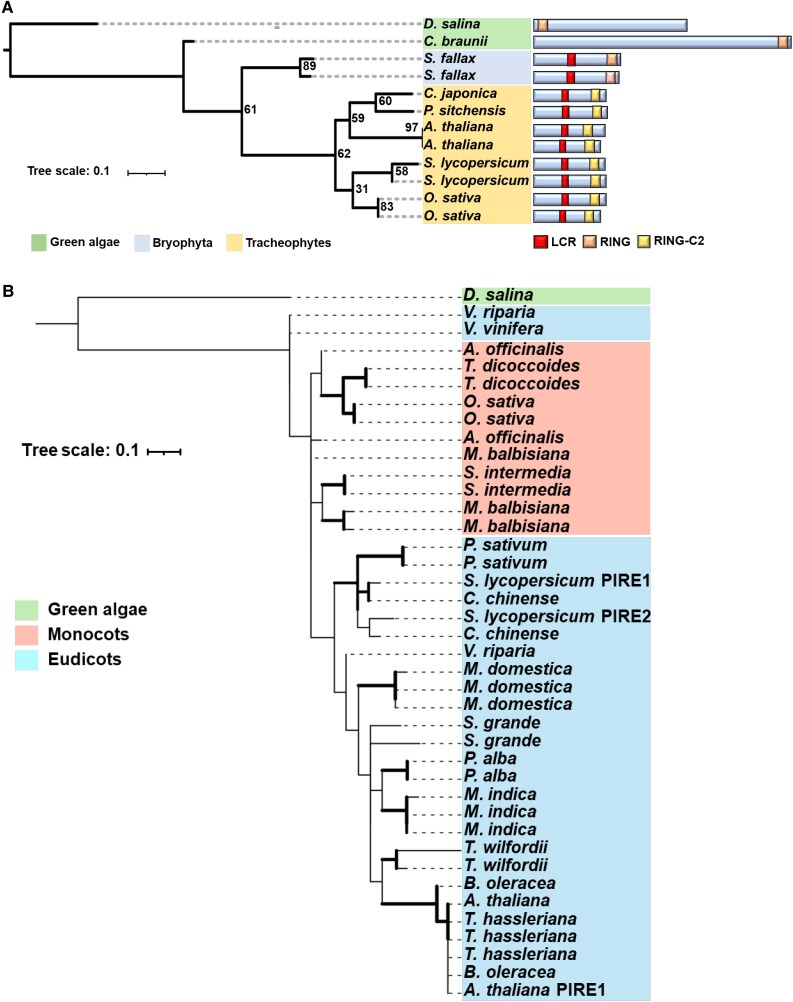
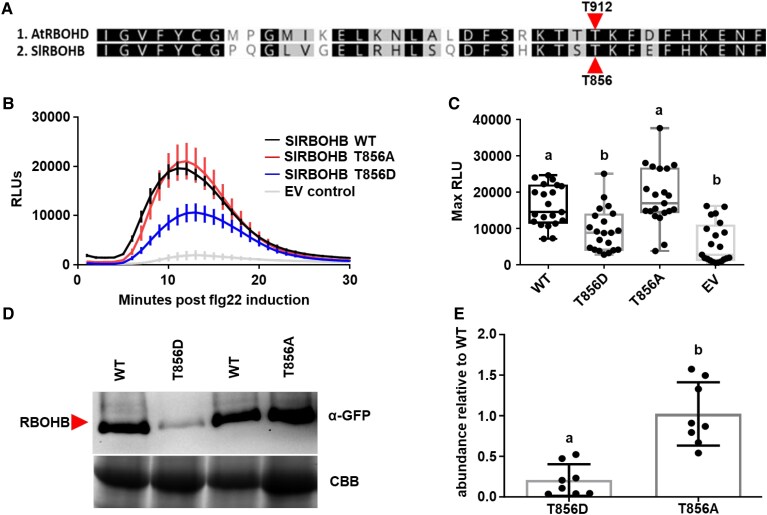
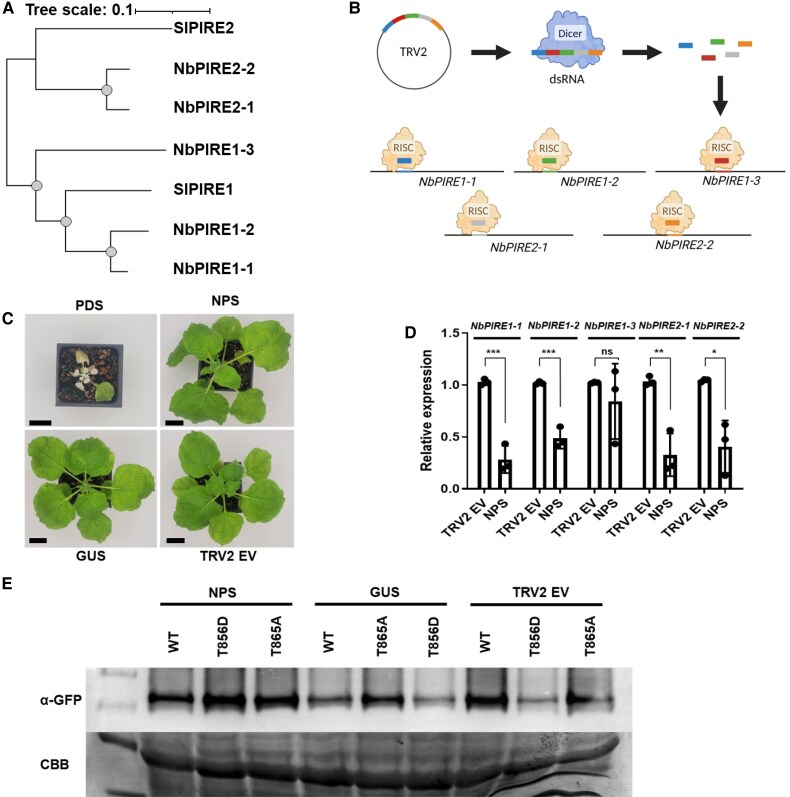
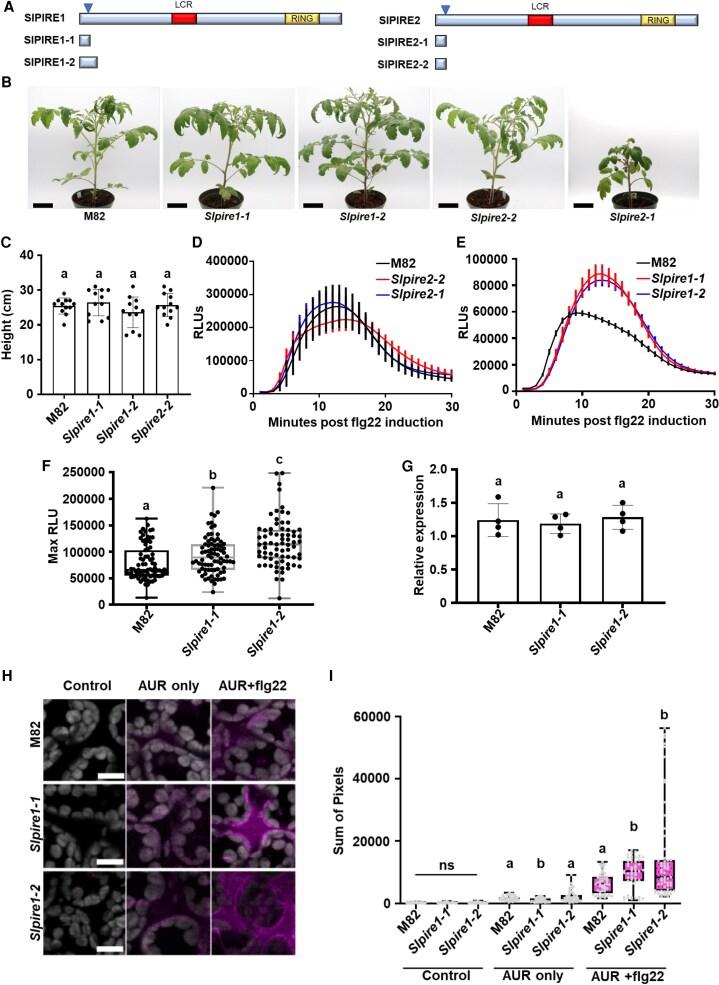
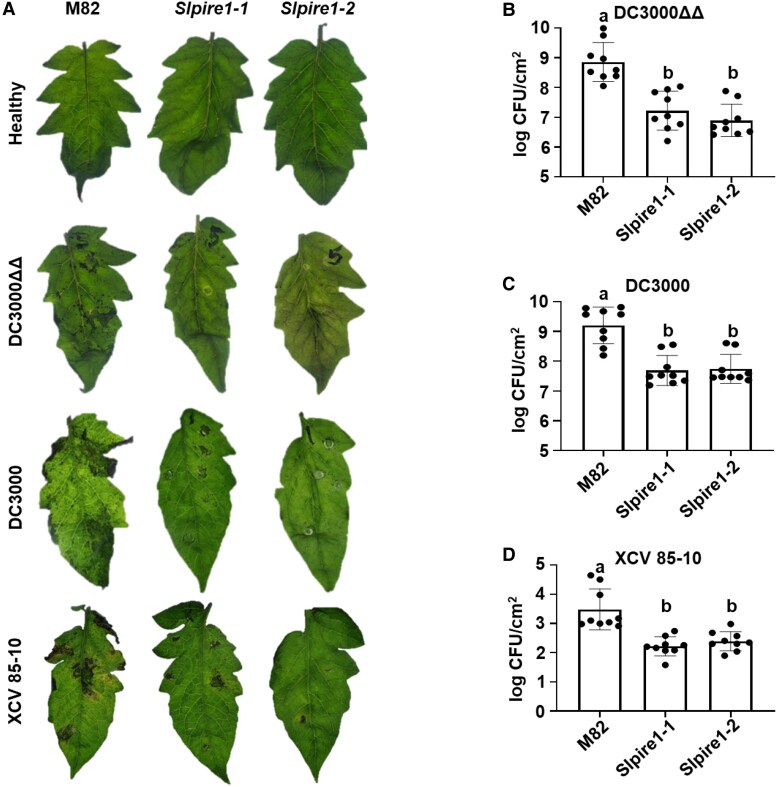
Reactive oxygen species (ROS) accumulation is required for effective plant defense. Accumulation of the Arabidopsis (Arabidopsis thaliana) NADPH oxidase respiratory burst oxidase homolog D (RBOHD) is regulated by phosphorylation of a conserved C-terminal residue (T912) leading to ubiquitination by the RING E3 ligase Pbl13-interacting RING domain E3 ligase (PIRE). Arabidopsis PIRE knockouts exhibit enhanced ROS production and resistance to the foliar pathogen Pseudomonas syringae. Here, we identified 170 PIRE homologs, which emerged in tracheophytes and expanded in angiosperms. We investigated the role of tomato (Solanum lycopersicum) PIRE homologs in regulating ROS production, RBOH stability, and disease resistance. Mutational analyses of residues corresponding to T912 in the tomato RBOHD ortholog, SlRBOHB, affected protein accumulation and ROS production in a PIRE-dependent manner. Using genome editing, we generated mutants in 2 S. lycopersicum PIRE (SlPIRE) homologs. SlPIRE1 edited lines (Slpire1) in the tomato cultivar M82 displayed enhanced ROS production upon treatment with flg22, an immunogenic epitope of flagellin. Furthermore, Slpire1 exhibited decreased disease symptoms and bacterial accumulation when inoculated with foliar bacterial pathogens P. syringae and Xanthomonas campestris. However, Slpire1 exhibited similar levels of colonization as wild type upon inoculation with diverse soil-borne pathogens. These results indicate that PIRE regulates RBOHs in multiple plant species and is a promising target for foliar disease control. This study also highlights the pathogen-specific role of PIRE, indicating its potential for targeted manipulation to enhance foliar disease resistance without affecting root-associated pathogenic interactions.


Conflict of interest statement

Conflict of interest statement. None declared.

Figures

Figure 1.
Figure 1.
Homologs of the RING E3 ligase PIRE are present in the tracheophytes and expanded in angiosperms. A) PIRE homologs are detected in the Tracheophytes. Phylogeny of the RING domain from Arabidopsis PIRE and closest homologs throughout the plant kingdom. The phylogenetic tree was generated using the maximum likelihood method with a bootstrap value of 1,000 using IQtree. Right: Domain architecture of PIRE homologs, which contain a C-terminal modified RING-C2 domain, and a low complexity region (LCR) enriched in serine and glutamic acid residues in the central region of the protein. Scale bar represents branch length. B) Phylogeny of the RING domain from 39 PIRE protein homologs identified in 20 different plant species. The phylogenetic tree was generated using the maximum likelihood method with a bootstrap value of 1,000. Sequence alignments were generated utilizing Clustal Omega. Branches supported with bootstrap values above 70 have increased thickness. Scale bar represents branch length.
Figure 2.
Figure 2.
Mutations in conserved C-terminal residues S. lycopersicum RBOHB lead to changes in ROS production and protein accumulation. A) C-terminal amino acid alignment of the NADPH oxidases from Arabidopsis (AtRBOHD) and S. lycopersicum (SlRBOHB). The previously identified phosphorylated threonine 912 (T912) in AtRBOHD corresponds to threonine 856 (T856) in SlRBOHB. B) Different RBOHB variants were transiently expressed in N. benthamiana. Leaf disks were collected from N. benthamiana and treated with 100 nm flg22 to induce ROS production over 30 min. Results display the mean ± Se, n = 7 leaf disks. Phosphomimetic SlRBOHBT856D has decreased the production of ROS compared with SlRBOHBWT and SlRBOHBT856A. The assay was repeated 3 independent times. Graph represents 1 representative experiment. C) SlRBOHBT856D ROS production is significantly lower than SlRBOHBWT and SlRBOHBT856A postflg22 induction as described above. Results display maximum relative light units (max RLU) of 3 independent experiments (n = 21 plants). The center line represents the median, the box highlights the upper and lower quartiles, and whiskers show minimum and maximum values. Statistical differences were determined by ANOVA with post hoc Tukey test (P < 0.0001). D) SlRBOHB protein abundance was visualized by anti-GFP immunoblot 48 h posttransient expression in N. benthamiana. SlRBOHBT856D displayed reduced accumulation in N. benthamiana compared with SlRBOHBWT and SlRBOHBT856A. The experiment was repeated 8 independent times. Picture represents 1 representative experiment. E) SlRBOHB protein accumulation was quantified from anti-GFP immunoblots utilizing Image Lab. Protein levels were first normalized using the Rubisco band from the Coomassie Brilliant Blue (CBB) gel, and then the relative intensity of each protein was compared with SlRBOHBWT set to 1. The experiment was repeated 8 independent times (n = 8), error bars represent Sd. Statistical differences were calculated by Kruskal–Wallis test with Dunn's multiple comparison test (P = 0.0003). SlRBOHBT856D has significantly lower protein accumulation than SlRBOHBWT and SlRBOHBT856A.
Figure 3.
Figure 3.
Changes in abundance of phosphomimetic SlRBOHB is dependent on PIRE homologs. A) Phylogenetic tree of N. benthamiana and S. lycopersicum PIRE homologs. Sequence alignments were generated utilizing the clustal omega program, and the mid-rooted phylogenetic tree was generated using maximum likelihood method with a bootstrap value of 1,000. Gray dots signify bootstraps higher than 80, Sl = S. lycopersicum, Nb = N. benthamiana. Scale bar represents branch length. B) Diagram of the stacked VIGS approach. Small (∼150 bp) regions of NbPIRE homologs were cloned into the TRV2 silencing vector, and then Agrobacterium carrying TRV1 and TRV2 were coinfiltrated into 2-wk-old N. benthamiana. The silencing fragments are converted into a long double-stranded RNA (dsRNA), which then get processed by dicer to generate short interfering RNAs (siRNAs) leading to depletion of 4 of 5 NbPIRE homologs (NPS construct). Diagram made in Biorender (agreement number JH281NIAW8). C) Images of N. benthamiana 2 wk post TRV inoculation via A. tumefaciens. The plant silenced for PDS displayed photobleaching and dwarfism. Black bars represent 3 cm. D)  N. benthamiana-silenced plants and controls were subjected to RT-qPCR to analyze PIRE expression levels. Relative expression was calculated compared with the Ef1α housekeeping gene. TRV2NPS treated plants displayed significantly lower expression levels of NbPIRE homologs when compared with TRV2EV control, except for NbPIRE1-3. Each data point represents the average of 1 biological replicate (n = 3 plants), and error bars represent Sd. Differences were detected by multiple t-tests (P-values: Nbpire1-1 = 0.0007, Nbpire1-2 = 0.0008, Nbpire1-3 = 0.4369, Nbpire2-1 = 0.0043, and Nbpire2-2 = 0.0120). All experiments were performed 3 independent times. E) Wild-type SlRBOHB and phosphorylation mutants were transiently expressed in N. benthamiana 2 wk post TRV inoculation. Protein accumulation was visualized by anti-GFP immunoblotting. The image shows 1 representative experiment. Experiment was repeated 3 independent times. Silencing of NbPIRE homologs leads to enhanced accumulation for RBOHBT856D. TRV2NPS plant displayed enhanced accumulation of RBOHBT856D when compared with the TRV2EV silencing control.
Figure 4.
Figure 4.
Editing tomato SlPIRE1 results in enhanced production of ROS upon flagellin perception. A) Diagram of SlPIRE1 and SlPIRE2, arrows represent areas targeted by CRISPR/Cas9. Below the protein diagrams are the predicted truncated proteins generated from gene editing in S. lycopersicum cv M82. B) The SlPIRE1 gene-edited lines did not display growth phenotypes in comparison with M82 (wild type [WT]) plants, under vegetative growth conditions. The Slpire2 line 1 (Slpire2-1) displayed decreased growth compared with M82, but Slpire2-2 displayed growth rates similar to M82. Black bars represent length of 6 cm. C) Height quantification of M82 and gene-edited lines. Heights were measured from soil to shoot apical meristem. n = 15 plants. Error bars represent Sd. Statistical analysis was performed by ANOVA with post hoc Tukey test (P = 0.2599). D and E) ROS production was analyzed in 4-wk-old M82, Slpire1, and Slpire2 after treatment with 100 nm flg22. Slpire2 gene-edited lines did not display changes in ROS production in comparison with M82 after flg22 treatment. Slpire1 lines displayed enhanced ROS production post flg22 treatment compared with M82. n = 3 plants with 8 leaf disks per plant, error bars represent Sem. Graphs show 1 representative experiment. F) Quantification of ROS production in 4-wk-old M82, Slpire1, and Slpire2 after treatment with 100 nm flg22. Results display maximum relative light units (max RLU). Slpire1 lines produce significantly higher max RLU compared with M82 after flg22 treatment. n = 72 leaf disks over 3 sets of biological replicates (9 plants per genotype). Outliers were identified and removed using robust regression and outlier removal (ROUT) method (Q = 1%). The center line in the box represents the median, the box highlights the upper and lower quartiles, and whiskers show minimum and maximum values. Statistical differences were calculated by a 1-way ANOVA with post hoc Tukey test (P < 0.00010). G) Transcriptional expression of Slrbohb on tissue from M82, Slpire1-1, and Slpire1-2. RNA extraction and cDNA synthesis were performed on tissue collected from 4-wk-old tomato plants. Relative expression was calculated compared with the Ef1α housekeeping gene. There were no significant changes in transcription between M82, Slpire1-1, and Slpire1-2 lines. Data point represents the average of 3 technical replicates per biological replicate (n = 4 plants), and error bars represent Sd. Kruskal–Wallis test with Dunn's multiple comparison test (P < 0.7697). H and I) ROS was visualized and quantified using the nonpermeable Amplex Ultra Red (AUR) stain 15 min postleaf infiltration with 100 nm flg22. AUR was visualized by confocal microscopy. Representative images of M82, Slpire1-1, and Slpire1-2 with or without AUR and flg22 treatment. Image J was used to quantify the same size (1 × 1 cm) of 5 randomly selected regions per image. Three plants per genotype with 2 images per leaf were quantified, n = 6 images per genotype and treatment. Differences per treatment were calculated by Kruskal–Wallis test with Dunn's multiple comparison test (P-values: control = 0.3124, AUR only = 0.0005, and AUR flg22 = 0.0009). Slpire1 lines exhibited significantly enhanced production of apoplastic ROS after induction with flg22. The center line in the box represents the median, the box highlights the upper and lower quartiles, and whiskers show minimum and maximum values. All experiments were repeated at least 3 independent times.
Figure 5.
Figure 5.
Editing SlPIRE1 results in decreased disease symptoms and bacterial accumulation. A) Two independently gene-edited SlPIRE1 lines (Slpire1-1 and Slpire1-2) displayed reduced disease symptoms 3 dpi with Pst DC3000 ΔavrPtoΔavrPtoB (DC3000ΔΔ), 3 dpi for Pst DC3000 (DC3000), and 7 dpi for X. campestris pv. vesicatoria (XCV 85-10). Representative images of 9 plant infections. Images were digitally extracted for comparison. Black bars represent 1 cm length. Disease assays were performed 3 independent times per pathogen. Images show 1 representative experiment. To determine bacterial titers, leaf tissue was sampled 3 dpi for DC3000 and 7 dpi for XCV 85-10. Both Slpire1-1 and Slpire1-2 lines displayed decreased accumulation of DC3000ΔΔ B), DC3000 C), and XCV 85-10 D) compared with wild-type M82. n = 9 plants. Error bars represent Sd. Statistical analysis was performed by 1-way ANOVA with post hoc Tukey test (DC3000ΔΔ P < 0.0001, DC3000 P < 0.0001, and XCV85-10 P = 0.0423).

Update of

Similar articles

Cited by

References

    1. Acevedo-Garcia J, Spencer D, Thieron H, Reinstädler A, Hammond-Kosack K, Phillips AL, Panstruga R. mlo-based powdery mildew resistance in hexaploid bread wheat generated by a non-transgenic TILLING approach. Plant Biotechnol J. 2017:15(3):367–378. 10.1111/pbi.12631 - DOI - PMC - PubMed
    1. Ahn YJ, Kim H, Choi S, Mazo-Molina C, Prokchorchik M, Zhang N, Kim B, Mang H, Koehler N, Kim J, et al. Ptr1 and ZAR1 immune receptors confer overlapping and distinct bacterial pathogen effector specificities. New Phytol. 2023:239(5):1935–1953. 10.1111/nph.19073 - DOI - PubMed
    1. Akter A, Hassan L, Nihad SAI, Hasan MJ, Robin AHK, Khatun M, Tabassum A, Latif MA. Pyramiding of bacterial blight resistance genes into promising restorer BRRI31R line through marker-assisted backcross breeding and evaluation of agro-morphological and physiochemical characteristics of developed resistant restorer lines. PLoS One. 2024:19(6):e0301342. 10.1371/journal.pone.0301342 - DOI - PMC - PubMed
    1. Ashtamker C, Kiss V, Sagi M, Davydov O, Fluhr R. Diverse subcellular locations of cryptogein-induced reactive oxygen species production in tobacco Bright Yellow-2 cells. Plant Physiol. 2007:143(4):1817–1826. 10.1104/pp.106.090902 - DOI - PMC - PubMed
    1. Bartlem DG, Jones MGK, Hammes UZ. Vascularization and nutrient delivery at root-knot nematode feeding sites in host roots. J Exp Bot. 2014:65(7):1789–1798. 10.1093/jxb/ert415 - DOI - PubMed

MeSH terms

LinkOut - more resources