. 2025 May 28;32(3):dsaf008.
doi: 10.1093/dnares/dsaf008.

Integrative transcriptomic analysis reveals alternative splicing complexity and transcriptomic diversity in porcine placentas across altitudes

Affiliations

Integrative transcriptomic analysis reveals alternative splicing complexity and transcriptomic diversity in porcine placentas across altitudes

Chang-Yao Li et al. DNA Res. .

Abstract

High-altitude hypoxia provides a natural laboratory for studying adaptation in plateau mammals. As an interface for oxygen and nutrient exchange, placenta plays a critical role in fetal development. While high-altitude adaptation in systemic physiological responses and cardiopulmonary tissues has been well-studied, a comprehensive landscape of porcine placental transcriptomic diversity and alternative splicing (AS) complexity across altitudes remains lacking. Here, we integrated Iso-Seq and RNA-Seq to profile placental transcriptomes from placentas of 3 pig breeds across altitudes: the Diannan small-ear pig (DSE ~500 m), the Baoshan pig (BS ~1500 m), and the Changdu Tibetan Pig (CT ~3500 m). We identified 39,776 full-length transcripts, including 25,471 novel ones, significantly enhancing pig genome annotation. Additionally, 24,879 AS events from 8,390 AS genes were detected, with skipping exon (SE) as the most prevalent AS type. Differential expression (DE) and differential alternative splicing (DAS) analyses highlighted key DEGs (IGF1, GHR, RASGRP4, MECOM, SPP1), as well as DAS genes (HIF1A, HSPA8, RHOA, HMGCR, PLAGL1), which may be implicated in placental adaptation to high-altitude conditions. This study provides a comprehensive analysis of the transcriptomic diversity and AS complexity in porcine placentas across altitudes, laying a foundation for future investigations into the molecular mechanisms underlying high-altitude adaptation in plateau mammals.

Keywords: alternative splicing (AS); high-altitude adaptation; pig; placenta; transcriptomics.


Conflict of interest statement

The authors declare no conflict of interest.

Figures
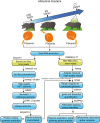
Fig. 1.
Fig. 1.
Workflow of bioinformatics analysis.
Fig. 2.
Fig. 2.
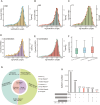
Length distribution of high-quality (HQ) isoform. (A) DSE placenta. (B) BS placenta. (C) CT placenta. (D) Length distribution of merged full-length non-chimeric (FLNC) sequences across the three breeds. (E) Length distribution of HQ unique isoforms from the three breeds. (F) Comparison of FLNC sequences, unique isoforms, and Ensembl-annotated transcripts. (G), Mapping results of HQ isoforms to the pig reference genome. (H) Upset plot illustrating exclusive and collective isoforms across three breeds.
Fig. 3.
Fig. 3.
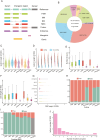
Classification and characteristics of identified full-length transcripts. (A) Schematic overview for transcript annotation and classification. (B) Percentage distribution of the 8 transcript categories. (C) Over length of the eight transcript types. (D) Length comparison between coding and non-coding isoforms. (E) Exon counts across transcript categories. (F) CDS lengths of the eight transcript types. (G) ORF lengths among the eight transcript types. (H) Protein-coding potential across the eight types. (I) Levels of nonsense-mediated mRNA decay (NMD) in each transcript types. (J) Distribution of isoform number per gene.
Fig. 4.
Fig. 4.
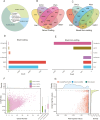
Analysis of novel coding and non-coding isoforms. (A) Percentage of annotated transcripts and novel isoforms. (B) Numbers of novel coding isoforms identified by CNCI, CPC2, Pfam, GMST. (C) Numbers of novel non-coding isoforms (lncRNA) numbers identified by CNCI, CPC2, Pfam, GMST. (D) Distribution of novel coding isoforms across transcript categories. (E) Number of novel non-coding isoforms (lncRNA) in each category. (F) Isoform length and exon number among novel lncRNAs, known lncRNAs and mRNAs, illustrated through a scatter plot, box plot, and density curve. Dashed lines representing thresholds of 1000 bp for transcript length and 5 exon count. (G) Function annotation of novel coding isoforms, with a significance threshold of log10 (e-value) < −5. Red dots represent transcripts with significant matches in both Uniprot and Pfam; blue and green dots indicate matches in Uniprot or Pfam, respectively; gray dots represent non-significant alignments in both databases.
Fig. 5.
Fig. 5.
RNA-seq paired-end short reads results. (A) Transcripts integrity number (TIN) for each sample. (B) Percentage of short reads mapped and unmapped to genome across all samples. (C), The numbre of short reads mapped to different gene regions. (D) Number of expressed genes (TPM > 1) in the placentas of pigs across different altitudes. (E-F) Differential expression analysis of high- and low-altitude pig placentas (upregulated: p-value < 0.05 & Log2FoldChange > 1; downregulated: p-value < 0.05 & Log2FoldChange < -1; non-significant: P-value > 0.05). DSE vs. CT (E), BS vs. CT (F).
Fig. 6.
Fig. 6.
Analysis of DEGs related to altitude adaptation pathways. (A) Genes corresponding to transcripts in ten pathways (P.adjust < 0.005). (B) Number of DEGs in DSE vs. CT and BS vs. CT. (C) Transcript number of 44 DEGs associated with altitude adaptation pathways. (D) Top ten DEGs with transcript count as being related to altitude adaptation. (E) Overall expression distribution of the top ten DEGs related to altitude adaptation.
Fig. 7.
Fig. 7.
Identification of alternative splicing and differential alternative splicing. (A) Schematic of the 7 types of AS events. (B) Frequency of the 7 AS events across different breeds. (C) Distribution of the 7 AS events across PSI interval in three breeds. (D) The number of DAS events across different breed combinations.
Fig. 8.
Fig. 8.
Differential transcripts in DSE vs. CT. (A) Differential transcript in DSE genes between the DSE vs. CT. (B) THIF1A transcripts, including all known transcripts and differentially expressed transcript PB.768.11. (C) 3D protein structures of 2 known transcripts and the differential transcript PB.768.11, modeled by AlphaFold3.
Fig. 9.
Fig. 9.
Motif enrichment analysis of cassette exons. (A) The number of cassette exons of SE across differential breed combinations (P-value < 0.05, dPSI > 0.1). (B) The motif number of the intronic sequences flanking SE cassette exons (pvalue < 0.05). (C) GO enrichment pathways of transcription factors (TFs) binding to enriched motifs (Padj value < 0.05).

References

    1. Maltepe E, Fisher SJ.. Placenta: the forgotten organ. Annu Rev Cell Dev Biol. 2015:31:523–552. https://doi.org/10.1146/annurev-cellbio-100814-125620 - DOI - PubMed
    1. Burton GJ, Fowden AL.. The placenta: a multifaceted, transient organ. Philos Trans R Soc London Ser B. 2015:370:20140066. https://doi.org/10.1098/rstb.2014.0066 - DOI - PMC - PubMed
    1. Fowden AL, et al.Programming placental nutrient transport capacity. J Physiol. 2006:572:5–15. - PMC - PubMed
    1. Gude NM, Roberts CT, Kalionis B, King RG.. Growth and function of the normal human placenta. Thromb Res. 2004:114:397–407. https://doi.org/10.1016/j.thromres.2004.06.038 - DOI - PubMed
    1. Cross JC, Werb Z, Fisher SJ.. Implantation and the placenta: key pieces of the development puzzle. Science. 1994:266:1508–1518. https://doi.org/10.1126/science.7985020 - DOI - PubMed