. 2025 May 30;19(5):e0013120.
doi: 10.1371/journal.pntd.0013120. eCollection 2025 May.

Probing orthobunyavirus reassortment using Bunyamwera and Batai viruses as models

Affiliations

Probing orthobunyavirus reassortment using Bunyamwera and Batai viruses as models

James M Bowen et al. PLoS Negl Trop Dis. .

Abstract

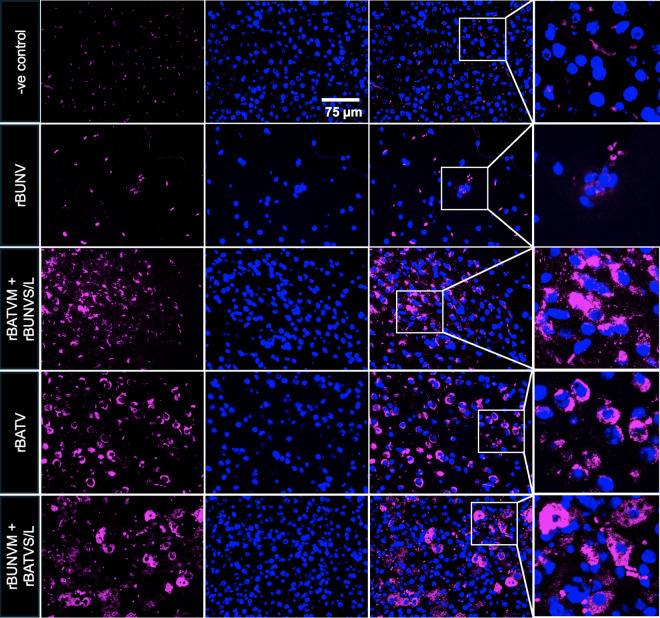
Reassortment is a critical evolutionary mechanism for segmented viruses, enabling the exchange of intact genome segments during co-infection and driving orthobunyavirus evolution; however, the molecular mechanisms underpinning this process remain unclear. With over 100 orthobunyavirus species, many of which are significant human and veterinary pathogens, understanding how reassortment influences transmissibility and virulence is essential for preempting the emergence of novel pathogens. Here, we use Bunyamwera virus (BUNV) and Batai virus (BATV) as models to explore orthobunyavirus reassortment through reverse genetics. We established the first reverse genetics system for BATV, generated reassortants, and employed minigenome assays to assess replication machinery compatibility. Additionally, we developed a novel hybridization chain reaction assay for high-resolution visualization of viral RNA segments. Our findings revealed that all six reassortants between BUNV and BATV are viable, exhibiting notable phenotypic differences in interferon-deficient (IFNAR-/-) mice. This work introduces essential tools and new insights into orthobunyavirus reassortment and pathogenesis, laying the groundwork for understanding this critical evolutionary process.


Conflict of interest statement

The authors have declared that no competing interests exist.

Figures

Fig 1
Fig 1. BUNV and BATV minigenome assay.
(A) Schematic of a minigenome assay (created in BioRender. Tilston, N. (2025) https://BioRender.com/9ry0hhq). BSR-T7/5 cells transfected with plasmids expressing minigenomes along with N and RdRp expression plasmids. Minigenome transcripts are expressed in the negative sense and require both N and RdRp for transcription and replication. (B) BUNV and BATV minigenomes. BSR-T7/5 transfected with S, M, or L minigenome plasmids along with either BUNV or BATV N and RdRp expression plasmids. Controls contained minigenome and N expression plasmids only. 2 days post-transfection, cells were visualized using a fluorescence microscope. Representative images are shown out of an n = 3. Scale bar 534.9 μm.
Fig 2
Fig 2. Rescue and characterization of rBATV.
(A and B) Viral growth curves in Vero E6 (A) and A549 (B) cells infected with either rBUNV or rBATV at MOI 0.1. Infectious viral titers were determined at 8, 18, 24, and 48 h.p.i. and represented as TCID50/ml. Error bars represent standard deviations (n = 3), and the dotted line represents the limit of detection (LoD). (C) Viral plaque phenotype comparison between rBUNV and rBATV. Plaque assays in Vero E6 cells were fixed in 4% PFA and stained with crystal violet. Representative images are shown out of an n = 3. (D) Genome copies-to-PFU ratio of rBUNV and rBATV in Vero E6 cells at 24 and 48 h.p.i. RNA was extracted from cell-free supernatant virus stock, and genome copies determined by RT-qPCR. Virus stock titers were determined by plaque assay. Error bars represent standard deviation (n = 3).
Fig 3
Fig 3. Rescue and characterization of rBUNV-rBATV reassortants.
(A) Viral plaque phenotype comparison between reassortants. Plaque assays in Vero E6 cells were fixed at 4 d.p.i. in 4% PFA and stained with crystal violet. Representative images are shown out of an n = 2. (B) Viral growth curves in Vero E6 (A) and A549 (B) cells infected with various reassortants at MOI 0.1. Infectious viral titers were determined at 8, 18, 24, and 48 h.p.i. and represented as TCID50/ml. Error bars represent standard deviations (n = 3), and the dotted line represents the LoD.
Fig 4
Fig 4. Development of a bunyavirus HCR RNA-FISH assay.
(A) Schematic of the HCR assay workflow (Created in BioRender. Tilston, N. (2025) https://BioRender.com/9ry0hhq). (B-C) Vero E6 cells were either mock-infected or infected with rBUNV at an MOI 0.1 and fixed at defined time points. The S (green), M (red), and L (magenta) genome segments were detected using HCR RNA-FISH. Nuclei (blue) were visualized by DAPI staining. Representative images are shown out of an n = 3. Scale bars 10 μm (D) Three-dimensional representation illustrating the intracellular spatial distribution of genome segments.
Fig 5
Fig 5. Validation of the bunyavirus HCR RNA-FISH Assay.
(A-B) Vero E6 cells were infected with rBUNV or rBATV at an MOI of 1 and fixed 8 h.p.i. The S, M, and L genome segments were visualized using the HCR RNA-FISH assay. Representative images are shown out of an n = 2. Scale bars 10 μm. (C) Quantitative analysis of relative abundance for S, M, and L genome segments in Vero E6 cells infected with rBUNV and rBATV. Each data point represents the percentage of cells with detectable fluorescence for a specific genome segment. (D) Proportion of vRNA foci within each cell (Vero E6) co-localizing two or more genome segments.
Fig 6
Fig 6. rBUNV and rBATV infection in mice.
(A and E) Experimental outline of mice infection (Created in BioRender. Tilston, N. (2025) https://BioRender.com/9ry0hhq). Mice were SC infected with either rBUNV, rBATV, or Opti-MEM (B and F). Survival curves of infected mice (n = 5; A-D and n = 3 for mock only in E-H) (C and G). Percent weight change of mice from baseline during the course of infection. (D and H) Viral load per gram of tissue in the liver, spleen, lung, heart, and brain of mock, rBUNV or rBATV infected mice as measured by RT-qPCR (QuantStudio 5 Applied Biosystems). The dashed line represents the LoD and ND signifies non-detected.
Fig 7
Fig 7. rBUNV-rBATV reassortant infection in mice.
(A) Survival curves of mice infected with rBUNV1 (n = 3), rBATV2 (n = 3), S2M1L2 (n = 5) or S1M2L1 (n = 5) (B) Percent weight change of mice from baseline during the course of infection. (C) Symptom score for all infected mice (D) Viral load per gram of tissue in the liver, spleen, heart, lung, and brain of all infected mice as measured by RT-qPCR (QuantStudio 5 Applied Biosystems). Comparisons between the liver and brain were performed for each virus group using a one-way ANOVA.
Fig 8
Fig 8. Liver pathology in mice infected with rBUNV, rBATV, and reassortants.
(A) Representative images of liver sections showing severe multifocal hepatic necrosis in mice infected with rBUNV, rBUNV M + rBATV S/L (S2M1L2), rBATV, or rBATV M + rBUNV S/L (S1M2L1), as indicated by yellow arrows. Areas of fatty acid accumulation are highlighted with white arrows. A magnified view of fatty acid accumulation in rBATV-infected liver is shown within the image. Sections were stained with H&E, visualized under light-field microscopy, and imaged using an Aperio whole-slide imaging system. Scale bars, 200 μm. (B) Representative images of liver tissue sections showing L segment vRNA (magenta) detected using HCR RNA-FISH. Nuclei are visualized with Hoechst staining (blue). Scale bars 10 μm. -ve control (rBUNV), rBUNV, rBATVM + rBUNVS/L were stained using BUNV HCR assay. -ve control (rBATV), rBATV, rBUNVM + rBATVS/L were stained using BATV HCR assay.
Fig 9
Fig 9. Detection of vRNA in the brain of IFNAR-/- mice infected with rBUNV, rBATV, and reassortants using HCR RNA-FISH.
Representative images of brain tissue sections showing L segment vRNA (magenta) detected using HCR RNA-FISH. Nuclei are visualized with Hoechst staining (blue). rBUNV, rBATVM + rBUNVS/L (S1M2L1), were stained using BUNV HCR assay, while -ve control, rBATV, and rBUNVM + rBATVS/L (S2M1L2), were stained using BATV HCR assay.

Similar articles

Cited by

References

    1. Barr JN, Fearns R. Genetic instability of RNA viruses. Genome stability. 2016. p. 21–35.
    1. Briese T, Calisher CH, Higgs S. Viruses of the family Bunyaviridae: are all available isolates reassortants? Virology. 2013;446(1–2):207–16. doi: 10.1016/j.virol.2013.07.030 - DOI - PubMed
    1. Lowen AC. It’s in the mix: reassortment of segmented viral genomes. PLoS Pathog. 2018;14(9):e1007200. doi: 10.1371/journal.ppat.1007200 - DOI - PMC - PubMed
    1. Lowen AC. Constraints, drivers, and implications of influenza A virus reassortment. Annu Rev Virol. 2017;4(1):105–21. doi: 10.1146/annurev-virology-101416-041726 - DOI - PubMed
    1. Elliott RM. Orthobunyaviruses: recent genetic and structural insights. Nature Publishing Group. 2014;12. - PubMed

LinkOut - more resources