. 2025 May 30;10(107):eads7377.
doi: 10.1126/sciimmunol.ads7377. Epub 2025 May 30.

Human LY9 governs CD4+ T cell IFN-γ immunity to Mycobacterium tuberculosis

Affiliations

Human LY9 governs CD4+ T cell IFN-γ immunity to Mycobacterium tuberculosis

Masato Ogishi et al. Sci Immunol. .

Abstract

CD4+ T cells are indispensable for optimal immunity to Mycobacterium tuberculosis (M.tb), a pathogen that triggers tuberculosis (TB) in humans. M.tb-specific human CD4+ T cells are known to polarize toward an interferon-γ (IFN-γ)-producing, CCR4-CCR6+CXCR3+T-bet+RORγT+ T helper 1* cell (TH1*cell) memory phenotype. We report that autosomal recessive deficiency of the human lymphocytic surface receptor LY9 (SLAMF3 and CD229), which is found in less than 10-5 individuals in the general population, underlies TB in three unrelated patients due to selective impairment in IFN-γ production by TH1* cells. TH1* cells express higher levels of LY9 than other CD4+ T cells. Mechanistically, LY9 polarizes naïve CD4+ T cells toward memory TH1* cells by inducing T-bet via signaling lymphocytic activation molecule (SLAM)-associated protein (SAP) and RORγT (thymus-specific retinoid-related orphan receptor γ) without SAP. LY9 costimulation enhances TCR-driven IFN-γ production of memory TH1*, but not TH1, cells in a T cell-intrinsic manner via NFAT1 (nuclear factor of activated T cells 1) and RORγT. LY9 is likely to govern an optimal TH1* cell- and IFN-γ-dependent protective immunity to M.tb in humans.


Conflict of interest statement

Competing interests

The authors declare that there are no relevant competing interests.

Figures
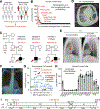
Figure 1.
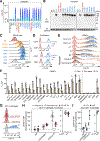
Figure 1.. Autosomal recessive LY9 deficiency.
(A) Search for homozygous pLOF variants displaying enrichment in TB patients. (B) Normalized LY9 mRNA levels in various human cell subsets. Data were retrieved from the Human Protein Atlas (73). (C) Pedigree of the kindreds. Black symbols indicate affected individuals. Genotypes for LY9 are also shown. WT: wild-type. M: mutant. E?: unknown. (D) Thoracic computed tomography scans of P1 on presentation showing bilateral lobar consolidations and atelectasis in the left lung. (E) Chest X ray of P4 showing mediastinal tuberculous lymphadenitis (arrows), which improved after 6 months of anti-TB therapy. (F) A chest X ray for P2 (P1’s paternal uncle) taken at the age of 28 years; this individual remains healthy at the age of 29 years. (G) Population genetics of LY9. The minor allele frequency (MAF) and combined annotation-dependent depletion (CADD) scores for all homozygous non-synonymous LY9 variants found in the gnomAD database or our in-house cohort are depicted. The CADD scores of 22.4 for c.182del (G61Vfs*3) and 23.8 for c.1052_1053del (H351Rfs*22) are well above the mutation significance cutoff (MSC) of 2.4 (79, 80) (horizontal dotted line). (H) Normalized LY9 mRNA levels in various human immune cell subsets. Data were retrieved from the Human Protein Atlas (73). N=6 donors. Bars represent the mean and SEM. (I) A protein-level representation of the patients’ mutations. SP: signal peptide. EC: extracellular domain. TM: transmembrane domain. IC: intracellular domain. The sequences corresponding to the various exons and their boundaries are also shown.
Figure 2.
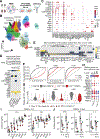
Figure 2.. Analysis of LY9 expression and function.
(A and B) Analysis of LY9 expression in an overexpression system. HEK293T cells were transfected with an empty vector (EV) or plasmids encoding the wild-type (WT) or mutant LY9 proteins with a C-terminal DDK tag. Representative results of two independent experiments. (A) Surface LY9 expression, as determined by flow cytometry with a PE-conjugated anti-LY9 mAb. (B) Immunoblotting of total protein extract probed with an anti-DDK monoclonal antibody (mAb). GAPDH was used as a loading control. (C-I) Analysis of LY9 expression and function in the patients’ cells. (C-F) Surface LY9 expression in (C) Epstein-Barr virus-immortalized B (EBV-B) cells, (D) T-cell blasts (T-blasts), and (E and F) peripheral blood mononuclear cell (PBMC) subsets, as determined by flow cytometry. (G) Rescue, by lentiviral transduction, of surface LY9 expression in T-blasts from P4. (H and I) ERK phosphorylation assay. (H) Non-transduced CD4+ T-blasts or (I) lentivirally transduced CD4+ T-blasts from P4 were stimulated for 15 minutes with bead-conjugated mAbs, and the levels of phospho-ERK1/2 were measured by flow cytometry. Technical triplicates were performed for cells from the patients and for P4’s travel control. In A-D and G-I, representative results from two independent experiments are shown. For αCD3/αLY9 stimulation in H, statistical significance was determined for the difference in background-subtracted median fluorescence intensity between all controls and LY9-deficient individuals. ***, P < 0.001 by unpaired Wilcoxon’s rank-sum test. In C-E and G, vertical dashed lines represent the median. In F, H, and I, bars represent the mean and SEM. P/I, phorbol 12-myristate 13-acetate (PMA) and ionomycin.
Figure 3.
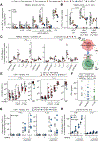
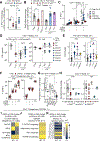
Figure 3.. Impaired IFN-γ-driven leukocytic responses to M.tb.
(A-H) Single-cell RNA sequencing (scRNASeq) analysis. PBMCs from P2 and P4 (aged 29 and 17 years, respectively; P2 had had no unusually severe infections; P4 was in complete remission from TB and off all treatment) were either left unstimulated or were stimulated with heat-killed M.tb (HKMTb) for 6 hours and then subjected to scRNASeq. (A) Experimental design. (B) Clustering and cell-type annotation. (C) Marker gene expression. (D) Geneset enrichment analysis (GSEA). Genesets with FDR-adjusted P values < 0.05 in any of the leukocyte subsets tested in the LY9-deficient individuals relative to controls are shown. (E) Immune response enrichment analysis (IREA) (48). The activity of 86 cytokines was predicted in each leukocyte subset (Method). (F) ROC curves for IFN-γ activity. (G) Distributions of IFN-γ activity. The dots in the violin plot represent the mean values. (H) Expression levels of genes contributing to the predicted IFN-γ activity (mean log2FC > 0 and FDR-adjusted P value < 0.05) in classical monocytes. Only genes with a percentage of expression > 20% and a scaled mean expression > 1 in HKMTb-stimulated control cells are shown. (I) PBMC stimulation assay. PBMCs from P2, P3, and P4 (aged 29, 40, and 17 years, respectively), one NFAT1-deficient patient (50), and healthy controls were stimulated with the indicated reagents for 24 hours. Results from three experiments were compiled, with all technical replicates averaged. Some conditions were omitted for P3’s and NFAT-deficient cells due to limited sample availability. (J) Autologous T and B lymphocyte engagement assay. PBMCs from P2, P4 (aged 29 and 17, respectively), one NFAT1-deficient patient, and healthy controls were stimulated with blinatumomab (a bispecific antibody targeting CD3 and CD19 to induce immune synapses between autologous T and B lymphocytes) for 5 days. Results from eight experiments are compiled, with all technical replicates averaged. In I and J, bars represent the mean and SEM. Statistical significance was determined for the difference between all controls and LY9-deficient individuals. n.s., not significant; *, P < 0.05; **, P < 0.01 by unpaired Wilcoxon’s rank-sum tests. LPS, lipopolysaccharides; HKMTb, heat-killed M.tb lysate; PHA, phytohemagglutinin; P/I, PMA and ionomycin; BiTE, blinatumomab.
Figure 4.
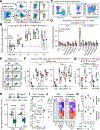
Figure 4.. Impaired IFN-γ production by LY9-deficient TH1* cells.
(A and B) BCG assay. PBMCs from P2, P3, and P4 (aged 29, 40, and 15 years, respectively; P2 had no unusually severe infections; P3 and P4 were in complete remission from TB and off all treatment), three IL-12Rβ1-deficient patients, three RORγT-deficient patients, and healthy donors were stimulated with live BCG mycobacteria with or without IL-12 or IL-23 for 48 hours. Secretion inhibitors were added for the last 8 hours, and IFN-γ production was quantified by flow cytometry. Results from four experiments were compiled, with P2, P3, and P4 tested on different occasions. No technical replicates were prepared. (A) IFN-γ-producing CD4+ αβ T lymphocytes. (B) Enrichment of IFN-γ-producing CD4+ αβ T lymphocytes within the T-bet+RORγT+ compartment. (C) IFN-γ and TNF production by TH1, TH2, TH17, and TH1* cells among the PBMCs of P2 and P3 (aged 29 and 40 years, respectively) and controls, as measured by intracellular flow cytometry after 6 hours of stimulation with secretion inhibitors. CytoStim (a bispecific antibody for TCRβ and HLA) was used to enhance the T-cell response regardless of the antigenic specificity. Results from four experiments were compiled, with all technical replicates averaged. (D-G) THP-1:CD4+ T-cell coculture assay. (D) Schematic diagram. (E) MACS-enriched CD4+ T-blasts were cocultured with THP-1 monocytic leukemia cells (undifferentiated) or THP-1-derived macrophage-like cells differentiated with PMA for 48 hours (P-Mφ). Results from three experiments were compiled, with cells from P2, P3, and P4 tested twice, with all technical replicates averaged. (F) Pharmacological RORγT inhibition. CD4+ T-blasts from healthy donors were cocultured with THP-1 cells and HKMTb for 18 hours with two RORγT inhibitors (GSK805 and XY108). Results from two experiments with different healthy controls were compiled. (G) MACS-enriched CD4+ T-blasts from P2, P3, and P4 lentivirally transduced with empty vector (EV) or WT LY9 were cocultured with THP-1 cells and the reagents indicated. The fold-change in secreted cytokine levels was determined by dividing cytokine levels in the presence of THP-1 cells by those in the absence of THP-1 cells. (H) LY9-knockout (KO) HuT78 T-lymphoma cells lentivirally transduced with EV or WT LY9 were cocultured with THP-1 cells and the reagents indicated. The fold change in secreted cytokine levels was calculated as in F. In A-C, E, and H, bars represent the mean and SEM. In A-C and E-G, n.s., not significant; *, P < 0.05; **, P < 0.01; ***, P < 0.001; ****, P < 1 × 10⁻⁴ by unpaired Wilcoxon’s rank-sum tests (A, the comparison between all controls and LY9-deficient individuals in B, C, and the comparisons between all controls and LY9-deficient individuals in E) or paired Wilcoxon signed-rank tests (the comparison of different subsets in controls in B, the comparison of different conditions in controls in E, F, and G). HKMTb, heat-killed M.tb lysate. P/I, PMA and ionomycin.
Figure 5.
Figure 5.. LY9 polarizes TCR-primed CD4+ αβ T lymphocytes to differentiate into TH1* cells by promoting the expression of T-bet and RORγT.
(A) Gating strategy for TH cells and TH-like naive CD4+ αβ T lymphocytes. (B) The number of canonical TH cells divided by the number of TH-like naïve CD4+ αβ T lymphocytes. The total memory/naive CD4+ T-cell ratio is also shown. (C and D) Naïve and memory CD4+ T lymphocytes sorted from the PBMCs of P3 (aged 40 years) and two healthy donors were cocultured with THP-1 or THP-1 plus HKMTb for 18 hours. (C) Sorting strategy. (D) The memory-to-naïve fold-change to assess the acquisition of cytokine-producing capacity in memory CD4+ T lymphocytes relative to their naïve counterparts from the same individual. The dashed horizontal line represents 1. (E and F) PBMCs from P2, P3, and P4 (aged 29, 40, and 17 years), P3’s travel control, and healthy controls were stimulated for 24 hours. (E) Representative plots for T-bet and RORγT in P3’s CD4+ αβ T lymphocytes. (F) The expression of T-bet and RORγT in CD4+ αβ T lymphocytes was quantified by flow cytometry. Results from three experiments were compiled, with all technical replicates averaged. (G) PBMCs from P2 and P4 (aged 29 and 17 years) and healthy controls were stimulated for 5 days with blinatumomab (anti-CD3-CD19 bispecific T-cell engager; BiTE). The expression of T-bet and RORγT in CD4+ αβ T lymphocytes was quantified by flow cytometry. Results from three experiments were compiled, with all technical replicates averaged. (H) Coculture assay with CD4+ T-blasts from two healthy donors and Raji cells with or without LY9 KO. The fold-change difference in MFI between non-stimulated and BiTE-stimulated conditions was calculated, with further normalization based on the data obtained without KO in either of the cell types cultured together. Four technical replicates were prepared for each of the CD4+ T-cell donors. Results from two experiments were compiled. (I-K) DNA methylation microarray analysis [healthy donors (N=8), P2, P3, and P4] and Omni-ATAC-seq analysis [healthy donors (N=4), P2, and P4] of MACS-enriched CD4+ T-blasts. Cells from one T-bet-deficient patient (T-blasts prepared on two different occasions as technical duplicates) and three RORγT-deficient patients were compared. See Methods for additional details. (I) Principal component analysis (PCA). (J) Heatmap analysis of CpG sites or chromatin regions governed by T-bet, RORγT, or both. (K) Overlap between LY9-dependent and T-bet- or RORγT-dependent sites or regions. In B, F, and G, bars represent the mean and SEM. In B, F, and H, n.s., not significant; *, P < 0.05; **, P < 0.01; ***, P < 0.001; ****, P < 1 × 10⁻⁴ by unpaired Wilcoxon’s rank-sum tests. HKMTb, heat-killed M.tb lysate; PHA, phytohemagglutinin; P/I, PMA and ionomycin; BiTE, blinatumomab.
Figure 6.
Figure 6.. LY9 costimulation enhances CD4+ T-cell IFN-γ production via NFAT1 and RORγT.
CD4+ T-blasts or HuT78 T-lymphoma cells were incubated with mock beads (beads without antibody) or beads conjugated with anti-CD3 and anti-LY9 mAbs or mIgG1 isotype control. P/I was used as a positive control. (A) IFN-γ production by HuT78 cells with or without LY9 KO and transduced with EV or a lentivirus carrying the WT LY9 sequence, as determined by flow cytometry. Four and six technical replicates were prepared for non-transduced and transduced cells, respectively. Representative results from two experiments. (B) IFNG mRNA levels in CD4+ T-blasts from controls, P2, P3, P4, and one SAP-deficient patient, as determined by RT-qPCR. Similarly, CD4+ T-blasts from P2, P3, and P4 lentivirally transduced with EV, WT LY9, or LY9 with Y603A/Y626A substitutions (abbreviated YY) were analyzed. Results from five experiments were compiled, with all technical replicates averaged. (C) IFN-γ production by CD4+ T-blasts from controls and from P4 lentivirally transduced with EV, WT LY9, or mutant LY9, as determined by flow cytometry. Results from three experiments were compiled. Technical replicates were prepared for P4’s transduced cells (N=8 for EV and WT; N=6 for G61Vfs*3 and H351Rfs*22 in total). (D) IFN-γ secretion by CD4+ T-blasts from controls, P2 and P4, and by CD4+ T-blasts from P2, P3, and P4 transduced with EV or WT LY9. Results from three experiments were compiled, with all technical replicates averaged. Non-transduced cells from P4 were tested twice. For P4’s cells, lentiviral transduction was conducted nine times as technical replicates. (E) Cytokine secretion by P4’s CD4+ T-blasts lentivirally transduced with EV, WT LY9, or biochemical mutants (N=10 for EV and WT; N=4 for YY; and N=3 for Y651F). Results from 10 experiments were compiled, with all technical replicates averaged. (F) LY9 or SH2D1A knockout (KO) in CD4+ T-blasts from two healthy donors. Cells were nucleofected with Cas9 and either scrambled sgRNA or sgRNA pools for LY9 and SH2D1A, expanded for 14 days, and restimulated for 2 hours in the presence of secretion inhibitors. The production of IFN-γ and TNF was assessed by flow cytometry. Technical duplicates were prepared for each sgRNA nucleofection. (G) Arrayed knockdown (KD) analysis. CD4+ T-blasts from two healthy donors with and without LY9 KO were transduced with a lentivirus carrying shRNA and selected with puromycin. For LY9 KO cells, LY9-negative cells was enriched by FACS. Two different scramble negative control (NC) shRNAs were tested and combined as “NC.”. Six technical replicates were prepared for each KD/KO. Representative results from two experiments. (H) Cytokine production by CD4+ T-blasts from controls, P2 (tested twice), P3, P4 (four times), one SAP-deficient patient (twice), one NFAT1-deficient patient (twice), and two RORγT-deficient patients, as measured by intracellular flow cytometry. Results from six experiments were compiled, with all technical replicates averaged. (I-K) RNASeq on CD4+ T-blasts from P2, P3, and P4 transduced with EV, WT LY9, or YY LY9. Geneset enrichment analysis (GSEA) was conducted on (I) transcription factor (TF) motifs, (J) Hallmark genesets, or (K) the T-helper signature genesets (68) (Method). Gray indicates non-significant results. In A-F and H, bars represent the mean and SEM. In A-E, G, and H, n.s., not significant; *, P < 0.05; **, P < 0.01; ***, P < 0.001; by unpaired Wilcoxon’s rank-sum tests. P/I, PMA and ionomycin.

References

    1. Bloom BR, A half-century of research on tuberculosis: Successes and challenges. J. Exp. Med. 220, e20230859 (2023). - PMC - PubMed
    1. WHO, Global Tuberculosis Report 2022 (2022).
    1. Vynnycky E, Fine PEM, Lifetime Risks, Incubation Period, and Serial Interval of Tuberculosis. Am. J. Epidemiol. 152, 247–263 (2000). - PubMed
    1. Kallmann FJ, Reisner D, Twin Studies on the Significance of Genetic Factors in Tuberculosis,. Am. Rev. Tuberc. 47, 549–574 (1943).
    1. Comstock GW, Tuberculosis in twins: a re-analysis of the Prophit survey. Am. Rev. Respir. Dis. 117, 621–4 (1978). - PubMed

Publication types

MeSH terms

Substances