. 2025 May 30;11(22):eadt7176.
doi: 10.1126/sciadv.adt7176. Epub 2025 May 30.

Proteomic signatures of corona and herpes viral antibodies identify IGDCC4 as a mediator of neurodegeneration

Affiliations

Proteomic signatures of corona and herpes viral antibodies identify IGDCC4 as a mediator of neurodegeneration

Michael R Duggan et al. Sci Adv. .

Abstract

Mechanisms underlying the dynamic relationships of viral infections and neurodegeneration warrant examination. Using a community-based cohort of older adults, the current study characterized the neurocognitive (cognitive functioning, brain volumes, Alzheimer's disease positron emission tomography, and plasma biomarkers) and plasma proteomic (7268 proteins) profiles of four common coronavirus and six herpesvirus antibody titers. Genetic inference techniques demonstrated the associations between viral antibody titers and neurocognitive outcomes may be attributed to altered expression in a subset of mechanistically relevant proteins in plasma. One of these proteins, IGDCC4 (immunoglobulin superfamily deleted in colorectal cancer subclass member 4), was related to 20-year dementia risk, cognitive functioning, and amyloid-β positivity using data from two independent cohorts, while its plasma and intrathecal abundance were causally implicated in dementia risk and clinically relevant brain atrophy. Our findings illuminate the biological basis by which host immune responses to viruses may affect neurocognitive outcomes in older adults and identify IGDCC4 as an important molecular mediator of neurodegeneration.


Figures

Fig. 1.
Fig. 1.. Study design.
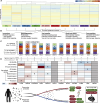
(A) Titers of coronavirus and herpesvirus antibodies were measured in BLSA participants. Viral titers were associated with prevalent dementia, cognitive performance across five domains, regional brain volumes, ADRD plasma and PET biomarkers, and the plasma proteome (SomaScan; 7268 proteins). (B) Two-sample MR examined evidence for a causal link of viral titer–related plasma proteins with dementia risk and clinically relevant brain atrophy. (C) Candidate plasma proteins were associated with cognitive performance in the Generation Scotland (GenS) study, 20-incident dementia risk and odds of Aβ+ PET status in the Atherosclerosis Risk in Communities (ARIC) study, as well as etiology specific dementia risk in the UK Biobank (UKB). (D) The biological implications and functional relevance of candidate plasma proteins were assessed using multiple complementary analytic tools and open-source databases. Created in BioRender. Duggan, M. (2025) https://BioRender.com/hxnxsb2.
Fig. 2.
Fig. 2.. Antibody titer associations with dementia, cognitive performance, and brain volumes in BLSA.
(A) Forest plot shows the associations of viral antibody titers with odds of dementia between control (cognitively normal, Aβ−; n = 98) and dementia (n = 91) participants. Cumulative burden indices reflected the percentage of coronavirus, herpesvirus, and total (coronavirus and herpesvirus) titer measurements in the top tertile. Red shapes indicate P < 0.05. Results were derived from logistic regression models adjusting for age, sex, race, education, APOEε4, sample storage time, and a comorbidity index. OR, odds ratio. (B) Box plots (and corresponding density plots along y axes) show the distributions of HCoV-OC43 and CMV (IgM) titers between control and dementia participants. Results were derived from logistic regression models adjusting for the aforementioned covariates. (C) Forest plot shows antibody titer tertiles associated with odds of dementia between control and dementia participants. Results were derived from logistic regression models adjusting for the aforementioned covariates. Red shapes indicate P < 0.05. (D) Rose plots show the relationships of antibody titers with performance across five cognitive domains among all participants (n = 323). Results were derived from linear regression models adjusting for the aforementioned covariates. (E) A heatmap shows differences in regional brain volumes associated with antibody titers among participants with available 3-T MRI (n = 223). Results were derived from linear regression models adjusting for the aforementioned covariates plus intracranial volume. *P < 0.05.
Fig. 3.
Fig. 3.. Antibody titer associations with ADRD biomarkers in BLSA.
(A) Box plots (and corresponding density plots along y axes) show the distributions of HCoV-OC43 and CMV (IgM) titers between Aβ− (n = 99) and Aβ+ (n = 73) PET participants. Results were derived from logistic regression models adjusting for age, sex, race, education, APOEε4, sample storage time, and a comorbidity index. Among Aβ+ participants, scatterplots show the associations of CMV (IgG) with (B) mean cortical Aβ levels and (C) estimated age of Aβ+ onset. Results were derived from linear regression models adjusting for the aforementioned covariates. (D) Jitter plots show associations of antibody titers with regional tau PET levels (n = 36). Results were derived from linear regression models adjusting for age, sex, amyloid PET status, and a comorbidity index. Titers that showed the strongest and weakest associations with tau levels are labeled, with red color indicating P < 0.05. (E) Scatterplot shows the association of EBV (EBNA) with plasma Aβ42/40 (n = 258). Results were derived from linear regression models adjusting for age, sex, race, education, APOEε4, sample storage time, estimated glomerular filtration rate (eGFR), and a comorbidity index. Forest plots show antibody titer tertiles associated with (F) plasma Aβ42/40 (n = 258) and (G) plasma pTau-181 (n = 202). Results were derived from linear regression models adjusting for the aforementioned covariates. Red shapes indicate P < 0.05.
Fig. 4.
Fig. 4.. Antibody titer associations with the plasma proteome in BLSA and two-sample MR.
(A) Heatmap shows differences in the plasma proteome (SomaScan; 7268 proteins) associated with antibody titers (n = 323). Dendrogram reflects hierarchical clustering using Euclidean distances. Results were derived from linear regression models adjusting for age, sex, race, education, APOEε4, sample storage time, eGFR, and a comorbidity index. (B) Summary of enriched biological processes in the plasma proteomic signatures (P < 0.05) of antibody titers. Results were derived from ingenuity pathway analysis. cGAS-STING, cyclic GMP-AMP synthase - stimulator of interferon genes. (C) A clustered bar graph shows plasma proteins associated with five or more antibody titers (P < 0.05). (+) and (−) indicate higher or lower protein levels were associated with a given titer. # indicates an association that survived FDR correction. (D) A modified heatmap shows the results of two-sample MR analyses that assessed the relationships of genetically determined plasma protein levels with genetic susceptibility for neurocognitive outcomes, along with a corresponding graphic summarizing these findings. Protein quantitative trait loci (pQTLs) were obtained from deCODE Genetics. AD GWAS was obtained from European Alzheimer & Dementia Biobank (EADB) and FinnGen, all-cause dementia (ACD) GWAS was obtained from FinnGen, and neuroimaging signature GWAS was obtained from the UKB. *P < 0.05. Created in BioRender. Duggan, M. (2025) https://BioRender.com/u8a6ebo.
Fig. 5.
Fig. 5.. IGDCC4 associations with neurocognitive outcomes in external cohorts and biological characterization.
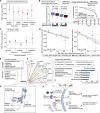
(A) Forest plot shows plasma IGDCC4 associations with cognitive performance in the GenS cohort (n = 1065). Results were derived from linear mixed-effects regression models adjusting for kinship matrix, age, sex, depression diagnosis, clinic study site, and sample storage time. Orange color indicates P < 0.05. (B) Box plots show IGDCC4 distributions measured at visit 2 (n = 260) and visit 5 (n = 272) across participants with differing Aβ PET status at visit 5 in the ARIC study. A Kaplan-Meier plot shows the observed 20-year dementia event-free probabilities grouped according to upper/lower IGDCC4 quartiles (n = 11,596). HR reflects the association with continuous protein measurements. Results were derived from logistic or Cox regression models adjusting for age, sex, race-center, education, APOEε4, eGFR, and cardiovascular risk factors. (C) Forest plot shows the associations of IGDCC4 with 14-year risk of dementia in the UKB (n = 41,344). Results were derived from Cox regression models adjusting for age, sex, study site, education, APOEε4, eGFR, and cardiovascular risk factors. (D) Scatterplots show two-sample MR results that assessed the relationships of genetically determined IGDCC4 protein levels in CSF with genetic susceptibility for ACD and age-related medial temporal atrophy. pQTLs were obtained from WashU. ACD GWAS was obtained from FinnGen, and neuroimaging signature GWAS was obtained from the UKB. (E) Top-five cell and tissue types with the highest IGDCC4 expression. Transcriptomics data were sourced from the Human Protein Atlas. (F) IGDCC4 protein-protein interaction (PPI) network and corresponding enriched biological process and cell types for this network. Results were derived from the STRING and PanglaoDB. (G) Predicted conformation of IGDCC4; domains are labeled with corresponding amino acid sequences. Image sourced from AlphaFold. (H) Working model of IGDCC4’s potential cellular mechanisms underlying its relationships with viral infections and neurocognitive outcomes. Created in BioRender. Duggan, M. (2025) https://BioRender.com/4hiujxt.

References

    1. Bettcher B. M., Tansey M. G., Dorothée G., Heneka M. T., Peripheral and central immune system crosstalk in Alzheimer disease - A research prospectus. Nat. Rev. Neurol. 17, 689–701 (2021). - PMC - PubMed
    1. Walker K. A., Le Page L. M., Terrando N., Duggan M. R., Heneka M. T., Bettcher B. M., The role of peripheral inflammatory insults in Alzheimer’s disease: A review and research roadmap. Mol. Neurodegener. 18, 37 (2023). - PMC - PubMed
    1. Duggan M. R., Peng Z., An Y., Kitner Triolo M. H., Shafer A. T., Davatzikos C., Erus G., Karikkineth A., Lewis A., Moghekar A., Walker K. A., Herpes viruses in the Baltimore Longitudinal Study of Aging: Associations with brain volumes, cognitive performance, and plasma biomarkers. Neurology 99, e2014–e2024 (2022). - PMC - PubMed
    1. Sipilä P. N., Heikkilä N., Lindbohm J. V., Hakulinen C., Vahtera J., Elovainio M., Suominen S., Väänänen A., Koskinen A., Nyberg S. T., Pentti J., Strandberg T. E., Kivimäki M., Hospital-treated infectious diseases and the risk of dementia: A large, multicohort, observational study with a replication cohort. Lancet Infect. Dis. 21, 1557–1567 (2021). - PMC - PubMed
    1. Muzambi R., Bhaskaran K., Smeeth L., Brayne C., Chaturvedi N., Warren-Gash C., Assessment of common infections and incident dementia using UK primary and secondary care data: A historical cohort study. Lancet Healthy Longev. 2, e426–e435 (2021). - PMC - PubMed