. 2025 Jul;301(7):110304.
doi: 10.1016/j.jbc.2025.110304. Epub 2025 May 28.

Mannose-modified hemocyanin enhances pathogen endocytosis by crustacean hemocytes

Affiliations

Mannose-modified hemocyanin enhances pathogen endocytosis by crustacean hemocytes

Jiaxi Li et al. J Biol Chem. 2025 Jul.

Abstract

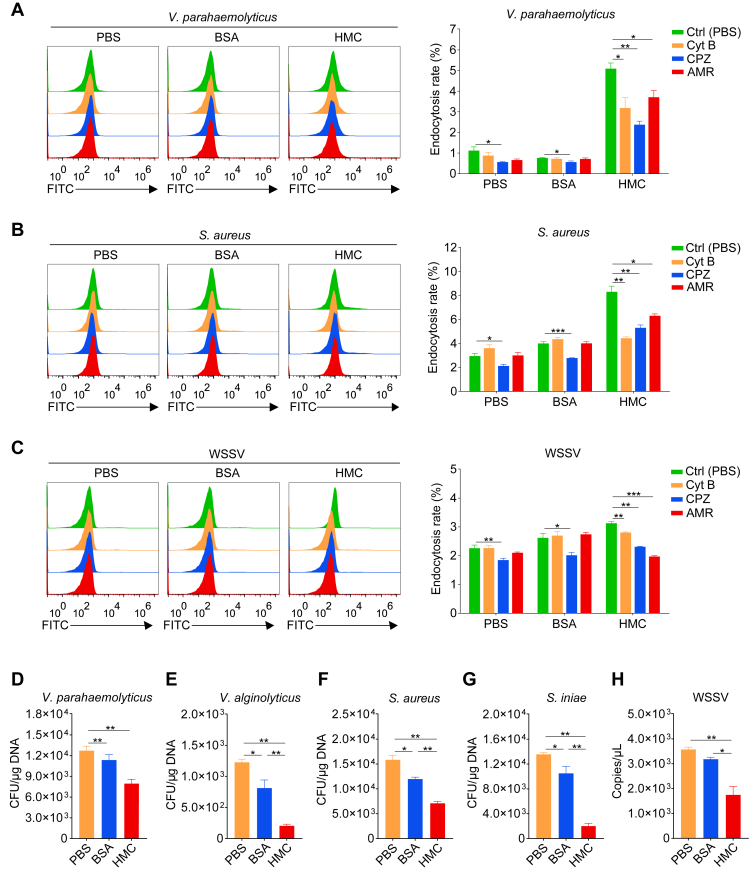
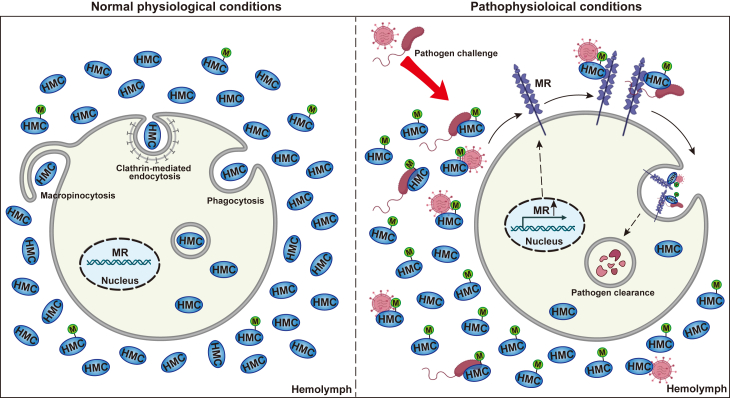
In crustaceans, hemolymph plasma contains more than 90% hemocyanin, whereas hemocytes have minimal levels, suggesting a regulated uptake mechanism. Here, we demonstrate that in Penaeus vannamei, hemocytes internalize plasma hemocyanin under normal conditions via phagocytosis, clathrin-mediated endocytosis, and micropinocytosis. This uptake is significantly enhanced during bacterial (Vibrio parahaemolyticus, Vibrio alginolyticus, Staphylococcus aureus, Streptococcus iniae) and viral (White spot syndrome virus) infections or upon stimulation with pathogen-associated molecular patterns. While post-translational modifications (PTMs) such as dephosphorylation, deacetylation, and mannosylation enhance hemocyanin's pathogen-binding affinity, only mannosylation promotes mannose receptor-mediated endocytosis for intracellular clearance, whereas dephosphorylation and deacetylation facilitate extracellular pathogen elimination. These findings reveal that hemocyanin functions beyond oxygen transport, acting as an immune effector that undergoes PTMs to enhance intracellular pathogen clearance.

Keywords: cellular immune response; crustaceans; endocytosis; hemocyanin; invertebrate; membrane trafficking; post-translational modification (PTM); protein translocation; receptor endocytosis.


Conflict of interest statement

Conflict of interest The authors declare that they have no conflicts of interest with the contents of this article.

Figures

Figure 1
Figure 1
Hemocytes internalize plasma hemocyanin. A, Western blot analysis of hemocyanin (HMC) levels in diluted plasma and hemocyte lysates (top), with relative band intensity quantified using ImageJ (bottom). B, relative HMC protein expression in plasma and hemocytes determined by spectrophotometry. C, confocal microscopy images showing endocytosis of FITC-labeled hemocyanin (FITC-HMC) and FITC-labeled bovine serum albumin (FITC-BSA) by hemocytes. Scale bar = 10 μm. Nuclei stained with Hoechst 33,342 (blue). Mean fluorescence intensity was quantified using ImageJ. D, Representative 3D reconstruction of internalized FITC-HMC. Scale bar = 5 μm. E, relative endocytosis of FITC-HMC and FITC-BSA by hemocytes analyzed via Flow cytometry, quantified using FlowJo. F, endocytosis of FITC-HMC and FITC-BSA in hemocytes after in vivo treatment. G, Time-course analysis (2, 4, 6, and 8 h) of FITC-HMC and FITC-BSA uptake following in vivo treatment. H, confocal images of hemocytes internalizing EGFP, recombinant hemocyanin subunit 1 (rHMC-subunit 1), and subunit 2 (rHMC-subunit 2). Scale bar = 2 μm. Nuclei stained with Hoechst 33,342 (blue). Mean fluorescence intensity was quantified using ImageJ. I, relative endocytosis of EGFP, rHMC-subunit 1, and rHMC-subunit 2 by hemocytes, analyzed via flow cytometry and quantified using FlowJo. Results are presented as mean ± SEM (n = 3). ∗p < 0.05, ∗∗p < 0.01, ∗∗∗p < 0.001 vs. control. Error bars represent S.E. Immunoblots and microscopy images are representative of at least three independent experiments. BSA, bovine serum albumin; EGFP, enhanced green fluorescent protein; FITC-BSA, FITC-labeled bovine serum albumin; FITC-HMC, FITC-labeled hemocyanin, HMC, hemocyanin; rHMC-subunit 1, EGFP-labeled recombinant hemocyanin subunit 1; rHMC-subunit 2, EGFP-labeled recombinant hemocyanin subunit 2.
Figure 2
Figure 2
Hemocyanin uptake occurs via multiple endocytic pathways.A, confocal microscopy images showing endocytosis of FITC-HMC by (A) shrimp hemocytes following treatment with endocytosis inhibitors: cytochalasin B (Cyt B, actin-dependent phagocytosis inhibitor), chlorpromazine (CPZ, clathrin-mediated endocytosis inhibitor), amiloride (AMR, macropinocytossis inhibitor), genistein (GEN, caveolae-mediated endocytosis inhibitor), and methyl-β-cyclodextrin (MβCD, lipid raft inhibitor). PBS treatment served as the control. Scale bar = 10 μm. Nuclei were stained with Hoechst 33,342 (blue). Mean fluorescence intensity was quantified using ImageJ. B, relative endocytosis of FITC-HMC in shrimp hemocytes treated with inhibitors (Cyt B, CPZ, AMR, GEN, and MβCD), or PBS as control, analyzed by flow cytometry and quantified using FlowJo. C, confocal microscopy images showing endocytosis of FITC-HMC by Drosophila S2 cells following treatment with endocytosis inhibitors (Cyt B, CPZ, AMR, GEN, and MβCD). PBS treatment served as the control. Scale bar = 10 μm. Nuclei were stained with Hoechst 33,342 (blue). Mean fluorescence intensity was quantified using ImageJ. D, relative endocytosis of FITC-HMC in Drosophila S2 cells treated with inhibitors (Cyt B, CPZ, AMR, GEN, and MβCD), or PBS as control, analyzed by flow cytometry and quantified using FlowJo. Results presented as mean ± SEM (n = 3). ∗p < 0.05, ∗∗p < 0.01, ∗∗∗p < 0.001 vs. control. Error bars represent S.E. Microscopy images are representative of at least three independent experiments. FITC-HMC, FITC-labeled hemocyanin; HMC, hemocyanin.
Figure 3
Figure 3
Hemocyanin enhances the endocytosis of microbial pathogens. A-E, relative shrimp hemocytes endocytosis of DiL-labeled (A) Vibrio parahaemolyticus, (B) V. alginolyticus, (C) Staphylococcus aureus, (D) Streptococcus iniae), and (E) White spot syndrome virus (WSSV) pre-incubated with varying concentration (0, 14, 70, and 350 nM) of FITC-HMC or FITC-BSA, analyzed by flow cytometry and quantified using FlowJo. F, Western blot and SDS-PAGE analysis of hemocyanin binding with V. parahaemolyticus, V. alginolyticus, S. aureus, and S. iniae. G, Western blot and SDS-PAGE analysis of hemocyanin binding with WSSV. H-L, Relative hemocytes endocytosis of DiL-labeled (H) V. parahaemolyticus, (I) V. alginolyticus, (J) S. aureus, (K) S. iniae, and (L) WSSV following injection of shrimp with 350 nM FITC-HMC or FITC-BSA pretreatment (for bacteria) and 70 nM FITC-HMC or FITC-BSA (for WSSV), analyzed by flow cytometry. Results presented as mean ± SEM (n = 3). ∗p < 0.05, ∗∗p < 0.01, ∗∗∗p < 0.001 vs. control. Error bars represent S.E. Immunoblot images are representative of at least three independent experiments. BSA, bovine serum albumin; FITC-BSA, FITC-labeled bovine serum albumin; FITC-HMC, FITC-labeled hemocyanin; HMC, hemocyanin.
Figure 4
Figure 4
Hemocyanin enhances microbial clearance by hemocytes. A-C, relative shrimp hemocytes endocytosis of DiL-labeled (A) Vibrio parahaemolyticus, (B) Staphylococcus aureus, and (C) white spot syndrome virus (WSSV) pre-incubated with hemocyanin (HMC) or bovine serum albumin (BSA) treated with endocytosis inhibitors (Cyt B, CPZ, and AMR), and analyzed by flow cytometry. D-H, quantification of microbial loads in shrimp hemolymph using real-time PCR following injection with (D) V. parahaemolyticus, (E) V. alginolyticus, (F) S. aureus, (G) Streptococcus iniae, and (H) WSSV pre-incubated with HMC or BSA. Results are presented as mean ± SEM (n = 3). ∗p < 0.05, ∗∗p < 0.01, ∗∗∗p < 0.001 vs. control. Error bars represent S.E. BSA, Bovine serum albumin; HMC, hemocyanin.
Figure 5
Figure 5
Mannose receptor mediates hemocyanin endocytosis. A, microscopy images showing hemocytes that have endocytosed FITC-labeled hemocyanin with different post-translational modifications: control hemocyanin (HMC-Con), deacetylated hemocyanin (HMC-deAc), dephosphorylated hemocyanin (HMC-dePhos), and demannosylated hemocyanin (HMC-deMan), as observed via laser confocal microscopy. Scale bar = 5 μm. Nuclei are stained with Hoechst 33,342 (blue). Mean fluorescence intensity was quantified using ImageJ. B, mRNA expression of the mannose receptor (MR) in hemocytes following dsRNA-mediated knockdown of MR. dsRNA targeting EGFP was used as a control. C, microscopy images of hemocytes showing FITC-HMC endocytosis after MR knockdown. Scale bar = 5 μm. Nuclei are stained with Hoechst 33,342 (blue). Mean fluorescence intensity was quantified using ImageJ. D, relative endocytosis of FITC-HMC by hemocytes following MR knockdown, as determined by flow cytometry. Uptake rates were quantified using FlowJo software. E, microscopy images of FITC-HMC endocytosis by hemocytes pre-treated with 4, 6, or 8 mM Ca2+ or 8 mM Ca2+ with 4 mM EDTA. Scale bar = 5 μm. Nuclei are stained with Hoechst 33,342 (blue). Mean fluorescence intensity was quantified using ImageJ. F, microscopy images of FITC-HMC endocytosis by hemocytes after pre-treatment with 1, 3, 6, or 9 mg/ml of mannan. Scale bar = 2 μm. Nuclei are stained with Hoechst 33,342 (blue). Mean fluorescence intensity was quantified using ImageJ. G, microscopy images showing hemocytes that have endocytosed FITC-labeled HMC-Con and HMC-deMan. Scale bar = 2 μm. Nuclei are stained with Hoechst 33,342 (blue). Results are presented as mean ± SEM (n = 3). ∗p < 0.05, ∗∗p < 0.01, ∗∗∗p < 0.001 vs. control. Error bars represent S.E.
Figure 6
Figure 6
Mannose receptor regulates hemocyanin-mediated microbial endocytosis. A, Western blot analysis of plasma hemocyanin mannose modification at different time points post-infection with V. parahaemolyticus, S. aureus, and WSSV, with PBS as a control. B, relative endocytosis of FITC-labeled V. parahaemolyticus, S. aureus, and WSSV pre-incubated with HMC-Con, HMC-deMan, or PBS by shrimp hemocytes, as determined by flow cytometry. C, mRNA expression of MR in hemocytes at different time points (0, 6, 12, 24, 48, and 72 h) post-challenge with V. parahaemolyticus, S. aureus, and WSSV. D-F, relative endocytosis of FITC-labeled (D) V. parahaemolyticus, (E) S. aureus, and (F) WSSV by shrimp hemocytes following MR knockdown, as determined by flow cytometry. G, relative endocytosis of FITC-labeled V. parahaemolyticus, S. aureus and WSSV pre-incubated with HMC-Con or HMC-deMan by hemocytes following MR knockdown, as determined by flow cytometry. Results are presented as mean ± SEM (n = 3). ∗p < 0.05, ∗∗p < 0.01, ∗∗∗p < 0.001 vs. control. Error bars represent S.E. Immunoblots are representative of at least three independent experiments. BSA, bovine serum albumin; EGFP, enhanced green fluorescent protein; HMC, hemocyanin; HMC-Con, control hemocyanin; HMC-deMan, demannosylated hemocyanin; MR, mannose receptor.
Figure 7
Figure 7
Plasma hemocyanin enters hemocytes and enhances microbial endocytosis. Under physiological conditions, shrimp hemocytes internalize extracellular plasma hemocyanin via phagocytosis, clathrin-mediated endocytosis, and macropinocytosis. However, under pathological conditions, hemocyte surface mannose receptors (MR) are upregulated, promoting mannose modification of hemocyanin. This enhances hemocyanin uptake and enables its interaction with microbial pathogens, facilitating their endocytosis for intracellular clearance.

Similar articles

References

    1. Buchmann K. Evolution of innate immunity: clues from invertebrates via fish to mammals. Front. Immunol. 2014;5:459. - PMC - PubMed
    1. Huang Y., Ren Q. Research progress in innate immunity of freshwater crustaceans. Dev. Comp. Immunol. 2020;104 - PubMed
    1. Mydlarz L.D., Jones L.E., Harvell C.D. Innate immunity environmental drivers and disease ecology of marine and freshwater invertebrates. Annu. Rev. Ecol. Evol. Syst. 2006;37:251–288.
    1. Osta M.A., Christophides G.K., Vlachou D., Kafatos F.C. Innate immunity in the malaria vector Anopheles gambiae:comparative and functional genomics. J. Exp. Biol. 2004;207:2551–2563. - PubMed
    1. Watson F.L., Püttmann-Holgado R., Thomas F., Lamar D.L., Hughes M., Kondo M., et al. Extensive diversity of Ig-superfamily proteins in the immune system of insects. Science. 2005;309:1874–1878. - PubMed

LinkOut - more resources