. 2025 Jun 18;45(25):e1007242025.
doi: 10.1523/JNEUROSCI.1007-24.2025.

Developmental Olfactory Dysfunction and Abnormal Odor Memory in Immune-Challenged Disc1+/- Mice

Affiliations

Developmental Olfactory Dysfunction and Abnormal Odor Memory in Immune-Challenged Disc1+/- Mice

Fiona Parbst et al. J Neurosci. .

Abstract

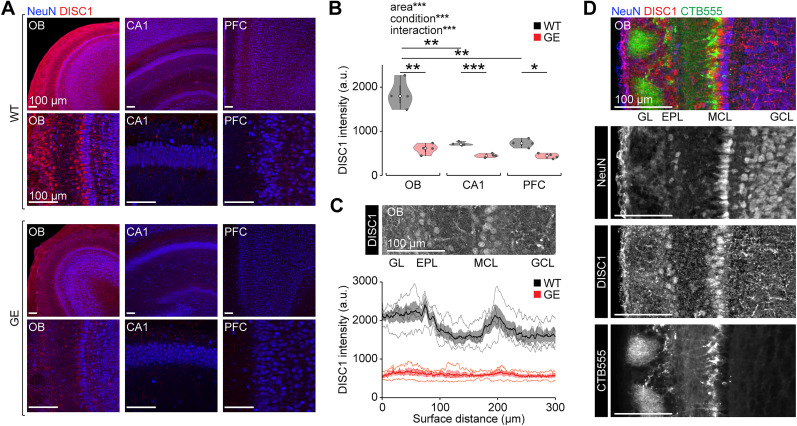
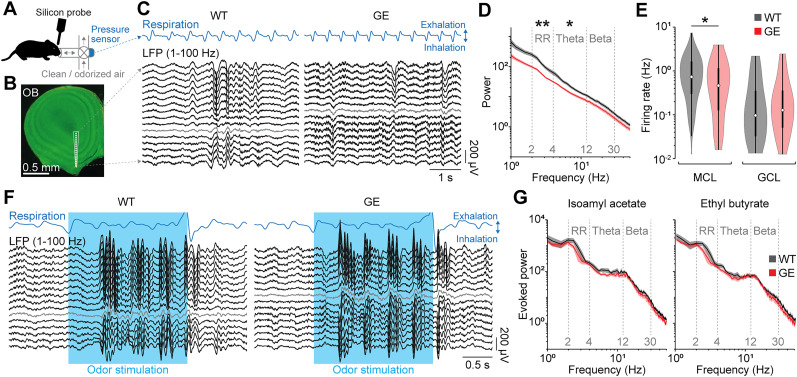
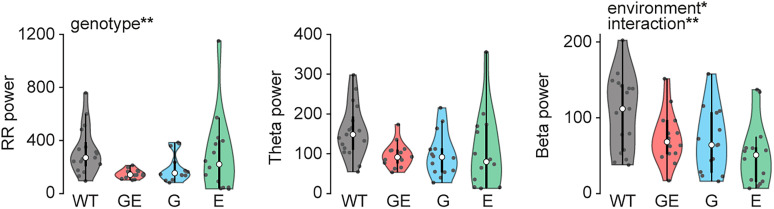
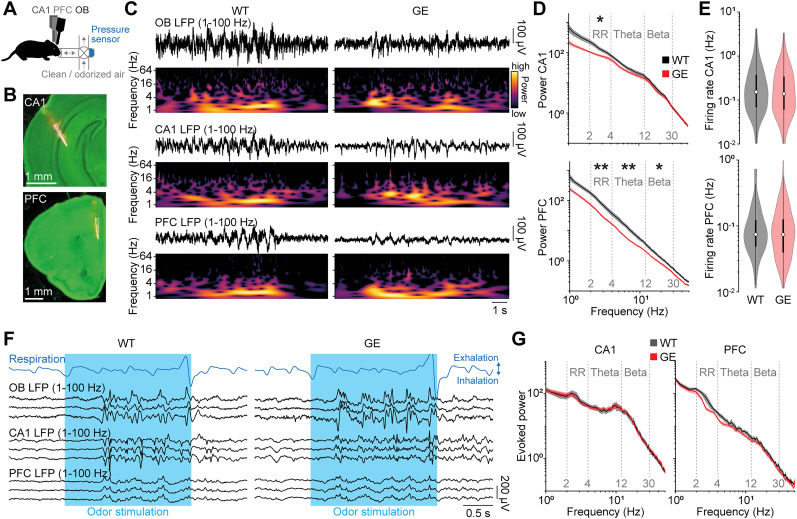
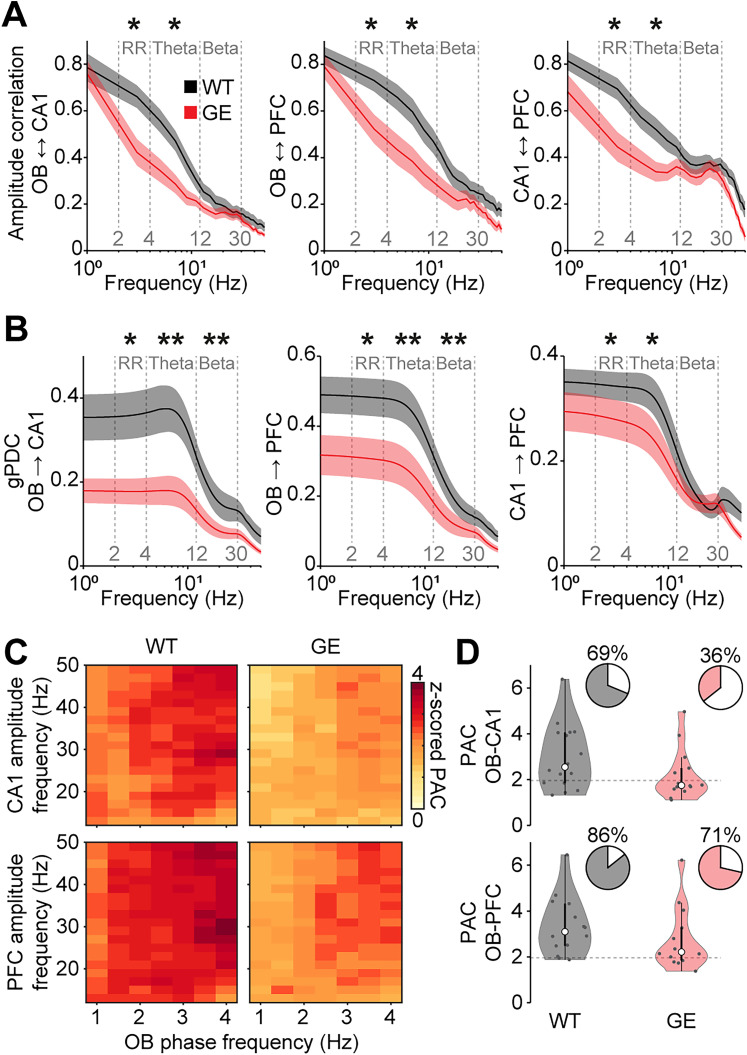
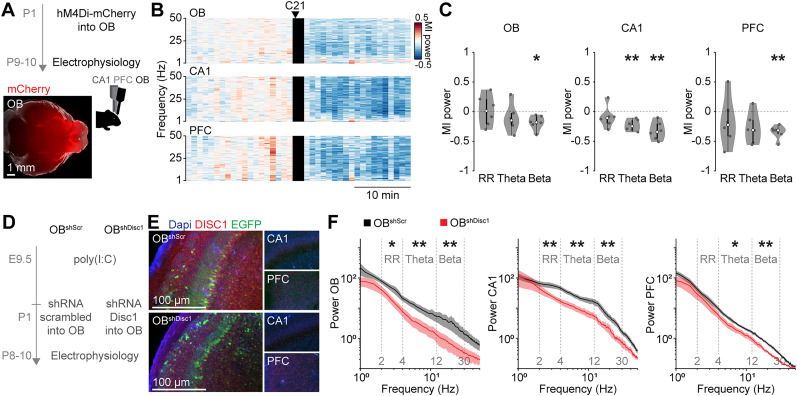
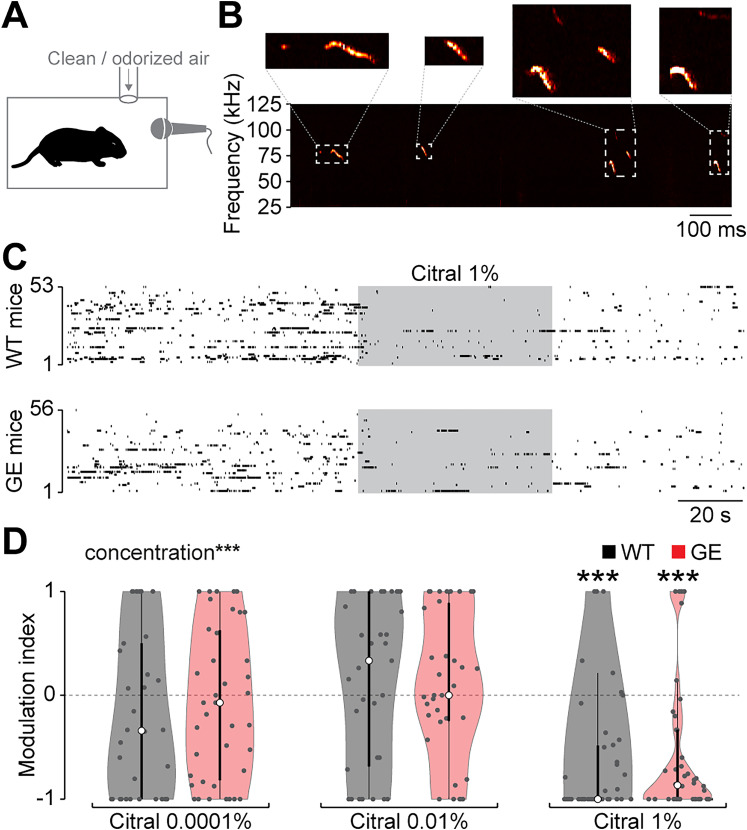
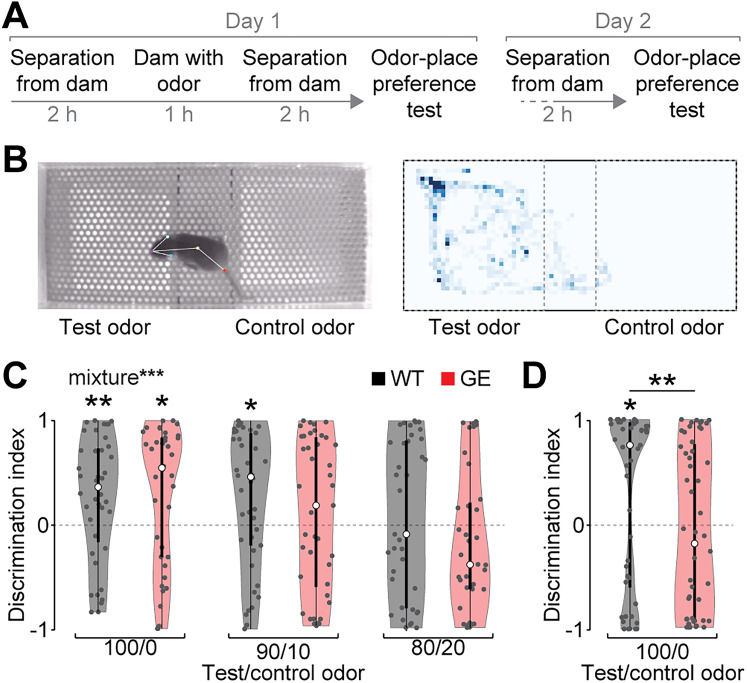
Neuronal activity in the olfactory bulb (OB) drives coordinated activity in the hippocampal-prefrontal network during early development. Inhibiting OB output in neonatal mice disrupts functional development of the hippocampal formation as well as cognitive abilities. These impairments manifest early in life and resemble dysfunctions of the hippocampus and the prefrontal cortex that have been linked to neuropsychiatric disorders. Thus, we investigated OB activity during early development in a disease mouse model and asked whether activity disruptions might contribute to the dysfunctional development of the hippocampal-prefrontal network. We addressed this question by combining in vivo electrophysiology with behavioral assessment of immune-challenged Disc1+/- mice of both sexes that mimic the dual genetic-environmental etiology of neuropsychiatric disorders. In wild-type mice, we found high DISC1 expression levels in OB projection neurons during development. Furthermore, neuronal and network activity in the OB and the drive from the bulb to the hippocampal-prefrontal network were reduced in immune-challenged Disc1+/- mice during early development. This early deficit did not affect odor-evoked activity and odor perception but resulted in impaired long-term odor memory. We propose that reduced spontaneous activity in the developing OB might contribute to altered maturation of the hippocampal-prefrontal network, leading to memory impairment in immune-challenged Disc1+/- mice.

Keywords: Disc1; development; hippocampus; neuropsychiatric; olfaction; prefrontal cortex.


Conflict of interest statement

The authors declare no competing financial interests.

Figures

Figure 1.
Figure 1.
Strong expression of DISC1 in OB projection neurons at P10. A, Coronal sections of OB, CA1, and PFC from P10 WT (top) and GE (bottom) mice immunostained for NeuN (blue) and DISC1 (red) at low and high magnification. Slices from different areas were stained in parallel and images were acquired with identical settings. B, Fluorescence intensity of DISC1 immunolabeling in OB, CA1, and PFC in P9–10 WT (n = 4) and GE (n = 4) mice. Two-way ANOVA revealed significant effects of animal condition (F(1) = 97.7; p = 1.07 × 10−8), area (F(2) = 49.2; p = 5.03 × 10−8), and their interaction (F(2) = 28.0; p = 2.97 × 10−6). C, Top, Coronal section of OB from a P10 WT mouse immunostained for DISC1. Bottom, spatially resolved DISC1 intensity in P9–10 WT (n = 4) and GE (n = 4) mice. D, Coronal section of OB from a P10 WT mouse immunostained for DISC1 with OB projection neurons labeled by injection of the retrograde tracer CTB555 into the piriform cortex. Shaded areas in C correspond to SEM. Significant differences are indicated as *, **, and *** for p < 0.05, 0.01, and 0.001, respectively. GL glomerular layer; EPL external plexiform layer; MCL mitral cell layer; GCL granule cell layer.
Figure 2.
Figure 2.
Reduced spontaneous, but normal odor-evoked activity in the OB of immune-challenged Disc1+/− mice at P8–10. A, Experimental setup for recordings of spontaneous and respiration-triggered odor–evoked activity in the OB of P8–10 mice. B, Example coronal section with a reconstruction of the DiI-labeled silicon probe tip in the ventral OB. C, Example extracellular recording of spontaneous activity from the ventral OB of a P10 WT and GE mouse using a silicon probe with 16 recording sites spanning across the MCL (gray). Down- and upward deflections on the respiration trace from the pressure sensor indicate inhalation and exhalation, respectively. D, Power spectra of spontaneous OB activity in P8–10 WT (n = 17) and GE (n = 14) mice. E, The firing rate of spontaneous OB activity in P8–10 WT and GE mice for units recorded in MCL (WT n = 172; GE n = 49 units) and GCL (WT n = 55; GE n = 38 units). F, Same as C for odor-evoked activity. G, Power spectra of odor-evoked OB activity in P8–10 WT (n = 11) and GE (n = 11) mice. Shaded areas in D and G correspond to SEM. Significant differences are indicated as *, **, and *** for p < 0.05, 0.01, and 0.001, respectively.
Figure 3.
Figure 3.
Distinct patterns of spontaneous OB activity in Disc1+/− and in immune-challenged mice at P8–10. Power of spontaneous OB activity quantified in different frequency bands (left, RR; middle, theta; right, beta) in P8–10 WT (n = 17), GE (n = 14), G (n = 14), and E (n = 14) mice. For RR power, two-way ANOVA revealed a significant effect of genotype (F(1) = 8.05; p = 6.4 × 10−3). For theta power, two-way ANOVA revealed no significant effects, with the effect of genotype being close to significance (F(1) = 3.71; p = 0.059). For beta power, two-way ANOVA revealed significant effects of environment (F(1) = 5.01; p = 0.029) and the interaction of genotype and environment (F(1) = 7.6; p = 7.9 × 10−3). Significant differences are indicated as *, **, and *** for p < 0.05, 0.01, and 0.001, respectively.
Figure 4.
Figure 4.
Reduced activity in the hippocampal–prefrontal network in immune-challenged Disc1+/− mice at P8–10. A, Experimental setup for triple recordings of spontaneous and respiration-triggered odor–evoked activity in OB, CA1, and PFC of P8–10 mice. B, Example coronal sections with a reconstruction of the DiI-labeled silicon probe tips in CA1 of the intermediate hippocampus (top) and the medial part of the PFC (bottom). C, Examples of spontaneous LFP activity recorded simultaneously from OB, CA1, and PFC of a P10 WT and GE mouse and the corresponding wavelet spectra. D, Power spectra of spontaneous CA1 and PFC activity in P8–10 WT (CA1 n = 15; PFC n = 14) and GE (CA1 n = 14; PFC n = 14) mice. E, The firing rate of spontaneous CA1 and PFC single unit activity in P8–10 WT (CA1 n = 270; PFC n = 167 units) and GE (CA1 n = 182; PFC n = 153 units) mice. F, Examples of odor-evoked LFP activity recorded simultaneously from OB, CA1, and PFC of a P10 WT and GE mouse. G, Power spectra of odor-evoked CA1 and PFC activity in P8–10 WT (n = 11) and GE (n = 11) mice. Shaded areas in D and G correspond to SEM. Significant differences are indicated as *, **, and *** for p < 0.05, 0.01, and 0.001, respectively.
Figure 5.
Figure 5.
Reduced drive of the hippocampal–prefrontal network in immune-challenged Disc1+/− mice at P8–10. A, Frequency-resolved amplitude correlation between OB-CA1 (WT n = 16; GE n = 14), OB-PFC (WT n = 14; GE n = 14), and CA1-PFC (WT n = 13; GE n = 14) for P8–10 WT and GE mice. B, Frequency-resolved gPDC from OB to CA1 (WT n = 16; GE n = 14), from OB to PFC (WT n = 14; GE n = 14), and from CA1 to PFC (WT n = 13; GE n = 14) for P8–10 WT and GE mice. C, Color-coded average PAC of CA1 (WT n = 16; GE n = 14) and PFC (WT n = 14; GE n = 14) LFP amplitude at fast frequencies (12–50 Hz) to slow-frequency oscillations (1–4 Hz) in OB for P8–10 WT and GE mice. D, Z-scored PAC of CA1 and PFC LFP amplitude at fast frequencies to slow frequencies in the OB for P8–10 WT and GE mice. Pie charts show the percentage of recordings with significant coupling. Dotted lines correspond to a z-score of 1.96 indicating the significance level. Shaded areas in A and B correspond to SEM. Significant differences are indicated as *, **, and *** for p < 0.05, 0.01, and 0.001, respectively.
Figure 6.
Figure 6.
Chemogenetic or DISC1 knockdown-mediated reduction of OB activity decreases hippocampal–prefrontal network activity. A, Top, Experimental timeline for hM4Di-mediated inhibition of OB outputs during electrophysiological recordings in P9–10 Tbet-cre mice. Bottom, A representative image of the ventral brain of a P10 mouse showing hM4Di-mCherry expression labeling the OB and mitral/tufted cell axons in the lateral olfactory tract. B, Color-coded averaged MI of LFP power spectra for OB, CA1, and PFC for P9–10 mice (n = 6) relative to C21 injection activating the inhibitory DREADD hM4Di in OB mitral/tufted cells. C, MI power in distinct frequency bands before (pre) and after (post) injection of P21 for OB, CA1, and PFC. D, Experimental timeline for shRNA-mediated knockdown of DISC1 in the OB of immune-challenged mice. E, Coronal sections of the OB, CA1, and PFC of immune-challenged mice at P9 after P1 injection of AAVs encoding shRNA against Disc1 (OBshDisc1) or a scrambled control (OBshScr) immunostained for DISC1 (red). EGFP (green) expression is mediated by the AAVs. F, Power spectra of spontaneous OB, CA1, and PFC activity in P8–10 OBshDisc1 (n = 8) and OBshScr (n = 8) immune-challenged mice. Shaded areas in F correspond to SEM. Significant differences are indicated as *, **, and *** for p < 0.05, 0.01, and 0.001, respectively.
Figure 7.
Figure 7.
Normal odor detection in immune-challenged Disc1+/− mice at P9. A, Experimental setup for USV recordings during odor exposure. B, Example spectrogram of USVs of a P9 mouse. C, The raster plot of USV suppression in response to the odorant citral for P9 WT (n = 53) and GE (n = 56) mice. Each line represents one mouse. D, MI of USV numbers defined as the (call rate during odor − before odor) / (during odor + before odor) in response to the odorant citral at different concentrations. Two-way ANOVA revealed significant effects of concentration (F(2) = 21.37; p = 2.4 × 10−9), but not of animal condition or their interaction. Significant differences are indicated as *, **, and *** for p < 0.05, 0.01, and 0.001, respectively.
Figure 8.
Figure 8.
Impaired long-term odor memory in immune-challenged Disc1+/− mice at P10/11. A, Timeline of neonatal odor learning and odor–place preference test for P10–11 mice. B, Left, An example image of a P10 mouse in the odor–place preference test chamber. Right, Example color-coded position of a mouse's nose traced by DeepLabCut during the odor–place preference test. C, Discrimination index of test and control odor defined as (time in test zone + time in control zone) / (time in test zone + time in control zone) in the odor–place preference test on the same day of neonatal odor learning for P10 WT and GE mice. Test and control odors were presented pure (100/0, WT n = 40; GE n = 38 mice) or mixed (90/10, WT n = 42; GE n = 41 mice; 80/20, WT n = 37; GE n = 36 mice). Two-way ANOVA revealed significant effects of odor mixture (F(2) = 4.54; p = 0.011), but not of animal condition or their interaction. D, Discrimination index of test and control odor in the odor–place preference test the day after neonatal odor learning for P11 WT (n = 57) and GE (n = 52) mice. Significant differences are indicated as *, **, and *** for p < 0.05, 0.01, and 0.001, respectively.

Similar articles

References

    1. Ackman JB, Burbridge TJ, Crair MC (2012) Retinal waves coordinate patterned activity throughout the developing visual system. Nature 490:219–225. 10.1038/nature11529 - DOI - PMC - PubMed
    1. Ahlbeck J, Song L, Chini M, Bitzenhofer SH, Hanganu-Opatz IL (2018) Glutamatergic drive along the septo-temporal axis of hippocampus boosts prelimbic oscillations in the neonatal mouse. Elife 7:e33158. 10.7554/eLife.33158 - DOI - PMC - PubMed
    1. Armstrong CM, DeVito LM, Cleland TA (2006) One-trial associative odor learning in neonatal mice. Chem Senses 31:343–349. 10.1093/chemse/bjj038 - DOI - PubMed
    1. Baccalá LA, Sameshima K (2001) Partial directed coherence: a new concept in neural structure determination. Biol Cybern 84:463–474. 10.1007/PL00007990 - DOI - PubMed
    1. Basha D, Chauvette S, Sheroziya M, Timofeev I (2023) Respiration organizes gamma synchrony in the prefronto-thalamic network. Sci Rep 13:8529. 10.1038/s41598-023-35516-7 - DOI - PMC - PubMed

MeSH terms

LinkOut - more resources