. 2025 May 30;16(1):5028.
doi: 10.1038/s41467-025-60255-w.

Unravelling the transcriptome of the human tuberculosis lesion and its clinical implications

Affiliations

Unravelling the transcriptome of the human tuberculosis lesion and its clinical implications

Kaori L Fonseca et al. Nat Commun. .

Abstract

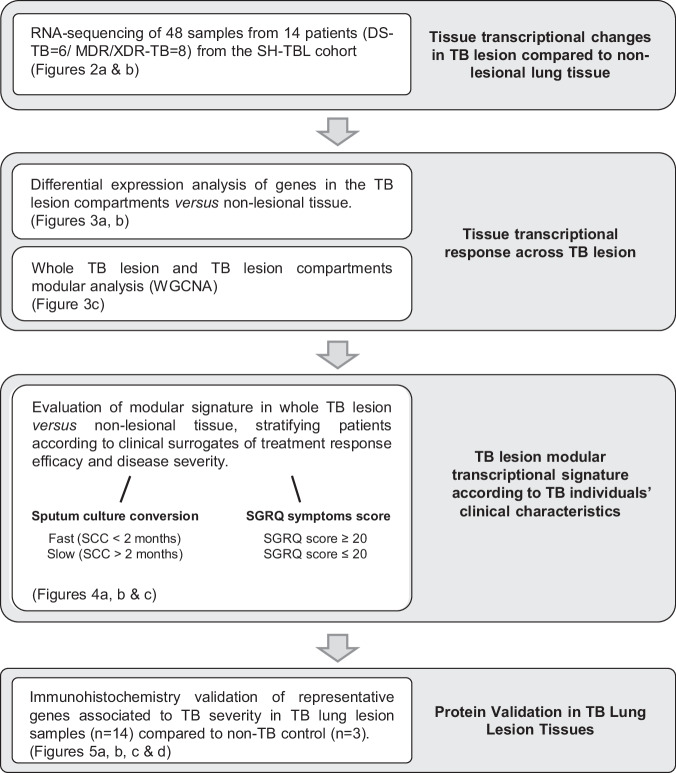
The tuberculosis (TB) lesion is a complex structure, contributing to the overall spectrum of TB. We characterise, using RNA sequencing, 44 fresh human pulmonary TB lesion samples from 13 TB individuals (drug-sensitive and multidrug-resistant TB) undergoing therapeutic surgery. We confirm clear separation between the TB lesion and adjacent non-lesional tissue, with the lesion samples consistently displaying increased inflammatory profile despite heterogeneity. Using weighted correlation network analysis, we identify 17 transcriptional modules associated with TB lesion and demonstrate a gradient of immune-related transcript abundance according to spatial organization of the lesion. Furthermore, we associate the modular transcriptional signature of the TB lesion with clinical surrogates of treatment efficacy and TB severity. We show that patients with worse disease present an overabundance of immune/inflammation-related modules and downregulated tissue repair and metabolism modules. Our findings provide evidence of a relationship between clinical parameters, treatment response and immune signatures at the infection site.


Conflict of interest statement

Competing interests: The authors declare the following competing interests: C.V. is an unpaid board member of the following non-profit organizations: the FUITB foundation and the ACTMON foundation. Neither the FUITB nor ACTMON have had any role in the conceptualization, design, data collection, analysis, decision to publish, or preparation of the manuscript. The remaining authors declare no competing interests.

Figures

Fig. 1
Fig. 1. Overall study plan.
Overview of the analysis undertaken in the study. Figures associated with each objective are stated.
Fig. 2
Fig. 2. The human TB lesion signature shows a distinct and heterogeneous transcriptional profile as compared with non-lesional lung tissue.
TB lesion samples were collected from each patient included in the SH-TBL cohort: central lesion (C), internal wall (I) and external wall (E) and, altogether, samples from each patient represent the human TB lesion. An additional sample from surrounding non-lesional lung tissue (NL) was also collected from the same patient as control (a). 48 samples from 14 patients (6 DS-TB and 8 MDR/XDR-TB) were RNA sequenced to evaluate the human TB lung lesion transcriptomic changes. A set of 4630 DEGs was identified after comparing the human TB lesion counts with NL lung tissue expression, using DESeq2 with adjusted p < 0.05. b heatmap depicts the top 40 DEGs ranked by the adjusted p-value comparing the human TB lesion versus NL lung tissue expression profiles (44 paired samples from 13 patients). The intensity of each colour denotes the standardized ratio between each value and the average expression of each gene across all samples. Red pixels correspond to an increased abundance of mRNA in the indicated sample, whereas blue pixels indicate decreased mRNA levels. Source data are provided as a Source Data file. Image in (a) was created in BioRender. Vilaplana, C. (2025) https://BioRender.com/x16o926.
Fig. 3
Fig. 3. The human TB lung lesion compartments have different gene expression profiles and are enriched for immune inflammatory response pathways.
a show the enrichment score derived from single sample analysis GSEA using the top 40 genes discriminating TB lesion (G) from NL lung tissue. Data on the enrichment for each compartment (C, I, E and NL) are represented as medians with an interquartile range (IQR). Boxplots show minimum and maximum values, the interquartile range (IQR, 25th to 75th percentile), and the whiskers representing 1.5 times the interquartile range. Outliers are indicated as individual points outside the whiskers. Statistical analysis was performed by applying the two-sided t-test. Statistical differences refer to a p-value < 0.05. In (b) the heatmaps show differences in the top 40 ranked genes from DESeq2 with adjusted p < 0.05 by separately comparing the central (C), internal (I) and external (E) compartments with the NL lung tissue gene expression derived (). The intensity of each colour denotes the standardized ratio between each value and the average expression of each gene across all samples. Red pixels correspond to an increased abundance of mRNA in the indicated sample, whereas blue pixels indicate decreased mRNA levels. c pictures modular transcriptional of the seventeen modules of co-expressed genes derived from WGCNA for our TB lesion dataset separated by compartment. Fold enrichment scores derived using QuSAGE are depicted, with red and blue indicating modules over or under expressed compared to the control. Only modules with fold enrichment (FDR) < 0.1 were considered significant. Source data are provided as a Source Data file.
Fig. 4
Fig. 4. TB lesion modular transcriptional signature correlates with TB clinical and microbiological characteristics revealing differential responses between patient’s group.
Modular analysis of RNA-seq data from TB lesions of 14 patients. Patients were clinically defined accordingly to sputum culture conversion (SCC) and TB disease impact on lung function, measured using the Saint George’s Respiratory Questionnaire (SGRQ) symptom score, as surrogates of treatment response and TB severity. Heatmap represent the key TB lesion modules significantly associated to individual’s’ clinical surrogates of TB severity and treatment response (a). Fold enrichments were calculated for each WGCNA module using hypergeometric distribution to assess whether the number of genes associated with each clinical status is larger than expected. Fold enrichment scores derived using QuSAGE are depicted, with red and blue indicating modules over or under expressed compared to the control. The colour intensity represents degree of perturbation. Modules with fold enrichment scored FDR p-value < 0.1 are considered significant. b, c show TB individuals’ stratification according to SCC (fast n = 28 or slow converters n = 20) and SGRQ symptom score (low impact if SGRQ < 20 with n = 23 or high impact if SGRQ > 20 with n = 25), respectively, and the significant association using their corresponding derived WGCNA significant eigengene modules (ME) (p < 0.05). Data are represented as median with an interquartile range (IQR). Boxplots show minimum and maximum values, the interquartile range (IQR, 25th to 75th percentile), and the whiskers representing 1.5 times the interquartile range. Outliers are indicated as individual points outside the whiskers. Statistical analysis was performed by applying the two-sided Wilcoxon-rank sum test. Source data are provided as a Source Data file.
Fig. 5
Fig. 5. Immunohistochemistry staining of representative genes associated with TB severity reveals higher protein expression in TB compared to non-TB controls.
a shows representative immunohistochemistry staining for CXCL9, GBP5 and STAT1 from the TB lesion of a representative patient (TB-05) compared to a patient presenting bullous emphysema (TB-42), as non-TB control. The top row corresponds to whole sections of the TB lesion (at the left of the images) and of non-lesional tissue (at the right of the images). Scale bars correspond to 1000 µm. NC necrotic core, M macrophage region, F fibrotic region, L lymphocyte-enriched region, AS alveolar space. bd show the quantification of CXCL9, GBP5 and STAT1 protein levels respectively in lesion sections of all TB patient (n = 14) compared to the non-TB control tissue sections (n = 3). n refers to biologically independent tissue sections from different individuals. Data on the percentage of stained area are represented as median with an interquartile range (IQR) Boxplots show minimum and maximum values, the interquartile range (IQR, 25th to 75th percentile), and the whiskers representing 1.5 times the interquartile range. Outliers are indicated as individual points outside the whiskers. Statistical analysis was performed by applying the two-sided Wilcoxon-rank sum test. Statistical differences refer to a p-value < 0.05. Source data are provided as a Source Data file.
Fig. 6
Fig. 6. Overview of the main conclusions of this study.
This figure summarizes the key findings of our study. We obtained a modular transcriptomic signature for the TB lesion that follows a gradual increase of differential expression relative to non-lesional tissue towards the center of the lesion, including the enrichment of gene modules associated with the immune response and inflammation within the lesion. The association of a worsened local status of the lesion with clinical and microbiological surrogates contributes to the immunopathological understanding of the disease and may aid in the clinical management of the disease by opening a window of opportunity for the adjustment of treatment. This figure was created in BioRender. Vilaplana, C. (2025) https://BioRender.com/f17r368.

References

    1. World Health Organization (WHO). Global Tuberculosis Report. (World Health Organization, 2024).
    1. Gil, O. et al. Granuloma encapsulation is a key factor for containing tuberculosis infection in minipigs. PLoS ONE5, e10030 (2010). - PMC - PubMed
    1. Lenaerts, A., Barry, C. E. & Dartois, V. Heterogeneity in tuberculosis pathology, microenvironments and therapeutic responses. Immunol. Rev.264, 288–307 (2015). - PMC - PubMed
    1. Lin, P. L. et al. Sterilization of granulomas is common in active and latent tuberculosis despite within-host variability in bacterial killing. Nat. Med.20, 75–79 (2014). - PMC - PubMed
    1. Gideon, H. P. et al. Multimodal profiling of lung granulomas in macaques reveals cellular correlates of tuberculosis control. Immunity55, 827–846 (2022). - PMC - PubMed

MeSH terms

Substances