. 2025 May 30;16(1):5034.
doi: 10.1038/s41467-025-60319-x.

A robust multiplex-DIA workflow profiles protein turnover regulations associated with cisplatin resistance and aneuploidy

Affiliations

A robust multiplex-DIA workflow profiles protein turnover regulations associated with cisplatin resistance and aneuploidy

Barbora Salovska et al. Nat Commun. .

Abstract

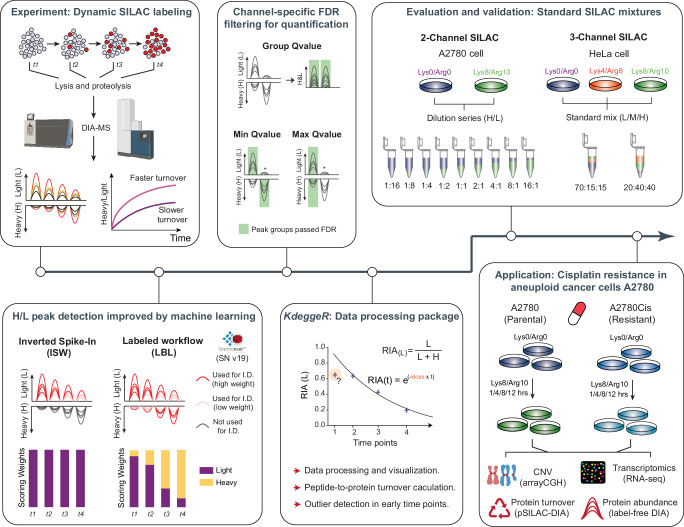
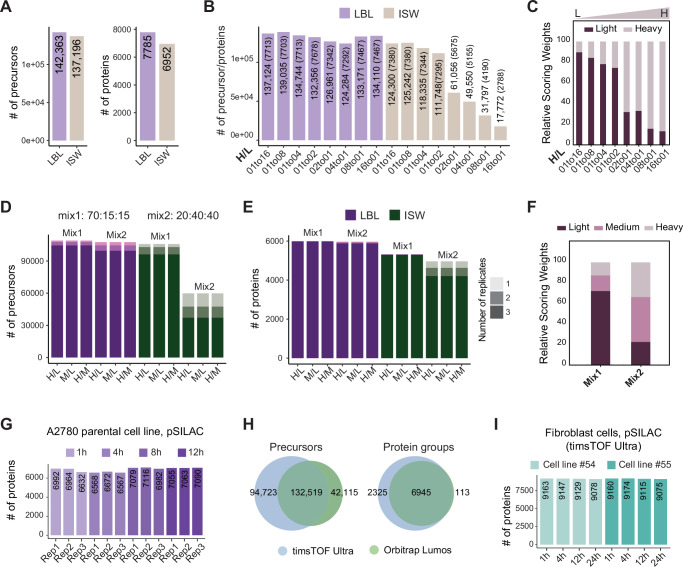
Quantifying protein turnover is fundamental to understanding cellular processes and advancing drug discovery. Multiplex-DIA mass spectrometry (MS), combined with dynamic SILAC labeling (pulse-SILAC, or pSILAC) reliably measures protein turnover and degradation kinetics. Previous multiplex-DIA-MS workflows have employed various strategies including leveraging the highest isotopic labeling channels to enhance the detection of isotopic signal pairs. Here we present a robust workflow that integrates a machine learning algorithm and channel-specific statistical filtering, enabling dynamic adaptation to channel ratio changes across multiplexed experiments and enhancing both coverage and accuracy of protein turnover profiling. We also introduce KdeggeR, a data analysis tool optimized for pSILAC-DIA experiments, which determines and visualizes peptide and protein degradation profiles. Our workflow is broadly applicable, as demonstrated on 2-channel and 3-channel DIA datasets and across two MS platforms. Applying this framework to an aneuploid cancer cell model before and after cisplatin resistance, we uncover strong proteome buffering of key protein complex subunits encoded by the aneuploid genome mediated by protein degradation. We identify resistance-associated turnover signatures, including mitochondrial metabolic adaptation via accelerated degradation of respiratory complexes I and IV. Our approach provides a powerful platform for high-throughput, quantitative analysis of proteome dynamics and stability in health and disease.


Conflict of interest statement

Competing interests: O.B., T.G. and L.R. are employees of Biognosys AG. Spectronaut is a trademark of Biognosys AG. The remaining authors declare no competing interests.

Figures

Fig. 1
Fig. 1. A robust workflow for multiplex-DIA MS data analysis.
Upper left: Protein turnover analysis on a large scale using dynamic stable isotope labeling by amino acids in cell culture (pSILAC), combined with highly robust and reproducible multiplex data-independent acquisition (DIA) mass spectrometry (MS), enables the quantification of thousands of protein turnover rates and facilitates quantitative comparisons between multiple conditions. Datasets from two MS platforms (Orbitrap Fusion Lumos and timsTOF Ultra) were processed. Lower left: In the previously reported “Inverted Spike-In Workflow” (ISW), peak picking and scoring relied solely on the light channel. In the “Labeled” (LBL) workflow, XIC peak picking, elution group scoring, and “Group Qvalue” calculation are performed across all channels (n = 2, 3, …, N) in a combined fashion, facilitated by improved machine learning. Upper middle: In addition to the “Group Qvalue”, our Spectronaut v19 (SN19) solution now offers channel-specific q-value filtering options for more stringent quantification data filtering. In the “Min Qvalue” option, at least one channel needs to be independently identified (q-value < 0.01), while in the “Max Qvalue” option, all channels must be independently identified (q < 0.01) to accept the entire elution group. Lower middle: As part of the workflow, we provide an R package named KdeggeR for the analysis of pulse SILAC DIA-MS data from various raw data processing software, including data formatting, data filtering and quality control (QC), the calculation of precursor-, peptide-, and protein-level turnover rates (kloss), subsequent protein degradation rate (kdeg) transformation, comparative data analysis, and data visualization. Upper right: We evaluated the multichannel analysis implemented in SN19 (and onwards) using 2-channel and 3-channel standard datasets acquired previously and publicly available (Salovska et al., 2021; Bortecen et al., 2024). Lower right: We demonstrated the feasibility of the entire workflow by applying it to the study of protein turnover regulation in a cisplatin resistance model of the highly aneuploid ovarian cancer cell line A2780 and integrated the data with other omic layers. This application highlighted the importance of studying protein turnover to derive biological insights into complex phenomena such as cancer drug-resistance phenotype. Several components were Created in BioRender. Liu, Y. (2025) https://BioRender.com/7y30v3c.
Fig. 2
Fig. 2. Improved identification of multiplex DIA-MS datasets using machine learning to dynamically select isotopic labeling features.
A Improved identification using the “Labeled” workflow (LBL) implemented in SN19 in the A2780 sample with H/L = 1; the numbers of identifications at the precursor (left) and protein (right) levels are shown. B The “Labeled” workflow (LBL) outperformed the “Inverted Spike-In Workflow” (ISW) in the A2780 dilution series analysis; the numbers of identified IDs at the precursor and protein (in brackets) levels are shown. C Scoring weight histogram from the 2-channel A2780 dilution series experiment. Number of precursors (D) and proteins (E) identified in the 3-channel HeLa standard sample experiment; the numbers of IDs identified in experimental replicates are shown. F Scoring weight histogram from the 3-channel HeLa standard sample experiment. The bars represent the average weights per condition/mix. G Protein-level identifications in the pulse SILAC experiment in the A2780 cell line. H Precursor- and protein-level comparison of identifications between samples measured using the timsTOF Ultra and Orbitrap Fusion Lumos platforms. I Protein-level identification in a pSILAC experiment. A, B, D, E Both analyses using the LBL and ISW were performed in the same version of Spectronaut 19. In all figures, the LBL was run with the default GroupQ quantification filtering option (q < 0.01). Source data are provided as a Source Data file.
Fig. 3
Fig. 3. Channel-specific q-value filtering for quantifying ratios of isotopically labeled peptides.
A Comparison of protein-level ratio distribution in the A2780 standard dilution samples after different q-value quantification filtering for multichannel samples (enabled in SN19); the dashed lines and numbers represent the medians of the data distributions, shown using density plots; the points represent individual values. B The histograms indicate the number of protein-level H/L ratios quantified in the samples shown in (A). C Comparison of protein-level ratio distributions in the HeLa 3-channel standard sample after different q-value quantification filtering. Ratios were calculated between channels as indicated and represent average from 3 replicates. The dashed lines indicate expected ratios based on sample composition; the numbers represent observed median values. D Binned protein-level ratio CV based on 3 replicates in the HeLa sample after different q-value quantification filtering. E Comparison of protein-level H/L ratios in the pulse SILAC A2780 samples after different q-value quantification filtering. The protein-level ratios were calculated based on 3 replicates. The numbers represent observed median values. F Binned protein-level ratio CV based on 3 replicates in the A2780 pulse SILAC sample after different q-value quantification filtering. In (AF) groupQ, minQ, and maxQ refer to “Group Q-value”, “Min Q-value”, and “Max Q-value” filtering, which are the quantification settings in the data analysis in SN19. In (C, E) the boxes indicate Q1–Q3 with the median; whiskers span 1.5 × IQR. Outliers beyond this range are shown as individual points. Source data are provided as a Source Data file.
Fig. 4
Fig. 4. KdeggeR, a comprehensive and integrative R package for proteomic turnover analysis.
A The KdeggeR package streamlines pSILAC data analysis by providing functions for importing data from several common raw data processing software tools, data cleaning, and quality control. Next, precursor-level kloss can be estimated using three different methods, and protein-level kloss can be calculated by performing a weighted average of the corresponding precursor-level kloss values, considering precursor-level fit quality and/or the number of data points. Protein degradation rates (kdeg) and half-life (t1/2) are calculated using cell division rate (kcd) values provided by the user or by using a theoretical kcd value estimated from the kloss value distribution. Visualization functions enable inspection of the precursor- and protein-level fitting results and comparative analysis between multiple conditions. B Demonstration of precursor-level quality filtering in the dynamic SILAC experiment performed in the A2780 cell line. Data were analyzed using the LBL workflow and exported using the “Group Q-value” (groupQ), “Min Q-value” (minQ), and “Max Q-value” (maxQ) channel quantification filtering. CE Example analysis of MBNL1, a protein with a significantly slower turnover rate in the A2780Cis (resistant) cell line compared to the parental A2780 cell line. C Protein-level kloss fit to all precursor-level data. D Distribution of precursor-level kloss values (N = 3) corresponding to the MBNL1 protein. The boxes indicate Q1–Q3 with the median; whiskers span 1.5 × IQR. Outliers beyond this range are shown as individual points. E A representative example of precursor-level kloss calculation by performing nonlinear least squares (nls) fitting using the relative isotope abundance of the light peptide (RIA). The plots were visualized using the KdeggeR package. Source data are provided as a Source Data file.
Fig. 5
Fig. 5. Multi-omics analysis of the cisplatin-resistant model illustrating buffering and amplification of CNA-affected proteins through protein degradation.
A Copy number alterations (CNA) in the A2780 paired cell line model were mapped to transcriptomic data, protein abundance data, and protein degradation rate (kdeg) values measured by DIA-MS. The CNA and transcriptomic data were generated by previous studies analyzing the same cell lines (Prasad et al. 2008; Behrman et al. 2021). Relative differences between A2780Cis (resistant) and A2780 (parental) are shown on the y-axis, while the x-axis depicts genes ordered by their chromosome location. Chromosomal regions with CNA are highlighted in red. B Post-translational buffering of protein complex subunits (CORUM 4.0) encoded by genes with reported copy number alterations between the A2780Cis (resistant) and A2780 (parental) cell lines, revealed by mRNA and kdeg fold change correlation analysis. Statistical analysis was performed using a two-sided Fisher’s z-test. Pearson’s correlation coefficients (R) and the number of proteins (N) are shown. The dark red line represents a linear fit to the data with 95% confidence intervals (pink). C Selected examples of protein complexes with significant mRNA-kdeg correlation (P < 0.05; Pearson correlation with two-sided t-test) and at least 3 subunits affected by CNA. N indicates the number of CNA subunits/total number of subunits per complex; the percentage shows the proportion of CNA subunits. The dark red line represents a linear fit to the data. D Gene-level GO Biological Process enrichment analysis performed by Metascape (https://metascape.org). “Gain” and “Loss” indicate the gene copy number change in A2780Cis. “Amplification” and “Buffering” indicate the direction of protein degradation regulation in A2780Cis relative to “Gain” or “Loss”; i.e., “Gain + Amplification” and “Gain + Buffering” indicate that protein degradation tended to be downregulated and upregulated, respectively, and vice versa in the “Loss” cases. The P values were estimated using a hypergeometric test. Protein degradation rates were estimated using our pipeline with GroupQ filtering in SN19. Source data are provided as a Source Data file.
Fig. 6
Fig. 6. Protein turnover measurement provides biological insights into the drug-resistance phenotype and remodeling of the mitochondrial proteome in A2780 cells.
A Number of significantly regulated proteins at the abundance and degradation levels (Benjamini–Hochberg FDR < 0.05, absolute fold change ≥1.5; two-sided moderated t-test). B Significantly up- and downregulated proteins (from A) at abundance and degradation (kdeg) levels, including overlaps (generated using Metascape). C 2D enrichment analysis of gene ontology biological process (GOBP) terms using log2 fold changes at the protein abundance and degradation levels between A2780Cis and A2780 cell lines. Shown are the top 25 terms (P < 0.01, >9 proteins). Circle size indicates protein count; color reflects -log10(P) from two-sided 2D enrichment test (Perseus 1.6.14.0). D 1D enrichment analysis (Perseus 1.6.14.0) of mitochondrial Gene Ontology Cellular Component (GOCC) terms. Enrichment scores are color-coded; asterisks denote significance. The exact two-sided Wilcoxon test P-values and data distributions are shown in Supplementary Fig. 7. The figures were adapted from components Created in BioRender. Liu, Y. (2025) https://BioRender.com/7y30v3c’. E A protein cluster identified using MCODE analysis (performed using Metascape) of the protein-protein interaction (PPI) network of significantly regulated proteins (from B). Node colors indicate up/down-regulation at the abundance and degradation levels. F Genes associated with cisplatin sensitivity identified via correlation analysis in DepMap were mapped to protein abundance and degradation data. Proteins significantly regulated at both levels with opposing trends are highlighted. G Precursor-level H/L ratio scatter plots for NDUFB11 in A2780 (left) and A2780Cis (right). The slope (“a”) of the linear fit estimates the protein-level ratio (generated by Spectronaut). H NDUFB11 mRNA expression negatively correlates with cisplatin IC50 in the GDSC1 dataset, indicating lower expression is associated with increased resistance. Linear fit (dark red) and 95% confidence interval (pink) are shown. Pearson correlation and two-sided t-test were used. Protein degradation rates were estimated using our pipeline with GroupQ filtering in Spectronaut v19. Source data are available in the Source Data file.

Update of

Similar articles

References

    1. Theurillat, J. P. et al. Prostate cancer. Ubiquitylome analysis identifies dysregulation of effector substrates in SPOP-mutant prostate cancer. Science346, 85–89 (2014). - PMC - PubMed
    1. Ming, H. et al. Protein degradation: expanding the toolbox to restrain cancer drug resistance. J. Hematol. Oncol.16, 6 (2023). - PMC - PubMed
    1. Venable, J. D., Dong, M. Q., Wohlschlegel, J., Dillin, A. & Yates, J. R. Automated approach for quantitative analysis of complex peptide mixtures from tandem mass spectra. Nat. Methods1, 39–45 (2004). - PubMed
    1. Gillet, L. C. et al. Targeted data extraction of the MS/MS spectra generated by data-independent acquisition: a new concept for consistent and accurate proteome analysis. Mol. Cell Proteomics11, 10.1074/mcp.O111.016717 (2012). - PMC - PubMed
    1. Salovska, B. et al. Isoform-resolved correlation analysis between mRNA abundance regulation and protein level degradation. Mol. Syst. Biol.16, e9170 (2020). - PMC - PubMed

LinkOut - more resources