. 2025 May 30;15(1):19079.
doi: 10.1038/s41598-025-03655-8.

Measurement of macrophage phagocytic capacity by quantifying maximum membrane extension using an opsonized capillary tube assay

Affiliations

Measurement of macrophage phagocytic capacity by quantifying maximum membrane extension using an opsonized capillary tube assay

Dan Horonushi et al. Sci Rep. .

Abstract

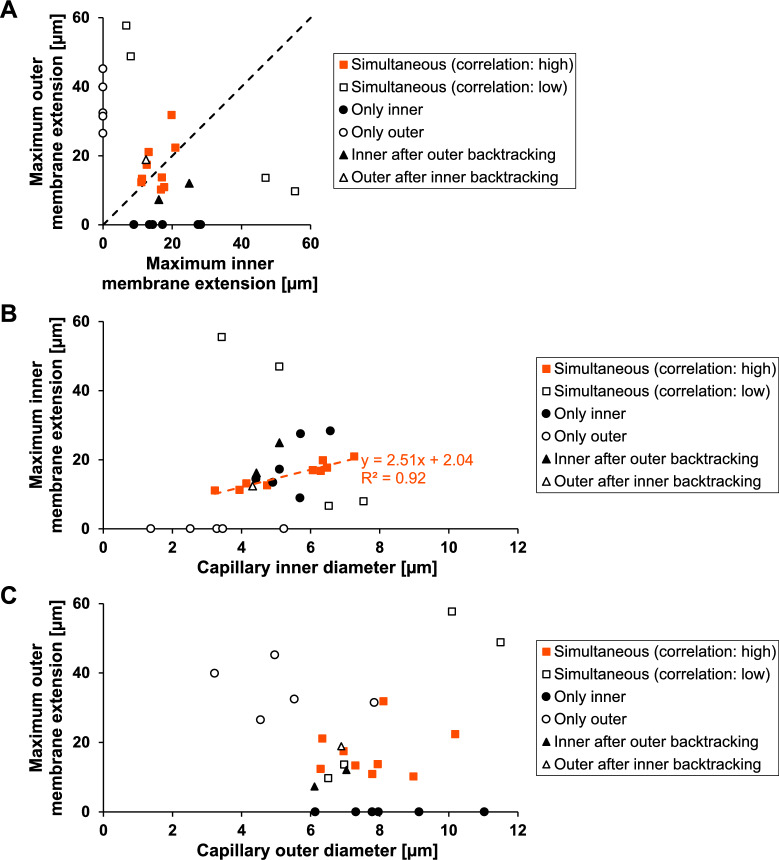
The zipper mechanism explains phagocytosis as sequential ligand-receptor interactions between macrophages and antigens, followed by the cell membrane extension for phagosome formation. Hence, the ability of macrophages to innate immunity is restricted by their capacity for engulfment related to the expansion limit of their membranes. However, the maximum expansion ability of macrophage membranes and their relationship with the phagocytosis capacity has not been rigorously investigated yet because of the lack of quantitative measurement methods of maximum cell expansion. Here, we have developed an opsonized capillary tube assay and evaluated the maximum membrane extension on the opsonized inner surface of capillary tubes from the inner round area attached to the macrophage surface. When the engulfment started, the cell membrane in the inner circle of the capillary head expanded up to 10.64 times in opsonized capillary tubes regardless of the inner diameter differences of 3 to 7 μ m. This maximum expansion ability was two times larger than those reported in the frustrated phagocytosis experiments. To support this result, we confirmed the independence of simultaneous local phagocytic responses against multiple antigens and the phagocytic ability of the outer surfaces of extending phagocytic cups. We applied this maximum expansion capacity to the opsonized microneedle phagocytosis and estimated that the required cell membrane for phagocytosis to reach the maximum expansion was up to 5.05 μ m area around the attached antigen. The maximum number of engulfed 40 μ m microbeads during the serial phagocytosis was 24% consume of their maximum ability of membrane extensions, suggesting that serial phagocytosis may involve another phagocytosis-number-dependent regulatory mechanism, adding to the zipper mechanism to understand the determination of phagocytosis capacity.


Conflict of interest statement

Declarations. Competing interests: The authors declare no competing interests.

Figures

Fig. 1
Fig. 1
Independence of local membrane extension in multiple microneedle phagocytosis by a single macrophage. (A) Setup for multiple opsonized microneedle phagocytosis. (B) Example of the independent local membrane extension by a single macrophage. This sample corresponds to Sample 14 in Table S1. (a) Timelapse micrographs of the membrane extension in two-point opsonized microneedle phagocytosis: t=0min (engulfment started), 10.83min (cell membrane on the left microneedle reached maximum extension and began to backtrack), 13.33min (cell membrane on the right microneedle reached maximum extension and began to backtrack), and 89.17min (unidirectional cell membrane motion finished), respectively (see also Video S1). Orange and blue arrowheads point to the cell membrane’s leading edge position on the left and right microneedles, respectively. Bar, 10μm. (b) Tracking of the cell membrane extension length on each microneedle. The membrane extension was defined as the length from the head of the microneedle to the leading edge of the cell membrane. (C) Verification of correlation between cell membrane extension on the left and right microneedles. (a) Comparison of cell membrane extension speed between left and right microneedles in two-point microneedle phagocytosis. The data were displayed in three classifications regarding the diameter ratio of the two microneedles: under 2 times, 2 to 4 times, and over 4 times. The dashed line is the theoretical line when the extension speeds on the two microneedles are the same. (b) Comparison of cell membrane extension speed between single and two-point microneedle phagocytosis. The dots and error bars show the mean and standard deviation, respectively. (c) Histogram of backtracking start time difference. Backtracking start time difference was defined as the difference in time when the cell membrane began to backtrack on two microneedles.
Fig. 2
Fig. 2
Phagocytic response ability on the outside of extending phagocytic cup. (a) Schematic drawings and (b) time-lapse micrographs of the cell membrane extension: t=0min (engulfment for the first microneedle started), 8.75min (just before the second microneedle was put on the phagocytic cup), 9.17min (just after the second microneedle was put on), t=17.08min (cell membrane motion upward on the second microneedle reached maximum and backtracking started),t=21.25min (cell movement initiated), t=26.25min (cell membrane motion downward on the second microneedle reached maximum and backtracking started) and t=37.08min (cell membrane on the first microneedle reached maximum extension and began to backtrack), respectively (see also Video S2). The orange, blue, and green arrowheads point to the cell membrane leading edge positions on the first, second upward, and second downward microneedle, respectively. The capillary tube in the micrographs suctioned the left part of the cell slightly to prevent the rightward movement of the cell bodies as microneedle phagocytosis. Bar, 10μm. (c) Tracking of the cell membrane extension length on the first and second microneedles. The upward and downward membrane extension on the second microneedle was defined as the length from the intersection point of two microneedles to the leading edge of the upward and downward cell membrane, respectively. The second microneedle position, shown in a black dashed line, represents the distance from the head of the first microneedle to the intersection point of the two microneedles. The second microneedle position fluctuated due to the cell membrane progression and backtracking. The cell began to move against the suction of the capillary tube 21.25 min. After that, the phagocytic response to the first microneedle started.
Fig. 3
Fig. 3
Membrane extensions on inner/outer surfaces of opsonized microcapillary tube. (A) Antibody modification on the surface of microcapillary tube and interaction between IgG and Fcγ receptors. (B) Measurement of membrane extension on the inner/outer surfaces of a microcapillary tube. For evaluation of synchronous membrane extension on the inner and outer surface of microcapillary tubes, four leading edge positions were recorded: Inner top (xi1, downwards orange arrowhead), inner bottom (xi2, upwards orange arrowhead), outer top (xo1, downwards blue arrowhead) and outer bottom (xo2, upwards blue arrowhead), respectively. (C) Example of phagocytosis for an opsonized microcapillary tube. (a) Timelapse micrographs of the membrane extension of a macrophage engulfing an opsonized microcapillary tube: t=0min (engulfment started), 31.67min (outer membrane extension reached maximum and backtracking started), 43.33min (inner membrane extension reached maximum and backtracking started), and 156.67min (backtracking of inner/outer membrane finished), respectively. Orange and blue arrowheads point to the leading edge positions of the cell membrane, as described in (B) (see also Video S3). Bar, 10μm. (b) Time course of the cell membrane extension length: Orange line, mean inner edge extension; Blue line, mean outer edge extension. (c) Time course of the relative difference of the cell membrane extension length. The relative difference is between the top and bottom cell membrane extension length relative to their mean value.
Fig. 4
Fig. 4
Maximum membrane extension of macrophages in IgG-coated microcapillary tubes. (A) Correlation between the inner and outer maximum cell membrane extension. The data were classified into three types according to the extension manner of the inner and outer cell membrane: “Simultaneous,” meaning that the inner and outer cell membrane extended simultaneously; “Only inner,” or “Only outer,” meaning that only inner or outer extension was observed, and “Inner after outer backtracking” or “Outer after inner backtracking” meaning that the inner/outer surface cell membrane began to extend after the outer/inner surface one extended and finished backtracking. The dashed line is the theoretical line when the maximum extension length of the outer cell membrane coincides with that of the inner one. Data where the difference between the maximum membrane extension of the two membranes is within 50% of their mean are highlighted in orange. (B) Capillary inner diameter dependence of the maximum inner cell membrane extension length. The data highlighted in (A) is also highlighted in orange. The orange dashed line and accompanying formula represent the regression line for the selected samples (orange filled squares; simultaneous high correlation samples), along with its equation and coefficient of determination. (C) Capillary outer diameter dependence of the maximum outer cell membrane extension length. The data highlighted in (A) is also highlighted in orange.
Fig. 5
Fig. 5
Interpretation of source of extension membrane on a single macrophage. (A) Estimation of cell membrane expansion ratio. We defined the membrane expansion ratio as the ratio of the maximum cell membrane area increase to the internal cross-sectional area of the microcapillary tube. The data in orange were picked up based on the criteria presented in Fig. 4A. The orange and black arrows represent the mean values of the cell membrane expansion ratio in the picked-up samples and frustrated phagocytosis, respectively. The dashed line representing the membrane expansion ratio in frustrated phagocytosis was cited from Cannon’s report. (B) Histogram of the estimated cell membrane expansion ratio in “Simultaneous” ((a)), “Only inner” ((b)), and “Inner after outer backtracking” and “Outer after inner backtracking” ((c)). The orange bar corresponds to the orange dots in (A). (C) Local cell membrane expansion in the vicinity of attached antigens. We hypothesized that macrophages activate and extend their membrane near the antigen stimulation point denoted by δ and reach their phagocytic limit when the activated membrane extends to its limit (10.64 times from its initial apparent area). The activated membrane and its extension are shown in red. (D) Verification of local cell membrane expansion hypothesis. The estimation curve was most consistent with our previous experimental results, the maximum cell membrane expansion in opsonized single-microneedle phagocytosis, represented in black cross marks when δ=2.83μm (δ0, broken line). Moreover, all experimental result values fell within the range between δmin and δmax (indicated by the dashed lines).
Fig. 6
Fig. 6
Maximum phagocytic capacity in opsonized microbead phagocytosis. (A) Setup for serial opsonized microbead phagocytosis. (B) Antibody modification on the microbead surface and interaction between IgG and Fcγ receptors. (C) Micrograph of macrophage engulfing 2μm microbead. (D) Comparison of experimental and estimated maximum engulfed surface area. The maximum engulfed surface area was defined as the sum of the surface area of internalized microbeads. The experimental values were replotted from our previous results. The micrographs above the graph show the macrophages at their phagocytic limit. For 45μm microbeads, the experimental value is not applicable since no phagocytosis was observed. Bars, 10μm. (E) Variation in phagocytosis time in the macrophage that phagocytosed a large and small number of microbeads (50 and 31 microbeads in (a) and (b), respectively). The black arrow in each graph points to the last engulfment. (F) Histogram of phagocytosis time for 268 phagocytoses by 10 macrophages.

References

    1. Swanson, J. A. Shaping cups into phagosomes and macropinosomes. Nat. Rev. Mol. Cell Biol.9, 639–649. 10.1038/nrm2447 (2008). - PMC - PubMed
    1. Vorselen, D., Labitigan, R. L. D. & Theriot, J. A. A mechanical perspective on phagocytic cup formation. Curr. Opin. Cell Biol.66, 112–122. 10.1016/j.ceb.2020.05.011 (2020). - PubMed
    1. Tollis, S., Dart, A. E., Tzircotis, G. & Endres, R. G. The zipper mechanism in phagocytosis: Energetic requirements and variability in phagocytic cup shape. BMC Syst. Biol.4, 10.1186/1752-0509-4-149 (2010). - PMC - PubMed
    1. Pacheco, P., White, D. & Sulchek, T. Effects of microparticle size and fc density on macrophage phagocytosis. PLoS One8, e60989. 10.1371/journal.pone.0060989 (2013). - PMC - PubMed
    1. Geissmann, F. et al. Development of monocytes, macrophages, and dendritic cells. Science327, 656–661. 10.1126/science.1178331 (2010). - PMC - PubMed

LinkOut - more resources