. 2025 May 30;272(6):435.
doi: 10.1007/s00415-025-13183-0.

Evidence for lateralization of fear emotions in the cerebellum

Affiliations

Evidence for lateralization of fear emotions in the cerebellum

Johanna Pakusch et al. J Neurol. .
No abstract available


Conflict of interest statement

Declarations. Conflict of interest: The authors declare that the research was conducted in the absence of any commercial or financial relationships that could be construed as a potential conflict of interest. Ethical approval: Animal care and experimental procedures were performed in accordance with the European Communities Council Directive of 2010 (2010/63/EU) for care of laboratory animals and approved by a local ethics committee (Bezirksamt Arnsberg) and the animal care committee of North Rhine-Westphalia, Germany, based at the LANUV (Landesamt für Umweltschutz, Naturschutz und Verbraucherschutz, Nordrhein-Westfalen, D-45659 Recklinghausen, Germany). The study was supervised by the animal welfare commissioner of the Ruhr-University Bochum. Research involving human participants was approved by the local ethics committee.

Figures

Fig. 1
Fig. 1
Human cerebellar activation during unexpected US omissions in extinction, visualized on cerebellar flatmap projections (SUIT; [4]), was predominantly left-lateralized in lobule VI, Crus I, and Crus II, likely reflecting its role in processing prediction errors during extinction learning. Color maps indicate statistical significance (t-values or threshold-free cluster enhancemed (TFCE) t-values; AC uncorrected; D FWE-corrected; all p < 0.05). A Reanalyzed data from [5], eLife) during unexpected US omissions in the extinction phase showed a prediction error signal driving left-sided activation. Inset: Prediction error plot for CS + (conditioned stimulus paired with US) and CS- trials over time. B [2], Neuroimage) applied US stimulation to the left shin. During extinction, unexpected US omissions modulated with estimated prediction errors revealed left-sided activations. C [3], eNeuro) contrasted unexpected US omissions in early extinction (left shin stimulation) against rest to show left-sided activation. D [12], eLife) found that, despite the change of US stimulation side to the right, activations in extinction driven by prediction errors during US omissions remained predominantly left-sided. (The four manuscripts are under creative commons license)
Fig. 2
Fig. 2
Schematic of targeted recombination in active populations (TRAP). Mechanism how c-fos induced neuronal activity in the cerebellum is labeled by the fluorescent protein tdTomato. 1 Under basal conditions, the c-fos promoter is inactive and cre recombinase fused to the estrogen receptor (creER) is not expressed. tdTomato is also not expressed due to the stop codon. 2 The c-fos promoter is stimulated in active neurons, leading to creER expression in the cytosol. 3 Administration of 4-hydroxytamoxifen binds to creER and subsequent 4 translocation into the nucleus. 5 creER forms a tetramer which interacts with loxP sites that flank the stop codon and excise the stop codon, thus allowing the expression of tdTomato in c-fos active neurons. Cre cre recombinase; ER estrogen receptor; Fos c-fos promoter
Fig. 3
Fig. 3
Granule cell layer and Purkinje cell activity across different cerebellar subregions during early extinction. A Schematic of the experimental design. Mice initially underwent fear acquisition (acqu.). After 24 h, mice were divided into two groups; the red group underwent extinction (ex.) training (FE, fear extinction), while the grey group was not subjected to the tone (NE, no extinction). Following extinction, all animals were injected with 4-OHT. A total of 3 extinction days was conducted before extinction recall, where both groups were subjected to the CS. B Freezing behavior during the fear conditioning paradigm B1 Time-course traces show the freezing behavior during the CS for both groups. During the acquisition, both groups displayed increasing freezing behavior (F(3.347,34.74) = 22.41, p =  < .001), while extinction elicited higher freezing in the FE group (F(1,13) = 17.04, p = .001). B2 Boxplots display the freezing responses during baseline and retrieval between groups, as well as the difference between baseline and recall with statistical significance marked with asterisks. Fear recall revealed reduced fear behavior in the FE group when compared to the NE (post-hoc Tukey p =  < .001). Shaded areas represent SEMs, with significant differences indicated by asterisks which were determined with a two-way Mixed effects analysis with Greenhouse Geisser correction (p > 0.05). C1 Heatmap of mean fluorescent signals in the granule cell layer (corrected to controls) divided into examined areas. The gradient spans from control group levels to above control levels in red. Grey areas represent areas which did not reach significance. C2 Boxplots of granule cell layer activity in subregions displaying significant differences between left (light red) and right (light blue) hemispheres. Increased granule cell layer activity was observed in the left hemisphere for Crus I (t(6) = 7.01, p =  < .001) and Crus II (t(6) = 2.942, p = .026). D1 Heatmap of normalized mean fluorescent signals in Purkinje cells (corrected to controls) divided into 10% bins. The gradient spans from control group levels to above control levels in red. Grey areas represent areas which did not reach significance. D2 Boxplots of Purkinje cell activity in subregions displaying significant differences between left (light red) and right (light blue) hemispheres. Increased Purkinje cell activity was observed in the left hemisphere for lobule simplex (t(6) = 3.306, p = .015) and paraflocculus (t(5) = 5.1, p = .004). Statistical testing for hemispheric differences was analyzed with multiple paired t-tests as implemented in GraphPad Prism. All data are reported in the Supplementary Tables. Schematic of the cerebellar flatmap was adapted from [13]. ls lobule simplex; pml paramedian lobule; cop copula pyramidis; pf paraflocculus; fl flocculus

Similar articles

References

    1. Adamaszek M, D’Agata F, Kirkby KC, Trenner MU, Sehm B, Steele CJ et al (2014) Impairment of emotional facial expression and prosody discrimination due to ischemic cerebellar lesions. Cerebellum 13:338–345. 10.1007/s12311-013-0537-0 - PubMed
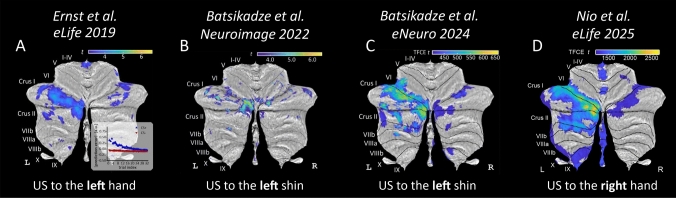
    1. Batsikadze G, Diekmann N, Ernst TM, Klein M, Maderwald S, Deuschl C et al (2022) The cerebellum contributes to context-effects during fear extinction learning: a 7T fMRI study. Neuroimage 253:119080. 10.1016/j.neuroimage.2022.119080 - PubMed
    1. Batsikadze G, Pakusch J, Klein M, Ernst TM, Thieme A, Nicksirat SA et al (2024) Mild Deficits in Fear Learning: Evidence from Humans and Mice with Cerebellar Cortical Degeneration. eNeuro 11:ENEURO.365-23.2023. 10.1523/eneuro.0365-23.2023 - PMC - PubMed
    1. Diedrichsen J, Zotow E (2015) Surface-based display of volume-averaged cerebellar imaging data. PLoS ONE 10:e0133402. 10.1371/journal.pone.0133402 - PMC - PubMed
    1. Ernst TM, Brol AE, Gratz M, Ritter C, Bingel U, Schlamann M et al (2019) The cerebellum is involved in processing of predictions and prediction errors in a fear conditioning paradigm. Elife. 10.7554/elife.46831 - PMC - PubMed

LinkOut - more resources