. 2025 Jun;26(6):837-853.
doi: 10.1038/s41590-025-02149-z. Epub 2025 May 30.

The IL-22-oncostatin M axis promotes intestinal inflammation and tumorigenesis

Collaborators, Affiliations

The IL-22-oncostatin M axis promotes intestinal inflammation and tumorigenesis

Roodline Cineus et al. Nat Immunol. 2025 Jun.

Abstract

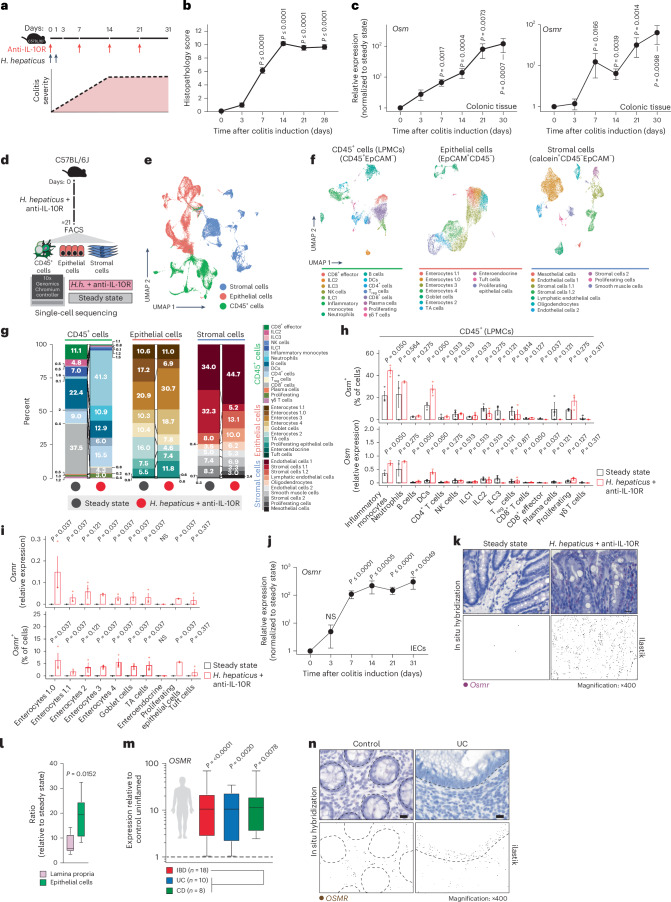
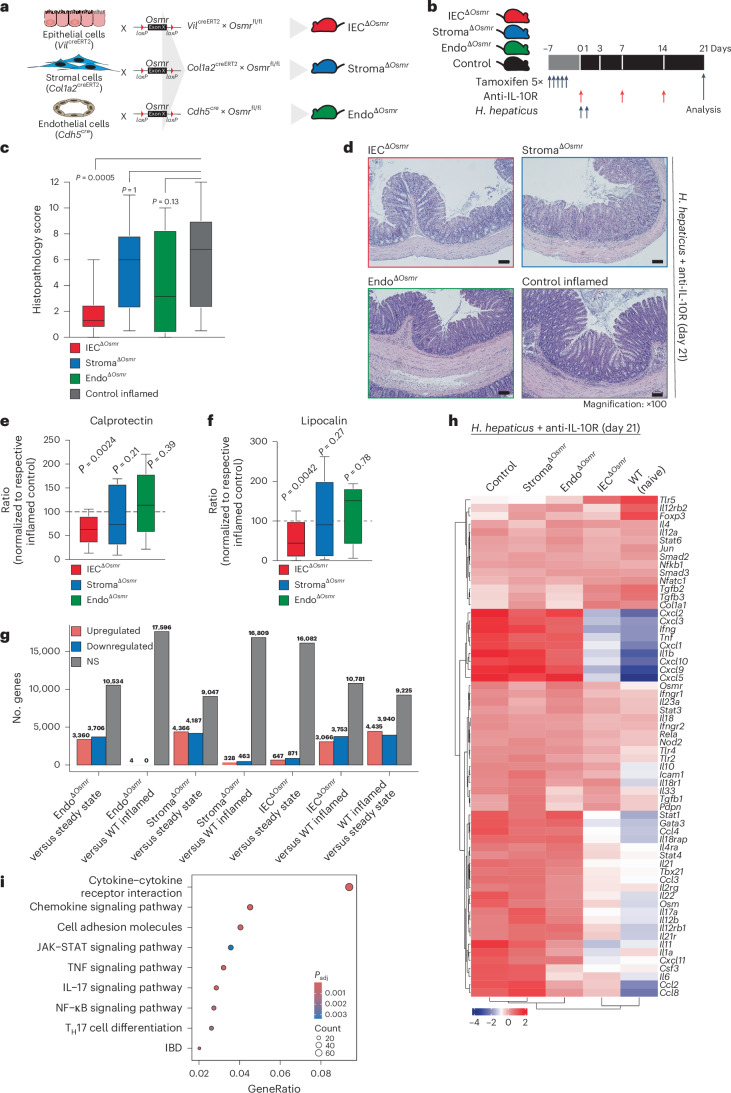
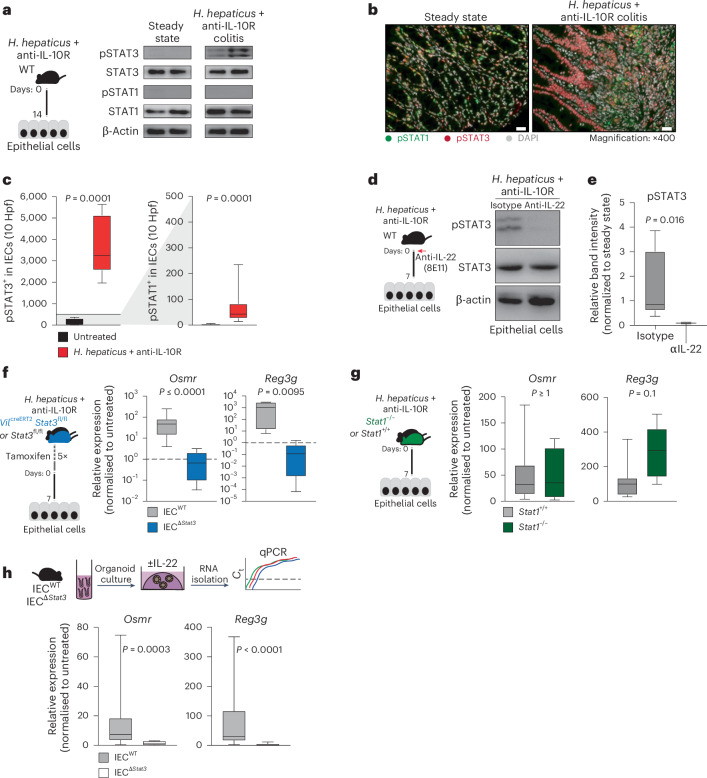
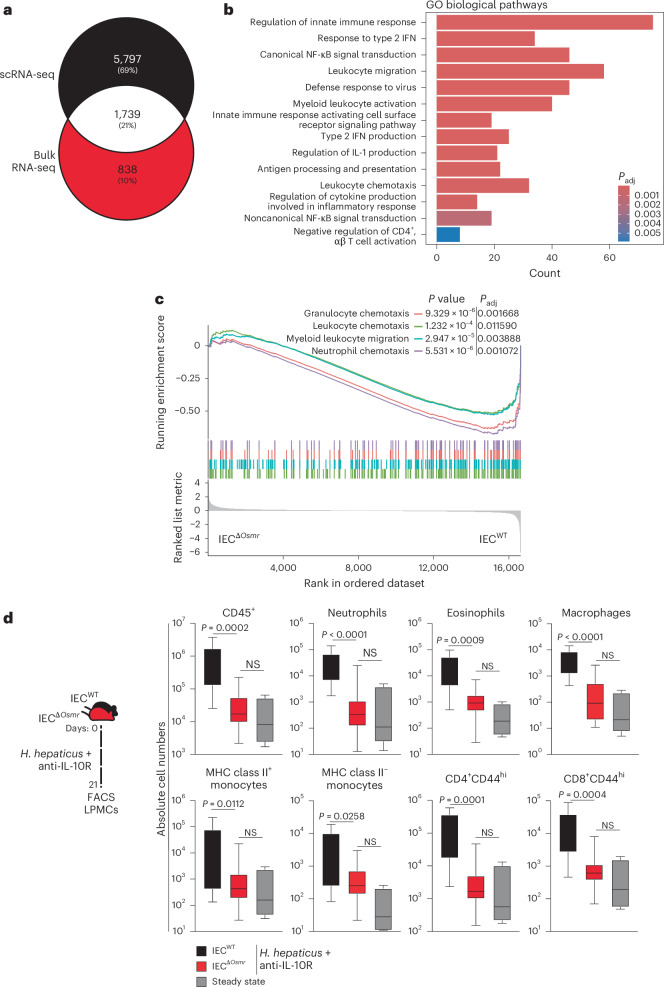
Multicellular cytokine networks drive intestinal inflammation and colitis-associated cancer (CAC). Interleukin-22 (IL-22) exerts both protective and pathogenic effects in the intestine, but the mechanisms that regulate this balance remain unclear. Here, we identify that IL-22 directly induces responsiveness to the IL-6 family cytokine oncostatin M (OSM) in intestinal epithelial cells (IECs) by activating STAT3 and upregulating the OSM receptor. In turn, OSM synergizes with IL-22 to sustain STAT3 activation in IECs and promote proinflammatory epithelial adaptation and immune cell chemotaxis to the inflamed intestine. Conditional deletion of the OSM receptor in IECs protects mice from both colitis and CAC, and pharmacological blockade of OSM attenuates established CAC. Thus, IL-22 and OSM form a pathogenic circuit that drives inflammation and tumorigenesis. Our findings reveal a previously unknown mechanism by which OSM supports intestinal pathology and highlight the IL-22-OSM axis as a promising therapeutic target for inflammatory bowel disease and CAC.


Conflict of interest statement

Competing interests: A.S., B.B., J.E.K., J.H., J.Z., M.K., J.R., L.W., M.E.K. and N.R.W. are current or former members of Genentech. N.R.W. and A.N.H. are inventors of patents relating to OSM as a therapeutic target for IBD (WO 2016/120625 A1). The remaining authors declare no competing interests.

Figures

Fig. 1
Fig. 1. Epithelial cells upregulate OSMR in intestinal inflammation.
a, Schematic of the H. hepaticus + anti-IL-10R-induced colitis time course study. b, Histopathology scores of colitis severity at days 3 (n = 6), 7 (n = 41), 14 (n = 23), 21 (n = 16) and >28 (n = 6), pooled from two to four experiments. Data are shown as mean ± s.e.m. and were analyzed by a Kruskal–Wallis test with a Dunn’s post hoc test. c, qPCR analysis of Osm and Osmr expression in colon tissue at days 3 (Osm/Osmr, n = 4/4), 7 (Osm/Osmr, n = 14/20), 14 (Osm/Osmr, n = 9/14), 21 (Osm/Osmr, n = 20/21) and >28 (Osm/Osmr, n = 10/13), normalized to steady-state controls. Data were pooled from two to four experiments and are shown as mean ± s.e.m. P values were calculated by (two-tailed) one-sample t-tests and Wilcoxon rank tests. di, Single-cell workflow: stromal (calcein⁺CD45⁻EpCAM⁻), immune (CD45⁺) and epithelial (EpCAM⁺) cells were sorted, pooled (three mice per pool, three pools per group) and processed with 10x Genomics (18 mice total). d, Experimental approach for single-cell workflow. e, Uniform manifold approximation and projection (UMAP) showing CD45⁺, epithelial and stromal cell clusters. f,g, UMAP (f) and quantification (g) of major cell populations within CD45+, epithelial and stromal clusters; DCs, dendritic cells; LPMCs, lamina propria mononuclear cells; NK, natural killer; Treg, regulatory T cells; TA cells, transit-amplifying cells. h, Relative Osm expression and percentage of Osm⁺ cells within the CD45⁺ cluster. i, Relative Osmr expression and Osmr⁺ cell frequency within epithelial clusters. Data are shown as mean ± s.e.m. and were analyzed by Wilcoxon rank-sum test; NS, not significant. j, qPCR analysis of epithelial Osmr expression at days 3, 7, 14, 21 and >28 (n = 4, 23, 12, 15 and 11, respectively), normalized to steady-state controls and pooled from two to four experiments. Data are shown as mean ± s.e.m. P values were calculated by (two-tailed) one-sample t-tests and Wilcoxon tests. k, ISH of Osmr in colon tissue from colitic (day 10, n = 3) and steady-state mice (n = 6). Purple signal indicates Osmr expression. Data were analyzed by ilastik-based quantification; scale bar, 20 μm. l, Quantification of Osmr⁺ cells by ISH in the lamina propria (pink) and epithelium (green) of colitic (day 7) versus steady-state mice (n = 6). Data were analyzed by Mann–Whitney U-test. m, qPCR of epithelial OSMR expression in healthy individuals and individuals with IBD (UC, n = 10; CD, n = 8). Data are shown as mean ± s.e.m.; statistical tests used were the same as in j. n, ISH of OSMR in mucosal biopsies from healthy individuals (n = 5) and individuals with UC (n = 12); brown dots indicate OSMR⁺ cells. Dashed lines demarcate the epithelium; scale bar, 20 μm.
Fig. 2
Fig. 2. OSMR expression in epithelial cells promotes intestinal inflammation.
a, Schematic illustrating the Osmr deletion strategy in different cell types. Cell-type-specific deleter mouse lines (VilcreERT2, Cdh5cre and Col1a2creERT2) were crossed with Osmrfl/fl mice to generate the indicated cell-type-specific Osmr knockouts. b, Timeline of tamoxifen administration and subsequent colitis induction. Respective littermate control mice (VilcreERT2–, Cdh5cre or Col1a2creERT2– crossed with Osmrfl/fl or VilcreERT+, Cdh5cre+ or Col1a2creERT2+ crossed with Osmrfl/wt) were used for each genotype. c, Histopathological scoring 21 days after colitis induction, based on two to three independent experiments (control inflamed, n = 31; IECΔOsmr, n = 13; StromaΔOsmr, n = 21; EndoΔOsmr, n = 12). Adjusted P values calculated from a Kruskal–Wallis test with Dunn’s post hoc comparisons indicate differences between OSMR-deficient and wild-type mice. d, Representative hematoxylin and eosin-stained colon sections from steady-state and inflamed mice of the indicated genotypes at day 21; scale bar, 100 μm. Sample sizes are as indicated in c. e,f, Calprotectin (e) and lipocalin (f) levels in fecal samples from the indicated genotypes, measured by enzyme-linked immunosorbent assay (ELISA) and normalized to their respective inflamed control mice. Data were pooled from two independent experiments (IECΔOsmr, n = 12; StromaΔOsmr, n = 12; EndoΔOsmr, n = 14). P values (two-tailed) were calculated by one-sample t-tests and Wilcoxon tests. g, Differentially expressed genes in colonic tissues (RNA-seq) of the indicated mouse lines compared to either steady-state mice or respective inflamed controls; WT, wild-type. h, Heat map displaying the expression of curated IBD pathway genes in colon tissue of the different mouse genotypes (n = 4–5 per group). i, Top biological processes enriched among differentially expressed genes in colon tissue from IECΔOsmr mice compared to respective inflamed controls (n = 4–5 per group); Padj, adjusted P value.
Fig. 3
Fig. 3. IL-22 induces and sustains OSMR expression in epithelial cells.
a, Schematic of colon organoids from female C57BL6/J mice exposed to stimuli for 24 h. Osmr expression was assessed by qPCR (three independent experiments with three biological replicates each); Ct, cycling threshold; IFN, interferon; E. coli, Escherichia coli; LPS, lipopolysaccharide; SCFA, short-chain fatty acid. b, Experimental setup for colitis induction. c, Il22 and Il22ra2 expression in colonic tissues from colitic mice at the following days: day 3 (Il22, n = 8; Il22ra2, n = 9), day 7 (Il22, n = 29; Il22ra2, n = 10), day 14 (Il22, n = 17; Il22ra2, n = 8), day 21 (Il22, n = 14; Il22ra2, n = 11) and >day 28 (Il22, n = 5; Il22ra2, n = 8). Data were pooled from two to five independent experiments and are shown as mean ± s.e.m. P values (two-tailed) were calculated by one-sample t-tests and Wilcoxon rank tests. d, Il22 expression detected by ISH in colon mucosa from steady-state and colitic mice (n = 2); scale bar, 20 μm. e,f, Il22–/– and cohoused wild-type mice analyzed 7 days after colitis induction. qPCR analysis (e; Osmr, Reg3g, Reg3b and Socs3) in epithelial cells (data normalized to steady-state controls; n = 10 per genotype, two experiments) and histopathological scoring (f; n = 10 per genotype, two experiments) are shown; scale bar, 100 μm. gi, Wild-type mice with H. hepaticus + anti-IL-10R colitis treated with anti-IL-22 (n = 9) or isotype control (n = 15) on days 0 and 3 and analyzed on day 7. g, qPCR of epithelial gene expression. h, Histopathological scoring (two experiments). i, Osmr expression detected by ISH (brown punctae); top, ISH with hematoxylin staining; bottom, ilastik-processed image (n = 3–6 per group); scale bar, 20 μm. jl, H. hepaticus + anti-IL-10R colitis induced in Vilcre+ × Il22ra1fl/fl or Vilcre– × Il22ra1fl/fl mice, analyzed on day 7 (n = 6 per genotype). j, qPCR for Osmr and Reg3g expression in epithelial cells normalized to steady-state controls. k,l, Histopathological scoring (k) and CD45+ cell abundance (l). m, Wild-type mice with H. hepaticus + anti-IL-10R colitis treated with anti-IL-22 (n = 9) or isotype control (n = 11) on days 7 and 10; data were analyzed on day 14. qPCR was performed on Osmr and Reg3g in epithelial cells (two independent experiments). Data are shown as mean ± s.e.m. P values (two-tailed) were calculated using a Mann–Whitney test for eh, j, k and m.
Fig. 4
Fig. 4. Induction of OSMR in epithelial cells is dependent on STAT3.
a, H. hepaticus + anti-IL-10R colitis was induced in wild-type mice for 14 days. Protein analysis of IECs from steady-state (n = 4) and H. hepaticus + anti-IL-10R (n = 5) colitic mice was conducted. The western blot depicts phosphorylated STAT1 (pSTAT1), STAT1, pSTAT3, STAT3 and β-actin for representative samples from two experiments. b,c, Immunofluorescence staining for pSTAT1 and pSTAT3 in steady-state (n = 7) and inflamed (n = 10) mouse samples (b) with subsequent quantification (c) in the epithelium; scale bar, 20 μm. Hpf, high-power field. Data were pooled from two experiments. d,e, H. hepaticus + anti-IL-10R colitis was induced in wild-type mice for 7 days, and mice were treated with anti-IL-22 (clone 8e11, n = 4) or isotype control (mouse IgG1, GP120:9709, n = 5) on days 0 and 3 of colitis induction. Protein analysis of IECs from steady-state and H. hepaticus + anti-IL-10R colitic mice and anti-IL-22 or isotype-treated inflamed mice was performed. d, Western blot depicting STAT3 phosphorylation in epithelial cells from anti-IL-22- or isotype-treated colitic mice. Data are representative of two independent experiments. e, Quantification of STAT3 phosphorylation using ImageJ. The relative band intensity of blots from inflamed mice was normalized to that of steady-state untreated mice. f,g, Colitis was induced in VilcreERT2Stat3fl/fl (IECΔStat3) or VilcreERT2Stat3fl/wt (IECWT; f) and Stat1–/– or Stat1+/+ (g) mice using the H. hepaticus + anti-IL-10R model for 7 days. qPCR analysis was performed to assess the expression of Osmr and Reg3g in epithelial cells from inflamed mice normalized to epithelial cells isolated from untreated respective control mice. Data are representative of one experiment; n = 5–7 mice per genotype. h, Mouse colon organoids generated from Vilcre+Stat3fl/fl (IECΔStat3) or Vilcre-Stat3fl/fl (IECWT) mice and stimulated with 10 ng ml–1 IL-22. Relative expression of Osmr was analyzed by qPCR. Data are representative of three independent experiments from three independent biological replicates. P values (two-tailed) were calculated using a Mann–Whitney test for c and eh. Source data
Fig. 5
Fig. 5. ILC3s promote OSMR expression in IECs in H. hepaticus-induced colitis.
a,b, H. hepaticus + anti-IL-10R colitis was induced in wild-type mice for 7 days. Percentage (a) and absolute cell numbers (b), respectively, of IL-22- or Ki67-expressing CD45+Lin (that is, live CD45+CD19CD11cLy6G/CF4/80FcεRIα) LPMCs in naive mice and colitic mice were assessed. Flow cytometry-assessed cytokine expression after stimulation with phorbol 12-myristate 13-acetate (PMA)/ionomycin, IL-23 and IL-1β is shown. Data are representative of two experiments; n = 12. c, Representative gating strategy for identifying αβ and γδ T cells and different ILC subsets in colitic mice. ILC subsets were identified by flow cytometry of mouse LPMCs. The ILC population was characterized as CD45+Lin (that is, CD19CD11cLy6G/CF4/80FcERIαTCRαTCRγ) and live cells. Subsets were further defined based on transcription factor expression: ILC3 (RORγt+LinTCRαTCRγ), ILC2 (GATA3+RORγtT-betEomesLinTCRαTCRγ), ILC1 (T-bet+EomesRORγtLinTCRαTCRγ) and natural killer cells (T-bet+Eomes+RORγtLinTCRαTCRγ). d, Pie chart showing the indicated cell populations within total IL-22+CD45+CD19CD11cLy6G/CF4/80FcεRIα cells in steady-state and inflamed mice on day 7 of colitis. e,f, IL-22 production by different ILC populations identified as described in c. Data are representative of two experiments; n = 12. P values are derived from Mann–Whitney U-tests. g, H. hepaticus + anti-IL-10R colitis was induced in wild-type mice. Mice were treated with anti-IL-12p40, anti-IL-23p19 or isotype control on day 0 and analyzed on day 7. Osmr (left) and Reg3g (right) expression was quantified in epithelial cells by qPCR. Data are representative of one to two independent experiments; n = 6–29 per time point. Adjusted P values were obtained using a Kruskal–Wallis test followed by a Dunn’s multiple comparisons test. hj, H. hepaticus + anti-IL-10R colitis was induced in Rag2–/–Rorc–/– and Rag2–/– mice for 7 days. h,i, qPCR gene expression analysis of Osmr (h) and Il22 and Ifng (i) in colonic IECs from inflamed Rag2–/–Rorc–/– and Rag2–/– mice normalized to steady-state mice. j, Histopathological scoring of colitis in Rag2–/–Rorc–/– and Rag2–/– mice on day 7 of colitis. Data are from one to two independent experiments; n ≥ 6. P values (two-tailed) were calculated using a Mann–Whitney test in a, b, f and hj.
Fig. 6
Fig. 6. OSM signaling in epithelial cells promotes STAT3 activation.
a, Workflow schematic for scRNA-seq sample preparation (left) and volcano plot depicting differentially expressed genes in enterocytes between inflamed mice after colitis induction and steady-state (see Fig. 1d). Red dots represent genes that are expressed at least twofold higher with statistical significance. b, Significantly enriched (adjusted P < 0.05) gene set enrichment analysis (GSEA) terms in enterocytes from scRNA-seq data derived from a; adjusted P values were calculated using the Benjamini–Hochberg test. c, PROGENy pathway activity scores derived from epithelial scRNA-seq data. PROGENy is a computational method that leverages a large compendium of publicly available perturbation experiments to identify a core set of pathway responsive genes, enabling the inference of pathway activity from transcriptomic data. d, Left, experimental workflow of bulk RNA-seq of sorted epithelial cells from IECΔOsmr and control mice. H. hepaticus + anti-IL-10R colitis was induced in IECΔOsmr and control mice (littermates). IECs were sorted from both genotypes on day 21 and subjected to bulk RNA-seq. Right, volcano plot depicting differentially expressed genes in IECs between inflamed IECΔOsmr and control mice (n = 5 per group). Red dots represent genes that are expressed at least twofold higher with statistical significance. e, Significantly enriched (adjusted P < 0.05) GSEA terms in epithelial cells from bulk RNA-seq data derived from d; adjusted P values were calculated using the Benjamini–Hochberg test. f, PROGENy pathway activity scores derived from epithelial bulk RNA-seq data in d.
Fig. 7
Fig. 7. OSM signaling in epithelial cells promotes leukocyte recruitment.
a, Venn diagram representing the overlap of differentially expressed genes in epithelial bulk and scRNA-seq datasets from Fig. 6a,d. b, Significantly enriched (adjusted P < 0.05) Gene Ontology terms of the overlapping genes from both comparisons in Fig. 6a,d; adjusted P values were calculated using the Benjamini–Hochberg test. c, GSEA plot depicting the enrichment of differentially expressed genes from pathways related to cell chemotaxis in epithelial cells comparing inflamed IECΔOsmr and control mice, as in Fig. 6d. d, H. hepaticus + anti-IL-10R colitis was induced in IECΔOsmr (n = 13) and control mice (n = 11). The immune cell composition in the lamina propria was analyzed by flow cytometry on day 21 of inflammation. Data are representative of two independent experiments. P values (two-tailed) were calculated using a Mann–Whitney U-test comparing IECΔOsmr and control mice.
Fig. 8
Fig. 8. OSMR expression in epithelial cells is essential for CAC.
a, Wild-type mice underwent AOM/DSS-induced CAC. Colon tissues from tumor-bearing mice were analyzed by ISH for Osmr (blue) and Pdgfra (red; stromal marker); scale bars, 1,000 μm (left) and 200 μm (two insets on the right). b, Spatial transcriptomics analysis of a biopsy from an individual with CAC, including tumor tissue (red box) and adjacent normal mucosa (green box). OSM and OSMR expression was assessed in epithelial and nonepithelial cells using epithelial (EPCAM, CDH1, KRT20, MUC5B and MKI67) and nonepithelial markers (CD3E, CD4, CD14, CD68, C1QC, CD19, CD79A, PDGFRA, VIM, PECAM1, CD34 and KIT); scale bar, 1,000 μm (left) and 100 μm (insets on the right). c, Quantification of OSMR expression in epithelial and nonepithelial cells in CAC (n = 10, red bars) and healthy control (n = 3, black bars) tissue, along with nonepithelial OSM expression. d, Experimental schematic comparing CAC induction in wild-type versus Osm–/– mice. Representative colonoscopy images and tumor burden on day 80 are shown (n = 25 per genotype). e, Wild-type mice received AOM and DSS, followed by treatment with anti-OSM (n = 28) or isotype antibody (rIgG2a; n = 26). Tumor burden, multiplicity and volume were assessed on day 80. Data are shown normalized to the isotype-treated group. f, Immunostaining for pSTAT3 in colon tumors and adjacent normal tissues from mice treated as in e; scale bar, 200 μm. g, Quantification of pSTAT3+ epithelial cells (n = 10 per group). h, Relative pSTAT3 expression intensity normalized to that observed in control tissue (n = 10 per group). Data are derived from two experiments. P values (two-tailed) were calculated from one-sample t-tests and Wilcoxon rank tests. i,j, VilcreERT2+Osmrfl/fl (IECΔOsmr; n = 15) and VilcreERT2+Osmrwt/wt (IECWT; n = 18) mice were treated with AOM/DSS to induce CAC. Tamoxifen administration induced epithelial-specific Osmr deletion. i, Experimental design and representative colon images. j, Tumor burden, multiplicity and average volumes from two independent experiments. Data are shown normalized to the VilcreERT2+Osmrwt/wt group. P values (two-tailed) were calculated using a Mann–Whitney test in ce, g and j.
Extended Data Fig. 1
Extended Data Fig. 1. Single-cell RNA sequencing of lamina propria CD45+ cells, epithelial cells, and stromal cells.
(a) UMAP visualization of all sequenced single-cell transcriptomes derived from stromal cells, epithelial cells, and CD45+ cells, labeled by cell hashtags. (b) UMAP visualization of all sequenced single-cell transcriptomes derived from stromal cells, epithelial cells, and CD45+ cells, labeled by experimental condition. (c) Cell proportion changes (y-axis) for non-inflamed (black) and inflamed (red) samples (3 mice/pool, 3 pools/group, Mean ± SEM; Wilcoxon rank-sum test). (d, e) Relative Osm gene expression in stromal (d) (calcein+, CD45-, EpCAM-) and epithelial (e) (EpCAM+, CD45-) cells (3 mice/pool, 3 pools/group,Mean ± SEM; Wilcoxon rank-sum test). (f) Absolute counts (upper panel) and proportions (lower panel) of immune cell populations among Osm-expressing cells in steady-state mice and after H. hepaticus + αIL-10R colitis induction. (g) Osmr relative expression and percentage of Osmr-expressing stromal cells (3 mice/pool, 3 pools/group, Mean ± SEM; Wilcoxon rank-sum test). (h) Osmr relative gene expression in CD45+ cells (3 mice/pool, 3 pools/group, Mean ± SEM; Wilcoxon rank-sum test).
Extended Data Fig. 2
Extended Data Fig. 2. Regulation of Osmr expression in mouse colon during steady-state and colitis.
(a) To confirm that epithelial cells are the primary source of OSMR expression in epithelial washes, we enriched epithelial cells using MACS from epithelial washes of inflamed colitic mice. FACS analysis of the epithelial washes is shown before and after the MACS enrichment. Subsequently, Osmr was quantified by qPCR (right bar graph). Data representative of one experiment (n = 6). (b) qPCR analysis of the indicated genes within epithelial washes was conducted to confirm the absence of cellular contamination. Data representative of one experiment (n = 6). (c) Quantification of Osmr expression in epithelial cells by qPCR (Mean ± SEM; aIL-10R, n = 3, H. hepaticus, n = 4; H.h. + αIL-10R, n = 17)). Epithelial cells were isolated from the indicated groups. (d) OSMR expression was assessed by flow cytometry in epithelial cells isolated from the indicated groups (left, histogram). Normalized OSMR expression is shown at the indicated time points after colitis induction (right, bar graph), calculated relative to the staining control for each individual mouse (SS, n = 15: day 7, n = 6, day 14, n = 4). (c, d) P-values were calculated using the Kruskal-Wallis test followed by Dunn’s multiple comparisons test. (e) Representative flow cytometry gating strategy for the identification of colon epithelial (EpCAM⁺) and endothelial (CD31⁺) cells in steady-state conditions. Histograms display OSMR expression levels in EpCAM⁺ epithelial cells (bottom) and CD31⁺ endothelial cells (top) from Cdh5Cre+ × Osmrfl/fl and Cdh5Cre- × Osmrfl/fl mice. The geometric mean fluorescence intensity (Geo mean) of OSMR-PE is indicated for each group, including a control stained only with the secondary antibody. (f) Cell-cell interaction analysis (CellPhoneDB) between Osm+ immune cells and Osmr+ epithelial cells. Analysis derived from scRNAseq analysis (Fig. 1d).
Extended Data Fig. 3
Extended Data Fig. 3. Temporal dynamics of Osmr expression in colonic epithelium and lamina propria during colitis progression.
(a-g) ISH was performed to detect Osmr expression in colon tissue from steady-state and H.h. + αIL-10R-induced colitic mice, with hematoxylin counterstaining. Image processing was conducted using Ilastik, and Osmr expression was quantified with ImageJ. At various time points after colitis induction, the following numbers of mice and images were made and analyzed: Day 0 (steady state), 6 mice with 130 images; Day 3, 2 mice with 50 images; Day 7, 8 mice with 100 images; Day 14, 3 mice with 80 images; and Day 21, 4 mice with 100 images. (a) Representative images of colon sections at different time points (day 0, 3, 7, 14, and 21) after colitis induction. Top row: original image with Osmr ISH and hematoxylin staining. Middle row: Segmentation analysis using Ilastik showing Osmr localization in epithelial cells (blue), lamina propria (orange), and submucosa/muscularis (black). Bottom row: Osmr mRNA expression segregated according to location. Scale bar: 20 μm. (b) Representative images showing peptide/prolyl isomerase B (Ppib) expression as a positive control for ISH and a duplex negative control probe. Scale bar: 20 μm. (c-d) Quantification of Osmr+ counts (c) and Osmr⁺ stain area in epithelial (blue) and lamina propria (red) compartments (d) over time. Statistical analysis was performed using the Kruskal-Wallis test with multiple comparisons relative to Day 0 (steady state). (e) To better visualize relative fold changes in Osmr expression in epithelial vs lamina propria compartments, Osmr counts from (c) were normalized to total tissue area in epithelial cells and lamina propria. Statistical analysis was performed using two-way ANOVA with multiple comparisons. The overall significance of time and expression is depicted in bold. (f, g) Correlation analyses between Osmr expression in different tissue compartments and histopathology scores. Scatter plots illustrate the relationship between Osmr⁺ stain area or Osmr⁺ counts and the severity of colitis, as assessed by histopathological scoring. Pearson correlation coefficients (r) and p-values are provided for each analysis.
Extended Data Fig. 4
Extended Data Fig. 4. Increased OSMR expression in ulcerative colitis correlates with histopathological severity.
(a) Representative images of OSMR mRNA expression detected by ISH in colon tissue from non-IBD controls (n = 3) and UC (n = 3) patients. Epithelial cell regions are identified by dashed lines. Scale bar: 50 μm. (b) Exemplary positive and negative control probes for human RNAScope in ISH. Scale bar: 20 μm. (c) Correlation between OSMR protein expression in colon epithelial cells and histopathology score in patients with IBD (UC, n = 4; CD, n = 5) and healthy controls (n = 2), with each patient having 2–4 sampled locations. Scatter plot showing the relationship between normalized epithelial OSMR protein expression assessed by flow cytometry and histopathology score in IBD patients. Pearson correlation and significance depicted.
Extended Data Fig. 5
Extended Data Fig. 5. Epithelial Osmr expression is induced during C. rodentium infection and regulated by IL-22 and IL-23.
(a) Experimental timeline of C. rodentium infection and colitis over 21 days. (b) Colon histopathology scores in wild-type mice at various time points post-infection (n = 12/time point, 2 experiments; Kruskal-Wallis with Dunn’s test). (c, d) Time-resolved expression of Osm and Osmr mRNA in colonic tissue (n = 12/time point; one-sample Wilcoxon test). (e) OSMR protein levels in epithelial cells on day 7 post-infection vs. uninfected controls (n = 7/group; Mann-Whitney U test). (f) Schematic of tamoxifen-induced IECΔOsmr model for epithelial-specific Osmr deletion. (g) Histopathology scores comparing IECΔOsmr and control mice after infection (n = 12/group; Mann-Whitney U test). (h) Bacterial burden (CFU) in colon, spleen, and liver of IECΔOsmr vs. control mice (n = 12/group; Mann-Whitney U test). (i) Il22 mRNA expression at different time points post-infection (n = 12/time point; one-sample Wilcoxon test). (j) Osmr and Reg3g expression in epithelial cells following IL-22 blockade (n = 6–8/group; Mann-Whitney U test). (k) Frequency of IL-22⁺ ILC3 cells in uninfected (n = 6) and infected mice (n = 8/group; Mann-Whitney U test). (l) Osmr and Il22 expression after IL-23 blockade during infection (uninfected, n = 6; C. rodentium, n = 7; Mann-Whitney U test). (m) Immune profiling in IECΔOsmr vs. wild-type mice, highlighting altered frequencies of CD45⁺ cells, neutrophils, monocytes, eosinophils, and CD4⁺CD44⁺ T cells (n = 12/group; Kruskal-Wallis with Dunn’s test).
Extended Data Fig. 6
Extended Data Fig. 6. Analysis of Osmr expression and response to IL-22 in mouse and human epithelial organoids.
(a) High-throughput q-PCR analysis performed on the Fluidigm Biomark platform using the depicted primers. Data are from pooled from three independent biological replicates. Expression levels were normalized to the median expression and log2 transformed. (b) Colon epithelial organoids derived from C57BL/6 J wild-type mice treated with 10 ng/ml IL-22 over a time course of 3-48 h. Gene expression of Osmr, Reg3g, and Socs3 at each time point was analyzed by q-PCR and normalized to the unstimulated control. Two independent replicates are shown. (c) Human colon epithelial organoids established from specimens of healthy individuals and patients with IBD stimulated with indicated stimuli for 24 h. Statistical analysis was one-way ANOVA with Dunn’s multiple comparisons test; n = 4. (d) ISH detection of Il22 mRNA in colonic mucosal samples from inflamed Il22-/- mice (punctate brown signal) confirming the specificity of the RNAscope Il22 probe. Scale bar: 20 μm. (e) ISH detection of Osmr (left, red punctate) and Il22 (right, brown punctate) mRNA expression in colonic tissue of sequential slides following 14 days of colitis induction in wild-type mice. Scale bar: 20 μm. (f-g) Correlation between human OSMR expression and IL22 enrichment scores in three independent datasets. (f) Correlation analyses in UC colon samples from three independent cohorts: UNIFI trial (GSE206285; n = 532), Mount Sinai cohort (GSE193677; n = 293), and IBDome cohort (n = 64).(g) Correlation analyses in CD ileum samples from three independent cohorts: RISC cohort (GSE57945; n = 191), Mount Sinai cohort (GSE193677; n = 162), and IBDome cohort (n = 81). Spearman’s correlation coefficient (r) and corresponding P-values are indicated in each panel.
Extended Data Fig. 7
Extended Data Fig. 7. STAT signaling in mouse colon organoids and epithelial cell line following cytokine stimulation.
(a) Immunofluorescence staining for pSTAT1 and pSTAT3 in steady-state (n = 7) and inflamed (n = 10) mouse samples with subsequent quantification in colon lamina propria. Data pooled from two experiments. P-values are from Mann-Whitney U tests. (b) Western blot analysis of pSTAT3, total STAT3, and β-actin in mouse colon organoids treated with the indicated cytokines. Data are representative of two independent experiments. (c) Western blot analysis of pSTAT1, total STAT1, and β-actin in mouse colon organoids treated with indicated cytokines. Data are representative of two independent experiments. (d) Western blot analysis of pSTAT1, total STAT1, and β-actin in the human Caco2 cell line (left panel) was performed to confirm functionality of pSTAT1 antibody. Epithelial cells from C57BL/6 J mice with induced inflammation at days 7 and 14 (n = 5) were also analyzed (right panel). pSTAT1, total STAT1, and β-actin in steady state epithelial cells from C57BL/6 J mice are shown in Fig. 4a. (e) Colon epithelial organoids isolated from C57BL/6 mice were treated with JAK/STAT pathway inhibitors (50 μM fludarabine, 25 μM STA-21, 2.5 μM ruxolitinib, or 2.5 μM tofacitinib) for 6 h, and 10 ng/mL of IL-22 was added for another 6 h. 0.1% DMSO was used as inhibitor control. Relative expression of Osmr was analyzed by qPCR. Data are shown for n = 2 biological replicates with n = 3 technical replicates. Graph displays mean ± SEM. P-values are derived from Kruskal-Wallis test. Source data
Extended Data Fig. 8
Extended Data Fig. 8. Flow cytometry analysis of IL-22 production by ILC subsets in naive and colitic mice.
(a) Gating strategy used to identify CD45⁺ cells for analysis in Fig. 5c. (b) Ki67 expression in total ILCs (Lineage⁻, TCRα⁻, TCRγ, CD90⁺) from colitic mice. n = 12 per condition from two independent experiments. Mann-Whitney U test. (c) IL-22 frequency in ILCs and T cells from colitic wild-type mice (H.h. + αIL-10R, day 7), measured by flow cytometry following PMA/ionomycin, IL-23, and IL-1β stimulation. n = 12; two experiments. (d) Cytokine profiles of ILC subsets: ILC3s (RORγt⁺), ILC1s (T-bet⁺, Eomes⁻), ILC2s (GATA3⁺), and NK cells (T-bet⁺, Eomes⁺); all Lineage⁻, TCRα⁻, TCRγ⁻. Assessed post-stimulation as in (c). n = 12; two experiments. (e, f) H.h. + αIL-10R colitis with anti-IL-12p40 or isotype control treatment (day 0, analysis on day 7). (e) Il22 expression in colon tissue by qPCR. (f) Histopathology scores. Data pooled from two experiments, n = 8 mice/group. (g, h) H.h. + αIL-10R colitis with anti-IL-23p19 or isotype control treatment (day 0, analysis on day 7). (g) Il22 expression in colon tissue by qPCR. (h) Histopathology scores. Data from one experiment, n = 6 mice/group. (i, j) Colitis induced in Rag2⁻/⁻ and Rag2⁺/⁺ mice for two weeks. (i) Colon histopathology scores. (j) Osmr expression in IECs normalized to steady-state controls. n = 6–8 mice/group from two independent experiments. All graphs show mean ± SEM; P-values determined by Mann-Whitney U test.
Extended Data Fig. 9
Extended Data Fig. 9. OSM impact on intestinal epithelial cells.
(a) Human HCA-7 colon epithelial cells were stimulated with 100 ng/ml of rhIL-22 or rhOSM for 30 min, 24 or 48 h. Subsequently, pSTAT3 was quantified in cell lysates using an electrochemiluminescence assay (MSD). Data are representative of two independent experiments, each with three technical replicates. P-values derived from a 2-way comparison using Tukey’s multiple comparison test. (b) Analysis of STAT3 phosphorylation after colitis induction in IECs from IECΔOsmr and control mice (values normalized to those from steady-state mice). P-values are derived from Mann–Whitney U test. Data are representative of two independent experiments; n = 6 mice per group. (c) Volcano plot depicting differentially expressed genes in the epithelial cell line, HCA-7, after treatment with rhOSM for 24 h as described in (a). (d) GSEA plot depicting enrichment of OSM-activated genes in epithelial cells (defined in analysis shown in panel c) comparing inflamed IECΔOsmr and control mice, as in Fig. 6d.
Extended Data Fig. 10
Extended Data Fig. 10. OSM and OSMR expression in colitis-associated cancer.
(a) Percentage of Ki67⁺ cells within Epcam⁺ epithelial cells from IECΔOsmr and control mice at day 21 post-colitis. Data represent two experiments (n = 12); Mann–Whitney U test. (b) Osm and Osmr expression in normal colon (n = 10) vs. CAC (n = 14) tissue from the GSE210970 dataset (Mann–Whitney U test). (c, d) Spearman correlation of Osm (c) and Osmr (d) with Socs3 or Stat3 in GSE210970 dataset. (e) Representative healthy colon (n = 3) biopsy analyzed by spatial transcriptomics shows OSM and OSMR expression in epithelial and non-epithelial cells. Cell types identified via canonical epithelial (EPCAM, CDH1, KRT20, MUC5B, MKI67) and non-epithelial markers (CD3E, CD4, CD14, CD68, C1QC, CD19, CD79A, PDGFRA, VIM, PECAM1, CD34, KIT). (f) Osmr expression in colon epithelial washes from wild-type mice following either DSS-induced colitis (1 cycle, n = 10) or CAC induction via AOM + DSS (3 cycles, n = 18). Mann–Whitney U test with direct comparison with steady state (n = 5). (g, h) DSS colitis mice treated with anti-IL-22 (clone 8e11, n = 10) or isotype control (n = 10). Osmr and Socs3 expression in epithelial cells assessed by qPCR; one-way Anova with Tukey’s multiple comparisons test. (i) Spearman correlation of Osmr with Il12b in GSE210970 dataset. (jm) CAC induced via AOM + DSS. Tumor development confirmed by endoscopy, followed by treatment with anti-IL-22 (8e11, n = 4), anti-IL-12p40 (C17.8, n = 6), or isotype controls (n = 6) for one week. (k, l) Osmr and Socs3 expression in tumor epithelial cells; (m) Il22 expression in total tumor tissue. One-way ANOVA with Holm-Sidak’s test.

References

    1. Friedrich, M., Pohin, M. & Powrie, F. Cytokine networks in the pathophysiology of inflammatory bowel disease. Immunity50, 992–1006 (2019). - PubMed
    1. Francescone, R., Hou, V. & Grivennikov, S. I. Cytokines, IBD and colitis-associated cancer. Inflamm. Bowel Dis.21, 409–418 (2015). - PMC - PubMed
    1. Neurath, M. F. Cytokines in inflammatory bowel disease. Nat. Rev. Immunol.14, 329–342 (2014). - PubMed
    1. West, N. R., Owens, B. M. J. & Hegazy, A. N. The oncostatin M–stromal cell axis in health and disease. Scand. J. Immunol.176, e12694 (2018). - PubMed
    1. Richards, C. D. & Richards, C. D. The enigmatic cytokine oncostatin M and roles in disease. ISRN Inflamm.2013, 512103 (2013). - PMC - PubMed

MeSH terms

LinkOut - more resources