

Association between the dietary index of gut microbiota and abnormal bowel symptoms in U.S. adults: a cross-sectional study based on NHANES 2007-2010
- PMID: 40447995
- PMCID: PMC12124043
- DOI: 10.1186/s12876-025-04021-8
Association between the dietary index of gut microbiota and abnormal bowel symptoms in U.S. adults: a cross-sectional study based on NHANES 2007-2010
Abstract
Background: The Dietary Index of Gut Microbiota (DI-GM) is a newly developed measure for assessing diet quality in relation to the diversity of the gut microbiome. However, whether it is associated with the risk of chronic constipation and chronic diarrhea remains unclear.
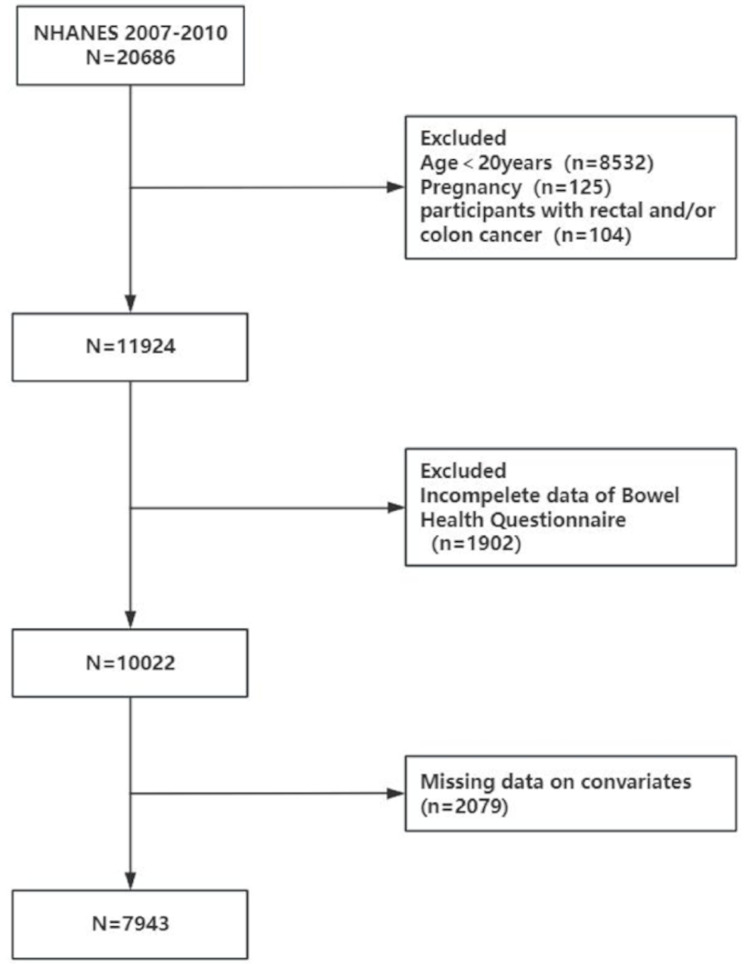
Methods: We analyzed data from 7,943 U.S. adults aged 20 years and older who participated in the 2007-2010 National Health and Nutrition Examination Survey (NHANES). Weighted logistic regression, subgroup analysis, and restricted cubic spline (RCS) models were used to assess the association between the DI-GM and abnormal bowel symptoms.
Results: A higher DI-GM score was significantly associated with a reduced risk of abnormal bowel symptoms. For each 1-point increase in the DI-GM, the risk of constipation decreased by 12.4% (OR = 0.876, 95% CI = 0.806-0.951, p = 0.002), and the risk of diarrhea decreased by 14.1% (OR = 0.859, 95% CI = 0.789-0.936, p < 0.001). Compared with the lowest DI-GM quartile, the highest quartile showed a markedly lower risk of both constipation (OR = 0.487, 95% CI = 0.340-0.696, p < 0.001) and diarrhea (OR = 0.480, 95% CI = 0.338-0.682, p < 0.001). RCS analysis indicated a significant linear association between the DI-GM and the risks of both constipation (nonlinear p = 0.686) and diarrhea (nonlinear p = 0.136).
Conclusions: The DI-GM was negatively associated with the prevalence of abnormal bowel symptoms. Further longitudinal studies are warranted to confirm these findings and to inform dietary strategies for gut health.
Keywords: Abnormal bowel symptoms NHANES; DI-GM; Diet; Health.
© 2025. The Author(s).
Conflict of interest statement
Declarations. Ethics approval and consent to participation: The study analyzed data downloaded from the National Health and Nutrition Examination Survey public database. The National Center for Health Statistics Ethics Review Committee granted ethics approval. The methods involved in this study were conducted in accordance with relevant guidelines and regulations (Declaration of Helsinki). All individuals provided written informed consent before participating in the study. Details are available at https://www.cdc.gov/nchs/nhanes/irba98.htm . The current study was deemed exempt from further review because the data used are deidentified and publicly accessible. Consent for publication: Not applicable. Competing interests: The authors declare no competing interests.
Figures


References
-
- Chu C, Rotondo-Trivette S, Michail S. Chronic diarrhea. Curr Probl Pediatr Adolesc Health Care. 2020;50:100841. - PubMed
MeSH terms
Grants and funding
- GSW2021046/Suzhou Municipal Health Commission
- GSW2021046/Suzhou Municipal Health Commission
- GSW2021046/Suzhou Municipal Health Commission
- GSW2021046/Suzhou Municipal Health Commission
- GSW2021046/Suzhou Municipal Health Commission
- GSW2021046/Suzhou Municipal Health Commission
- GSW2021046/Suzhou Municipal Health Commission
- BK20211085/Natural Science Foundation of Jiangsu Province
- BK20211085/Natural Science Foundation of Jiangsu Province
- BK20211085/Natural Science Foundation of Jiangsu Province
- BK20211085/Natural Science Foundation of Jiangsu Province
- BK20211085/Natural Science Foundation of Jiangsu Province
- BK20211085/Natural Science Foundation of Jiangsu Province
- BK20211085/Natural Science Foundation of Jiangsu Province
- SS2019073/Suzhou Municipal Science and Technology Bureau
- SS2019073/Suzhou Municipal Science and Technology Bureau
- SS2019073/Suzhou Municipal Science and Technology Bureau
- SS2019073/Suzhou Municipal Science and Technology Bureau
- SS2019073/Suzhou Municipal Science and Technology Bureau
- SS2019073/Suzhou Municipal Science and Technology Bureau
- SS2019073/Suzhou Municipal Science and Technology Bureau
LinkOut - more resources
Full Text Sources
Medical
